
Trans. Nonferrous Met. Soc. China 27(2017) 763-770
Temperature dependence of microstructure and texture in cold drawn aluminum wire
Xiao-guang MA1, Jian CHEN2, Yang YANG2, Lei LI2, Zheng CHEN1, Wen YAN2
1. State Key Laboratory of Solidification Processing, School of Materials Science and Engineering, Northwestern Polytechnical University, Xi��an 710072, China;
2. School of Materials Science and Chemical Engineering, Xi��an Technological University, Xi��an 710021, China
Received 26 February 2016; accepted 5 July 2016
Abstract:
The effect of strain and drawing temperature on the evolution of microstructure and fiber textures of aluminum wires drawn at room temperature and cryogenic temperature was investigated by TEM and EBSD observations. The results show that low angle boundaries frequency increases and high angle boundaries frequency decreases with strain increasing when the strain is low. At high strain, most of grain and dislocation boundaries are parallel to the drawn direction and low angle boundaries frequency decreases and high angle boundaries frequency increases with strain increasing. The decrease of deformation temperature leads to microstructure finer and low angle boundaries frequency increasing. Texture analysis indicates that volume fraction of complex texture component decreases with strain increasing and a mixture of <111> and <100> fiber texture forms at high strain. <111> is stable at low strains but <100> becomes stable at high strain. The decrease of temperature can enhance the stability of <111> orientation at high strain.
Key words:
aluminum wire; cryogenic drawn deformation; dislocation boundary; fiber texture; misorientation angle distribution;
1 Introduction
Because of excellent mechanical behavior of ultra-fine crystal materials, preparations have been extensively studied in the past decades [1-3]. Cold drawn deformation can be used to prepare ultra-fine crystal materials [1] and super-fine bonding wires [3]. In order to understand their properties, microstructure and texture of cold-drawn metal wires have received wide attention [3-5].
During deformation process, the evolution of microstructure and texture is closely relative to stacking fault energy (SFE) [6,7]. For example, PIERCE et al [7] researched on equal channel angular pressing (ECAP) and showed that with the SFE decreasing, grain refinement mechanism transforms from dislocation slip to twin splitting and the minimum critical grain size of ultrafine crystal materials decreases. The investigations on the cold rolling of FCC metals indicated that deformation texture of FCC metals with medium to high SFE is copper-type texture, whereas for FCC metals with low SFE, it is brass-type texture [8-10].
Up to now, for cold drawn deformation, the investigations [10-12] mainly focus on the Ag wires with low SFE (16 mJ/m2 [13]) and copper wires with medium SFE (45 mJ/m2 [13]). The study on cold drawn Ag wires shows that abundant of deformation twins form at low strains [10]. The volume fraction of complex texture component decreases, and <111> and <100> texture components paralleled to the axis direction of wires increase with strain increasing. However, when the strain is higher than 0.58, the variation in the volume fraction of each texture component is not evident with strain increasing and the volume fractions of complex, <111> and <100> texture components are about 40%, 35% and 25%, respectively. For drawn copper wires with medium SFE, the predominant deformation mechanism is dislocation slip [11,12]. <100> and <111> are stable orientations during cold drawn process, at high strains, the volume fractions of <100> and <111> are close to 60% and 40%, respectively.
In the present work, the microstructure and texture of pure Al wires drawn at room temperature (RT) and cryogenic temperature (CT) are characterized based on the following reasons. Firstly, although the microstructure and texture of drawn FCC metals with low and medium SFE have been widely investigated, little works [14-16] on microstructure evolution of pure FCC metals with high SFE can be found, especially on cold dawn deformation [15]. Al is a typical FCC metal with high SFE (166 mJ/m2 [13]). Therefore, the microstructure and texture of drawn Al wires can reveal the effect of SFE on microstructure and texture of drawn FCC metals with high SFE. Secondly, the decrease in deformation temperature can lead to the decrease in the SFE [17,18]. Thus, the microstructural analysis of CT-drawn Al wires can further reveal temperature dependence of deformation behavior.
2 Experimental
The experiments were conducted on pure aluminum (99.98%) polycrystalline wires produced by forging, with a diameter of 8 mm. For microstructure homogenization, the Al wires were annealed for 60 min at 300 ��C followed by immediate water quenching. Cold drawn process was conducted at RT and CT (the specimens were soaked in liquid nitrogen), respectively. The Al samples were drawn up to a large strain of 4.12. The strains are defined by ��=2ln(d0/d), where d0 and d denote the diameter of original (8 mm) and drawn Al wires, respectively.
The samples for electron backscattering diffraction (EBSD) analysis were polished mechanically and then electro-polished in a solution of ethanol and perchloric acid (11:1) at 30 V and -25 ��C for 2 min. EBSD analysis was performed on a FEI field emission gun scanning electron microscope at 20 kV with a working distance of 18 mm and 70�� tilt angle using an Oxford Instruments HKL Nordlys F+ camera with HKL fast acquisition software. For textural measurements, a large area from the center to the surface of samples was investigated using step sizes between 0.3 and 2 ��m. The fraction of successfully indexed orientation was higher than 65% and, in most cases, higher than 75%. For the microstructure determination, step sizes between 0.04 and 0.1 ��m were used. For all maps used for microstructural imaging, the fraction of successfully indexed orientation was higher than 75% and, in most cases, higher than 85%. Non-indexed data points were repaired by HKL Channel 5 software. The samples for TEM were electro-polished using the same solution as EBSD, and TEM analysis was carried out on a JEM 2010 with an acceleration voltage of 200 kV.
3 Results and discussion
3.1 Grain macroscopic subdivision
Figure 1 shows the EBSD orientation maps of RT-drawn Al samples. It can be seen that the grains are equiaxed in the annealed Al sample and the average grain size is about 100 ��m. The results in Figs. 1(b)-(d) show that grains are elongated along the drawn direction with strain increasing. Meanwhile, the grain subdivision appears in some grains. When strain is higher than 1.96, almost all original grain boundaries are parallel to cold drawn direction and fiber microstructure forms (Figs. 1(e)-(h)).
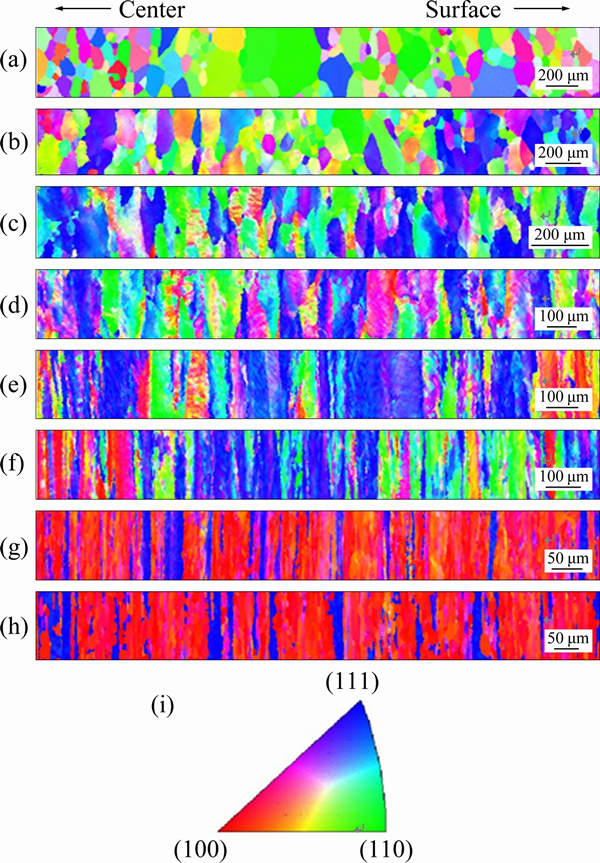
Fig. 1 Drawn direction EBSD orientation maps of RT-drawn Al at strains of 0 (a), 0.28 (b), 0.58 (c), 0.94 (d), 1.39 (e), 1.96 (f), 2.77 (g) and 4.12 (h)
Figure 2 shows the EBSD orientation maps of CT-drawn Al samples with strains higher than 1.39. Because the decrease of ductility leads to the fracture of wires during CT deformation, the EBSD orientation map of CT-drawn Al samples at strain of 4.12 is not given in Fig. 2. The results in Figs. 1 and 2 show that the microstructure evolution in the CT-drawn wires is analogous to the RT-drawn samples. However, the decrease of deformation temperature can accelerate macro-subdivision. Compared to the RT-drawn wires, CT-drawn Al samples have a smaller space of deformation bands and less critical strain of the formation of fiber microstructure.
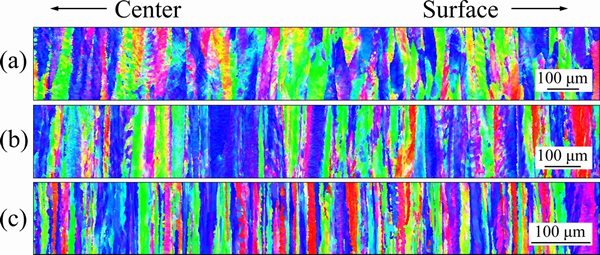
Fig. 2 Drawn direction EBSD orientation maps of CT-drawn Al at strains of 1.39 (a), 1.96 (b) and 2.77 (c)
3.2 Microstructure
The main deformation mechanisms of FCC metals are slip and twinning, and SFE significantly affects deformation mechanism operated in the deformed metals. For FCC metals with medium to high SFE, slip is the predominated deformation mechanism and the deformation leads to the formation of dislocation boundaries including geometrically necessary boundaries (GNBs) and incidental dislocation boundaries (IDBs) [19]. GNBs separate the crystallites that formed by different selection of slip system or different strains. IDBs form by the trapping of glide dislocations. For FCC metals with low SFE [10,13], both mechanisms of twinning and slip are present during deformation process.
The previous results [17,18] indicated that the decrease of deformation temperature leads to the decrease in SFE. Slip is the predominated deformation mechanism in the copper deformed at RT, but a large number of twins appear under CT deformation [5,20]. The variation of deformation mechanism caused by the decrease of temperature is due to the fact that the SFE of Cu is near the critical SFE of the change of deformation mechanisms [13]. The SFE of Al is very high. Therefore, twinning in CT-drawn Al is hardly observed (Figs. (3-5)), which indicates that the decrease in temperature cannot lead to the variation of deformation mechanism of drawn Al wires.
Figures 3(a) and (b) show that at low strains, abundant of dislocation boundaries including IDBs (marked by black arrows) and GNBs form, which is similar to the results of drawn copper wires [21]. At the strain of 0.94, the GNBs parallel to drawn direction appear (white dotted lines in Fig. 3(c)) and the boundary space gradually decreases with the strain increasing (Fig. 3(c) and Fig. 4). It is interesting to find out that equiaxed sub-grains occur in the drawn wires at the strain of 4.12 (Fig. 4(c)), which should be attributed to recrystallization caused by the imposed high strain and friction heat between the wires and drawn die during drawn process.
Figure 5 shows the orientation maps of CT-drawn Al samples. Figures 6(a) and (b) show the misorientation angle distribution along the lines indicated ��AB�� in Fig. 4(a) and ��CD�� in Fig. 5(b), respectively. Compared to RT deformation, the microstructure of CT-drawn Al is finer (Figs. 4 and 5). For example, the average space of boundaries in RT-drawn and CT-drawn Al at strain of 1.96 is about 3.7 ��m and 2.6 ��m (Fig. 6), respectively.
3.3 Misorientation angle
Figures 7 and 8 show the misorientation angle distribution of Al wires drawn at RT and CT, respectively. During misorientation angle analysis process, the tolerance angle is higher than 2��. Figure 9 shows the fraction of low angle boundaries (LABs) and high angle boundaries (HABs) for the samples drawn at RT and CT, where the boundaries with a misorientation angle of 2��-15�� and exceeding 15�� are defined as LABs and HABs, respectively. The fraction of HABs is calculated as [15]:
 (1)
(1)
where VHABs is the percentage of HABs, NHABs is the sum of the frequency with the misorientation angle exceeding 15��, and NLABs is the sum of the frequency with misorientation angle less than 15��.
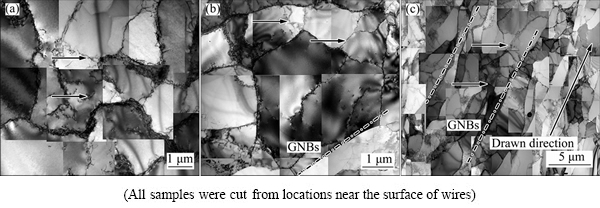
Fig. 3 TEM images of longitudinal section of RT-drawn Al wires at strains of 0.28 (a), 0.58 (b) and 0.94 (c)
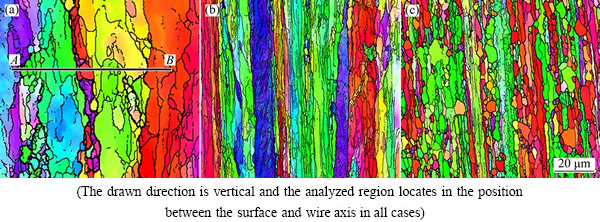
Fig. 4 Drawn direction EBSD (inverse pole figure) maps taken on longitudinal plane of RT-drawn Al wires at strains of 1.96 (a), 2.77 (b) and 4.12 (c)

Fig. 5 Drawn direction EBSD (inverse pole figure) maps taken on longitudinal plane of CT-drawn Al wires at strains of 1.39 (a), 1.96 (b) and 2.77 (c)
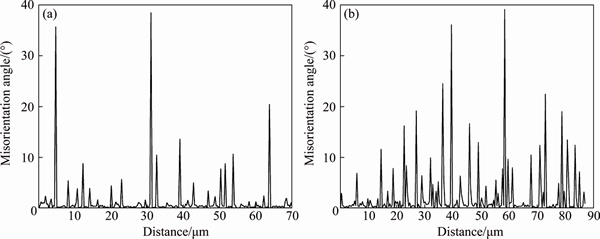
Fig. 6 Misorientation angle distribution along lines indicated ��AB�� (a) in Fig. 4(a) and ��CD�� (b) in Fig. 5(b)

Fig. 7 Misorientation angle distribution of RT-drawn Al at strains of 0 (a), 0.28 (b), 0.58 (c), 0.94 (d), 1.39 (e), 1.96 (f), 2.77 (g) and 4.12 (h)
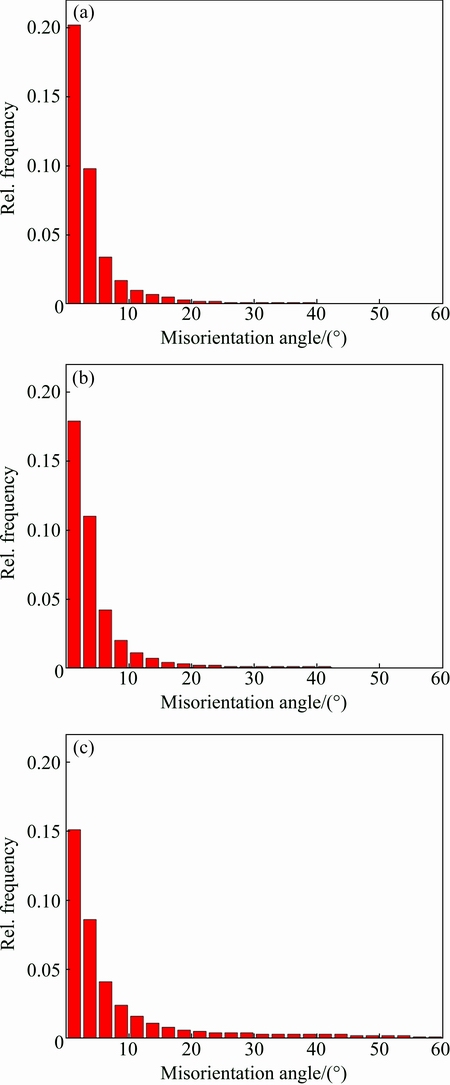
Fig. 8 Misorientation angle distribution of CT-drawn Al at strains of 1.39 (a), 1.96 (b) and 2.77 (c)
From Fig. 7(a) and Fig. 9, it can be found that most of the original grain boundaries are HABs in annealed specimen. At strain less than 0.94, the frequency of LABs increases, and the frequency of HABs decreases with strain increasing (Figs. 7(b) and (c) and Fig. 9). This phenomenon results from the appearance of a large number of LABs caused by the deformation. When the strains are higher than 0.94, the frequency of LABs decreases, but the frequency of HABs increases with strain increasing (Figs. 7(e)-(h) and Fig. 9). This suggests that the number of LABs transforming into HABs is more than that of the newly formed LABs. The results in Figs. 8 and 9 suggest that the frequency of LABs in CT-drawn wires is higher than that of RT-drawn wires at the same strains. Usually, the decrease in deformation temperature suppresses the cross slipping and climbing. This leads to the fact that the grain subdivision is enhanced and the frequency of HABs increases at high strain. However, at high strain, the HABs frequency in RT-drawn wires is higher than that in CT-drawn wires, which further demonstrates that recrystallization should be an important way for the formation of HABs in the RT-drawn wires.

Fig. 9 Fraction of LABs (a) and HABs (b) in RT-drawn and CT-drawn Al
3.4 Texture
Figure 10 shows the volume fraction of different texture components as a function of strain for the Al wires drawn at RT and CT. Complex fiber texture in Fig. 10 contains all fiber texture components except for <100> and <111> parallel to the drawn direction. During calculating the volume fraction of fiber texture component, a tolerance angle of 20�� was used. From Fig. 10(a), it can be found that the complex texture component gradually transforms into <111> and <100>, and its volume fraction decreases with the strain increasing. This is due to the fact that <100> and <111> parallel to the drawn direction are stable orientations in the drawn FCC metals and alloys [10,12].
There is a difference in the volume fraction evolution of <111> and <100> texture components for RT-drawn Al wires. The volume fraction of <100> texture component increases with the strains increasing, especially at strain higher than 1.39. However, the volume fraction of <111> texture component decreases with the strain increasing at the strain higher than 1.39 while increases at the strain lower than 1.39. The results in Fig. 10(b) suggest that the volume fraction of <111> is much higher than that of <100> in CT-drawn Al wires at the strains of 1.39-2.77. The analysis of microstructure (Figs. 4-5) and misorientation anlge distribution (Figs. 7-9) shows that recrystallization occurs in RT-drawn Al wires at high strains, however, the recrystallization cannot be observed in CT-drawn Al wires. Thus, the recrystallization is an important way of <100> texture formation in RT-drawn Al wires.
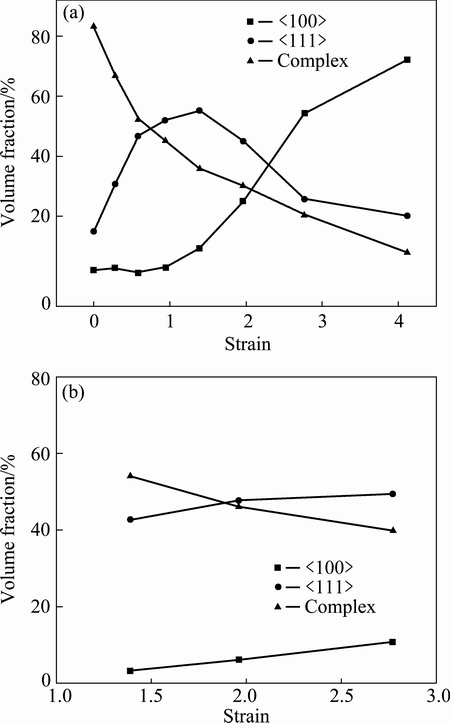
Fig. 10 Volume fraction of texture component in RT-drawn (a) and CT-drawn (b) Al wires
It is known that the SFE has a significant influence on the texture evolution of FCC metals. The previous investigations [10,12] on cold drawn Ag and Cu show that texture component volume fraction does not change as strain increases when the strain is higher than a critical strain. The critical strain in drawn Ag and Cu is 0.58 and 0.94 [10,12], respectively. Compared with Cu and Ag, the critical strain in cold drawn Al is not observed in this work. The volume fraction of <100> texture component increases with the strain increasing, and there is an increasing trend even at strain of 4.12 (Fig. 10(a)). Therefore, it can be concluded that the critical strain, at which the volume fraction of texture component does not change with strain increasing, increases as the SFE increases in the FCC metals.
4 Conclusions
1) The grains are elongated along drawn direction during deformation process. At strain higher than 1.96, most of grain boundaries are parallel to cold drawn direction. The decrease in deformation temperature leads to microstructure becoming finer in the CT-drawn Al wires.
2) IDBs and GNBs form in RT-drawn Al wires at low strains. The GNBs parallel to drawn direction appear at strain of 0.94, and the boundaries space decreases with the strain increasing.
3) At strain less than 0.94, the LABs frequency of RT-drawn Al wires increases and the HABs frequency decreases with strain increasing. When the strain is higher than 0.94, the LABs frequency decreases but the frequency of HABs increases with strain increasing. The LABs frequency of CT-drawn wires is higher than that of RT-drawn wires.
4) For RT-drawn Al wires, the volume fraction of complex component decreases with strain increasing. <111> is stable texture at low strain but <100> becomes stable texture at high strain. The decrease in temperature can enhance the stability of <111> texture.
References
[1] HUANG I T, HUNG F Y, LUI T S,CHEN L H, HSUEH H W. A study on the tensile fracture mechanism of 15 ��m copper wire after EFO process [J]. Microelectronics Reliability, 2011, 51: 25-29.
[2] KHALEGHI F, KHALIL-ALLAFI J, ABBASI-CHIANEH V, NOORI S. Effect of short-time annealing treatment on the superelastic behavior of cold drawn Ni-rich NiTi shape memory wires [J]. Journal of Alloys and Compounds, 2013, 554: 32-38.
[3] KIM K S, SONG J Y, CHUNG E K, PARK J K, HONG S H. Relationship between mechanical properties and microstructure of ultra-fine gold bonding wires [J]. Mechanics of Materials, 2006, 38: 119-127.
[4] ZHANG X H, TANG B, ZHANG X L, KOU H C, LI J S, ZHOU L. Microstructure and texture of commercially pure titanium in cold deep drawing [J]. Transactions of Nonferrous Metals Society of China, 2012, 22: 496-502.
[5] KAUFFMANN A, FREUDENBERGER J, GEISSLER D, YIN S, SCHILLINGER W, SUBRAMANYA-SARMA V, BAHMANPOUR H, SCATTERGOOD.R. Severe deformation twinning in pure copper by cryogenic wire drawing [J]. Acta Materialia, 2011, 59: 7816-7823.
[6] BAHMANPOUR H, KAUFFMANN A, KHOSHKHOO M S, YOURSSEF K M, MULA S. Effect of stacking fault energy on deformation behavior of cryo-rolled copper and copper alloys [J]. Materials Science and Engineering A, 2011, 529: 230-236.
[7] PIERCE D T, JIMENEZ J A, BENTLEY J, RAABE D, WITTING J E. The influence of stacking fault energy on the microstructural and strain-hardening evolution of Fe-Mn-Al-Si steels during tensile deformation [J]. Acta Materialia, 2015, 100: 178-190.
[8] PAUL H, MORAWIEC A, PIATKOWSKI A, BOUZY E, FUNDENBERGER J J. Brass-type shear bands and their influence on texture formation [J]. Metallurgical and Materials Transactions A, 35: 3775-3786.
[9] LEFFERS T, RAY R K. The brass-type texture and its deviation from the copper-type texture [J]. Progress in Materials Science, 2009, 54: 351-396.
[10] MA X G, CHEN J, CHEN Z, YAN W. Evolution of microstructure and texture of cold-drawn polycrystalline Ag with low stacking fault energy [J]. Science China: Technological Sciences, 2015, 58: 1146-1153.
[11] GONG Y L, WEN C E, WU X X, REN S Y, CHENG L P, ZHU X K. The influence of strain rate, deformation temperature and stacking fault energy on the mechanical properties of Cu alloys [J]. Materials Science and Engineering A, 2013, 583: 199-204.
[12] CHEN J, MA X G, YAN W, XIA F, FAN X H. Effect of transverse grain boundary on microstructure, texture and mechanical properties of drawn copper wires [J]. Journal of Materials Science & Technology, 2014, 30: 184-191.
[13] GUBICZA J, CHINH N Q, LABAR J L, HEGEDUS Z, XU C, LANGDON T G. Microstructure and yield strength of severely deformed silver [J]. Scripta Materialia, 2008, 58: 775-778.
[14] ZHU Q F, LI L, BAN C Y, ZHAO Z H, ZUO Y B, CUI J Z. Structure uniformity and limits of grain refinement of high purity aluminum during multi-directional forging process at room temperature [J]. Transactions of Nonferrous Metals Society of China, 2014, 24: 1301-1306.
[15] HOU J P, WANG Q, YANG H J, WU X M, LI C H, LI X W, ZHANG Z F. Microstructure evolution and strengthening mechanisms of cold-drawn commercially pure aluminum wire [J]. Materials Science and Engineering A, 2015, 639: 103-106.
[16] TANG Z B, SUO T, ZHANG B S, LI Y L, ZHAO F, FAN X L. Uniaxial compressive behavior of equal channel angular pressing Al at wide temperature and strain rate range [J]. Transactions of Nonferrous Metals Society of China, 2014, 24: 2447-2452.
[17] MO Y K, ZHANG Z H, FU H D, PAN H J, XIE J X. Effects of deformation temperature on the microstructure, ordering and mechanical properties of Fe-6.5wt% Si alloy with columnar grains [J]. Materials Science and Engineering A, 2014, 594: 111-117.
[18] CHRISTIAN J W, MAHAJAN S. Deformation twinning [J]. Progress in Materials Science, 1995, 39: 1-157.
[19] HUGHES D A, HANSEN N. High angle boundaries formed by grain subdivision mechanisms [J]. Acta Materialia, 1997, 45: 3871-3886.
[20] KAUFFMANN A, FREUDENBERGER J, KLAU H, SCHULTZ L. Properties of cryo-drawn copper with severely twinned microstructure [J]. Materials Science and Engineering A, 2013, 588: 132-141.
[21] CHEN J, YAN W, DING R G, FAN X H. Dislocation boundaries in drawn single crystal copper wires produced by Ohno continuous casting [J]. Journal of Materials Science, 2008, 44: 1909-1917.
������߲�����֯��֯���ݱ���¶������
������1���� ��2���� ��2���� ��2���� �1���� ��2
1. ������ҵ��ѧ ����ѧԺ ���̹����ص�ʵ���ң����� 710072��
2. ������ҵ��ѧ �����뻯��ѧԺ������ 710021
ժ Ҫ������TEM��EBSD�о��������ͱ����¶ȶ�������߲ĵ�����֯����ά֯���ݱ��Ӱ�졣����������ڵ�Ӧ�����£�����Ӧ���������ӣ��ͽǶȽ����������Ӷ��߽ǶȽ����������١��ڸ�Ӧ�����£����־����λ����������η���ƽ�С������ڸ�Ӧ�����£�����Ӧ���������ͽǶȽ����������ٶ��߽ǶȽ����������ӡ������α��¶Ȼᵼ������֯ϸ�����ͽǶȽ����������ӡ�֯����������������Ӧ������������֯����ֵ�����������ͣ��ڸ�Ӧ�������γ�<111>��<100>���֯�����ڵ�Ӧ���£�<111>֯����ֱȽ��ȶ������ڸ�Ӧ���£�<100>֯����������ȶ��������α��¶�ʹ<111>֯������ڸ�Ӧ���µ��ȶ�����ǿ��
�ؼ��ʣ����߲ģ�������α��Σ�λ�����棻��ά֯����ʧ��Ƿֲ�
(Edited by Sai-qian YUAN)
Foundation item: Projects (51471123, 51171135) supported by the National Natural Science Foundation of China; Projects (2012K07-08, 2013KJXX-61) supported by the Natural Science Foundation of Shaanxi Province, China; Project (2013JC14) supported by the Industrialization Program of Shaanxi Province, China
Corresponding author: Jian CHEN; Tel: +86-29-86173324; E-mail: chenjian@xatu.edu.cn
DOI: 10.1016/S1003-6326(17)60087-6
Abstract: The effect of strain and drawing temperature on the evolution of microstructure and fiber textures of aluminum wires drawn at room temperature and cryogenic temperature was investigated by TEM and EBSD observations. The results show that low angle boundaries frequency increases and high angle boundaries frequency decreases with strain increasing when the strain is low. At high strain, most of grain and dislocation boundaries are parallel to the drawn direction and low angle boundaries frequency decreases and high angle boundaries frequency increases with strain increasing. The decrease of deformation temperature leads to microstructure finer and low angle boundaries frequency increasing. Texture analysis indicates that volume fraction of complex texture component decreases with strain increasing and a mixture of <111> and <100> fiber texture forms at high strain. <111> is stable at low strains but <100> becomes stable at high strain. The decrease of temperature can enhance the stability of <111> orientation at high strain.
