

Linear regression analysis of oxygen ionic conductivity in co-doped electrolyte
XIE Guang-yuan(л��Զ)1, LI Jian(�� ��)2, PU Jian(�� ��)2, GUO Mi(�� ��)1
1. School of Materials and Metallurgy, Wuhan University of Science and Technology, Wuhan 430081, China;
2. State Key Laboratory of Plastic Forming and Die and Mould Technology,
Huazhong University of Science and Technology, Wuhan 430074, China
Received 10 April 2006; accepted 25 April 2006
Abstract:
A mathematical model for the estimation of oxygen-ion conductivity of doped ZrO2 and CeO2 electrolytes was established based on the assumptions that the electronic conduction and defect association can be neglected. A linear regression method was employed to determine the parameters in the model. This model was confirmed by the published conductivity data of the doped ZrO2 and CeO2 electrolytes. In addition, a series of compositions in Ce0.8Gd0.2-xMxO1.9-�� system (M is the co-dopant) was prepared, their high temperature conductivity were measured. The model was further validated by the measured conductivity data.
Key words:
ZrO2; CeO2; doped electrolyte; oxygen-ion conductivity; linear regression;
1 Introduction
Gadolinium (Gd) is the most common dopant used in doped CeO2. In order to further enhance the oxygen-ion conductivity of CeO2, other dopants and co-dopants were extensively examined [1-3]. A maximum oxygen-ion conductivity was obtained from Ce0.8Gd0.1Sm0.1O1.9-�� sintered at 1 450 ?C, i.e. ��i800 ��= 7 S?m-1 [1]. However, no well established theories can explain the effect of the co-dopants on increasing the ionic conductivity so far. The purpose of this paper is to present a mathematical model between the ionic conductivity and co-dopant oxides compositions, and experiments were also conducted for the verification of the model.
2 Theoretic modelAccording to the general conductivity mechanism, the total conductivity of matter includes the contributions of every charged species, such as electrons, electron holes and ions, that is[4]
![]() (1)
(1)
where ��i is the mobility of the charged species that can be expressed as [5]
![]() (2)
(2)
Ni and ei are the concentration and the associated charges, respectively, of each charged species, and Q is the diffusion activation energy, v0 is the vibration frequency of the associated charges, �� is the average jumping distance, k is Boltzman��s constant, and T is the absolute temperature. For the doped oxygen-ion electrolytes, within the range of intermediate oxygen pressures, the content of electrons and electron holes can be ignored, the oxide is considered to be a pure ionic conductor, Eqn.(1) mainly includes the contribution of oxygen-ion vacancies caused by each dopant, and ei is the charge associated with the oxygen vacancy ![]() , or
, or ![]() , and therefore, Eqn.(1) becomes
, and therefore, Eqn.(1) becomes
![]() (3)
(3)
Here Ni is the content of ![]() introduced by each dopant. valences of the substituted ion and the dopant ion, rather than the content of each dopant ni, just in proportion to the charge difference of the substituted dopant ion and the matrix ion. According to the electroneutrality condition, Ni can be expressed as ni(q-qi)/2 if co-dopant is entirely dissolved and not considering
introduced by each dopant. valences of the substituted ion and the dopant ion, rather than the content of each dopant ni, just in proportion to the charge difference of the substituted dopant ion and the matrix ion. According to the electroneutrality condition, Ni can be expressed as ni(q-qi)/2 if co-dopant is entirely dissolved and not considering ![]() reaction.
reaction.
Actually, in a doped electrolyte, the oppositely charged oxygen-ion vacancy ![]() and dopant cation
and dopant cation ![]() may be correlated each other to form randomly distributed pairs
may be correlated each other to form randomly distributed pairs ![]() . The concentration of free oxygen-ion vacancy is determined by the association equilibrium [4]:
. The concentration of free oxygen-ion vacancy is determined by the association equilibrium [4]:
![]()
The equilibrium constant of the reaction can be expressed as [11]:
![]()
and
![]()
where K0 is a constant, ?h is the interaction energy, ![]() is the charge associated with
is the charge associated with ![]() , L is the distance between the oxygen-ion vacancy and the dopant cation, �� and ��0 are the static dielectric constants in atmosphere and vacuum, respectively.
, L is the distance between the oxygen-ion vacancy and the dopant cation, �� and ��0 are the static dielectric constants in atmosphere and vacuum, respectively.
According to the electroneutrality condition, ![]() . It can be seen that the concentration of the defect association increases with that of the dopant, while the concentration of free oxygen vacancies decreases. However, the optimized dopant content cannot be determined only by the association equilibrium, since the defects may aggregate into clusters that become ordered or form two- or three-dimensional defects [4]. Besides, the mobility of oxygen vacancies is greatly affected by the dopant content, i.e. diffusion barrier becomes higher due to lattice distortion caused by dopants. The lattice distortion is related to the radius difference between the substituted ion and the dopant, and the distortion energy Edist can be written as [5]
. It can be seen that the concentration of the defect association increases with that of the dopant, while the concentration of free oxygen vacancies decreases. However, the optimized dopant content cannot be determined only by the association equilibrium, since the defects may aggregate into clusters that become ordered or form two- or three-dimensional defects [4]. Besides, the mobility of oxygen vacancies is greatly affected by the dopant content, i.e. diffusion barrier becomes higher due to lattice distortion caused by dopants. The lattice distortion is related to the radius difference between the substituted ion and the dopant, and the distortion energy Edist can be written as [5]
![]()
and
![]()
where G is the shear modulus, r and ri are the radius of the substituted ion and the dopant ion, respectively. In a multi-doped system, the total distortion energy ET is the sum of the distortion energy contributed by each dopant:
![]()
When the defect association is ignored, the lattice distortion caused by each dopant is the main effect of dopant elements on the conductivity. The distortion energy, equivalent to the activation energy Q, is the barrier to the charge transfer. Substituting ET for Q and ni(q-qi)/2 for Ni, Eqn.(3) can be rewritten as
![]()
Multiple dopants apply significant and complicated impact on the oxygen-ion conductivity, thereby, it is difficult to construct an accurate mathematical relationship between the co-dopant and oxygen-ion conductivity, and however, a linear regression can be established with assumptions and simplifications. Taking logarithm of the equation, it becomes
![]() (4)
(4)
where ![]() and
and  . They are constants independent of dopant variation. Let
![]()
![]() ,
, ![]() ,
, ![]()
Eqn.(4) becomes a linear equation:
![]() (5)
(5)
Calculating X and Y with experimental data, the coefficients a and b can be determined by linear regression [6-10], and in turn, a relationship between the composition and the conductivity is established.
3 Analysis of published conductivity data
The published oxygen-ion conductivities and compositions of rare earth oxide doped ZrO2 and CeO2[4] are listed in Tables 1 and 2, respectively.
For the doped ZrO2, a and b are determined as 5.27 and -316.20, a linear relationship of Y=5.27-316.20X is obtained with a correlation coefficient of 0.98. Fig.1 shows the graphic result of the linear regression. A
Table 1 Oxygen-ion conductivity of rare earth doped ZrO2
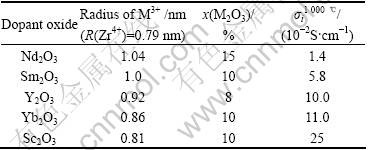
Table 2 Oxygen-ion conductivity of oxide doped CeO2
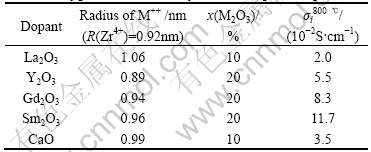
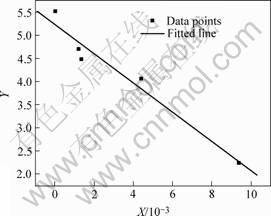
Fig.1 Linear regression result of doped ZrO2
relationship between oxygen-ion conductivity and the dopant for the rear earth doped ZrO2 is thus established as
![]()
For the doped CeO2, this relationship is changed to
![]()
and the linear regression result is shown in Fig.2 with a linear correlation coefficient of 0.955 6.
The above analysis suggests the existence of the linear relationship as Eqn.(5), and the oxygen-ion conductivity increases with increasing (ri-r)2 and (q-qi).
4 Model validation
In the doped CeO2 system, co-doped Ce0.8Gd0.2-x- MxO1.9-�� has been considered to have the optimal dopant
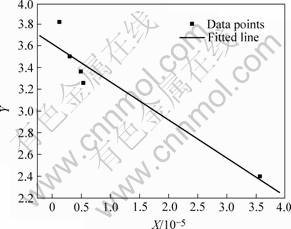
Fig.2 Linear regression result of doped CeO2
content; most of the studies have adopted this atomic ratio of Ce to the dopants (Gd + M). To further validate Eqn.(4), a series of doped Ce0.8Gd0.2-xMxO1.9-�� (M3+=Gd3+, Y3+, Sm3+, La3+, Nd3+) materials were prepared and their high temperature conductivities were measured. The powder mixtures with constituent oxides in proportion were ball-milled and dry-pressed into round disc shape, followed by sintering at 1 500 ?C. The sintered discs were printed with Pt slurry on both top and bottom surfaces; a Pt mesh spark welded with a Pt wire was attached to each of the surfaces. The resistance was measured in a tubular furnace at 800 ?C in air. The conductivity was calculated from the measured resistance accordingly.
The conductivity data obtained for each material prepared are tabulated in Table 3. The measured conductivity by this method can be regarded as ionic conductivity, since the electronic conductivity can be ignored under the oxygen partial pressure in air. It is realized that the sintered density of the samples is lower than that of the theoretic value, which may introduce deviations from the accurate conductivities. However, the accuracy of thus measured conductivity is expected to be adequate to reflect the effect of the dopant on the conductivity.
The variables X and Y are calculated according to Eqns.(4) and (5) using the measured data in Table 3. Then the linearly fitted result is illustrated in Fig.3. A linear relationship is obtained as Y=3.97-321X with a correlation coefficient of 0.93, suggesting an acceptable linear correlation. Thus, ![]()
![]() is established between the oxygen-ion conductivity and the dopant for the co-doped Ce0.8Gd0.2-xMxO1.9-�� system.
is established between the oxygen-ion conductivity and the dopant for the co-doped Ce0.8Gd0.2-xMxO1.9-�� system.
Table 3 Ce0.8Gd0.2-xMxO1.9-�� compositions and measured conductivities (10-2 S?cm-1)

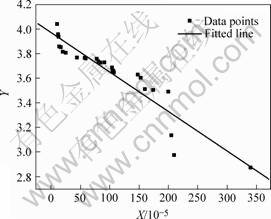
Fig.3 Linear regression result of co-doped Ce0.8Gd0.2-xMxO1.9-��
5 Conclusions
Neglecting the electronic conductivity and defect association, a relationship between the oxygen-ion conductivity and dopant properties for doped ZrO2 and CeO2 is established based on the linear regression. The conductivity increases with decrease of the radius difference between the substituted ion and the dopant, and is also strongly affected by the charges associated with the substituted dopant ions. It is acceptable to estimate the oxygen-ion conductivity of doped ZrO2 and CeO2 by using this model.
References
[1] LIANG G C, LIU W X, CHEN Y R, et al. Properties of ceria-based electrolyte stabilized with Sm, Gd[J]. J Chinese Ceramic Society, 2000, 28(1): 44-46. (in chinese)
[2] KLEINLOGEL C, GAUCKLER L J. Sintering and properties of nanosized ceria solid solutions [J]. Solid State Ionics, 2000, 135: 567-573.
[3] HORMES J, HARTMANOVA M. X-ray absorption near edge structure (XANES) measurements of ceria-based solid electrolytes [J]. Solid State Ionics, 2000, 137: 945-954.
[4] MINH N Q, TAKANASHI T. Science and Technology of Ceramic Fuel Cells[M]. New York: Elsevier, 1995.
[5] XIONG Jia-jiong. Materials Design [M]. Tianjing: Tianjing University Press, 2000. (in Chinese)
[6] LIU Y J, ZHANG J M. Parameter estimation of cutting tool temperature nonlinear model using PSO algorithm [J]. Journal of Zhejiang University (Sciences Edition), 2005(12): 1026-1029.
[7] CHEN L, ZHANG L X. S-estimators in the linear regression model with dependent error terms [J]. Journal of Zhejiang University(Sciences Edition), 2005(5): 506-512.
[8] YU W H. Study on calibration models of HORIBAs gaseous element analyzer [J]. Wisco Technology, 2005, 4: 21-23. (in Chinese)
[9] ZHANG X J, HU B B. Nonlinear finite element analysis of deflection of reinforced concrete two-way slab of frame construction [J]. Journal of Wuhan University of Technology, 2005, 3: 63-65.
[10] FENG J, CHEN W Q. Efect of concasting technology parameters on center carbon segregation of high carbon steel billet [J]. Special Steel, 2005, 4: 33-35. (in Chinese)
[11] CHIANG Y M, BIRNIE D P, Kingery W D. Physical Ceramics: Principle for Ceramic Science and Engineering [M]. New York: John Wiley & Sons Inc, 1996.
Foundation item: Project(2004ABA078) supported by the Natural Science Foundation of Hubei Province
Corresponding author: LI Jian; Tel: +86-27-87557694; E-mail: plumarrow@126.com
