

J. Cent. South Univ. (2018) 25: 406-417
DOI: https://doi.org/10.1007/s11771-018-3746-3

Deformation prediction and analysis of underground mining during stacking of dry gangue in open-pit based on response surface methodology
QIU Xian-yang(������), CHEN Jia-yao(�¼�ҫ), SHI Xiu-zhi(ʷ��־),ZHANG Shu(����), ZHOU Jian(�ܽ�), CHEN Xin(����)
School of Resources and Safety Engineering, Central South University, Changsha 410083, China
 Central South University Press and Springer-Verlag GmbH Germany, part of Springer Nature 2018
Abstract:
Deformation prediction and the analysis of underground goaf are important to the safe and efficient recovery of residual ore when shifting from open-pit mining to underground mining. To address the comprehensive problem of stability in the double mined-out area of the Tong-Lv-Shan (TLS) mine, which employed the dry stacked gangue technology, this paper applies the function fitting theory and a regression analysis method to screen the sensitive interval of four influencing factors based on single-factor experiments and the numerical simulation software FLAC3D. The influencing factors of the TLS mine consist of the column thickness (d), gob area span (D), boundary pillar thickness (h) and height of tailing gangue (H). The fitting degree between the four factors and the displacement of the gob roof (W) is reasonable because the correlation coefficient (R2) is greater than 0.9701. After establishing 29 groups that satisfy the principles of Box-Behnken design (BBD), the dry gangue tailings process was re-simulated for the selected sensitive interval. Using a combination of an analysis of variance (ANOVA), regression equations and a significance analysis, the prediction results of the response surface methodology (RSM) show that the significant degree for the stability of the mined-out area for the factors satisfies the relationship of h>D>d>H. The importance of the four factors cannot be disregarded in a comparison of the prediction results of the engineering test stope in the TLS mine. By comparing the data of monitoring points and function prediction, the proposed method has shown promising results, and the prediction accuracy of RSM model is acceptable. The relative errors of the two test stopes are 1.67% and 3.85%, respectively, which yield satisfactory reliability and reference values for the mines.
Key words:
Cite this article as:
QIU Xian-yang, CHEN Jia-yao, SHI Xiu-zhi, ZHANG Shu, ZHOU Jian, CHEN Xin. Deformation prediction and analysis of underground mining during stacking of dry gangue in open-pit based on response surface methodology [J]. Journal of Central South University, 2018, 25(2): 406�C417.
DOI:https://dx.doi.org/https://doi.org/10.1007/s11771-018-3746-31 Introduction
The roof stability of goaf is the most rigorous problem experienced when underground mining is shifted from open-pit mining [1, 2]. Goaf is in danger of collapse and destruction when the surrounding environment experiences changes, such as changes in the physical-mechanical parameters of rock mass, fault, open-pit carrying capacity, boundary pillar thickness, column thickness, and gob area span [3-5]. Deformation prediction, which is one of the most fundamental issues of mining, has great significance in the safety of mine production. Thus, reasonable and effective forecasting and evaluation methods for systemic deformation should be established. However, the factors that affect stability are complexity and uncertainty. These factors will become more significant when the mining extends to significant depths, which not only introduce substantial hidden danger to the safety of mine production but also affect the establishment of the system with regard to prediction and evaluation [6-9].
Due to the significance of the influence factors for the safe and economical extraction of underground ores, many valuable results on this topic have been reported by authors in recent decades. These authors have made admirable efforts in the stability analysis of goaf. In this context, traditional semi-quantitative analyses, which includes experience analogies, the K.B. Lu Peinie theory, the thick span ratio method, and the broken arches and loose coefficient theoretical estimation methods, are considered to be poorly systemic and single considerations and do not fully reflect a complex system with uncertainty and nonlinearity [10-12]. With the development of computer science and artificial intelligence, some research methods combined with calculation software have enabled significant progress. For instance, ZHANG [13] presented a realistic failure process analysis (RFPA) model to establish a corresponding relationship between the critical span and the roof safety thickness when the roof collapsed. LI [14] calculated the relationship between the smallest security thickness of a goaf roof and span by adopting a simulation analysis and the synthetic structure mechanics of a girder. ZHAO [15] revealed the double impact of the mined-out area roof and span by proposing strength-reduction methods and the displacement mutation characteristics of monitoring points. WU [16] employed a two-stage fuzzy synthetic judgment model and the inversion of weight to evaluate the stability of the gob area. Although the research approach reviewed in this paper is superior to traditional forms, they cannot solve the analysis problem of a multivariable system. Conversely, the individual analysis of multivariate data is challenging.
The response surface methodology (RSM) is used to appraise the existing relations in a group of controlled investigational factors. RSM is also employed to study the interactions between factors and optimize operating parameters by fitting a response surface to replace the unknown true state surface in a large complex structural system [17-19]. Therefore, to solve the issue of multi- factor and system deformation prediction, this paper lists four factors that influence the stability of complex double goaf in the Tong-lv-shan (TLS) underground mine, which has shifted from open-pit mining. These four factors primarily include column thickness (d), gob area span (D), boundary pillar thickness (h) and height of tailing gangue (H). In addition, a four-variable five-level Box-Behnken design (BBD) model was adopted based on the response surface theory and numerical simulation experiments. By establishing a mathematical prediction model, the objective of this study is to investigate the double mining goaf deformation of residual ore in the TLS underground mine. The model reflects the relationship between the roof displacement (W) and various factors. The prediction model has been applied to the evaluation of the deformation in the underground mining field and obtained successful results.
2 Identification and calculation of impact factors
The TLS open-pit mine has been disused and has formed an exposed area of 2��105 m2. To rationally use the space in the mine, dry stacked gangue technology has been applied since 2007; 50 m has been accumulated. The #1 orebody is primarily detected in the depth range of �C305 to �C185 m, with an average depth of 110 m, thickness of 50 m and dip angle range of 60�� to 80��. The stopes occur in the direction of the layout, and mechanized panel slicing filling mining (MPSFM) is adopted as a method during underground mining, with a level height of 40 m and a deck height of 3 m. The maximum exposed height of gob is 6 m, when two mining schemes and one filling mining scheme are applied in ore extraction
To analyze the stability of a mined-out area in the process of underground mining, a numerical simulation method is used to simulate the deformation of the space [20-22]. By utilizing the connection between a multi-factor system and a multi-level system, a general flow chart of the experimental design is constructed, as shown in Figure 1. Three main steps are taken during forecasting: the first step is to screen a suitable interval using the results of a single-factor numerical design. The second step is to set up a BBD response surface design; thus, we can predict the stability of the comprehensive gob. In this context, BBD is considered to be a reasonable aid to the simulation experiment and an apt choice for developing numerical models, measuring the influence of variables and searching for optimum combinations of variables. The third step is to compare the numerical simulation and experimental results of the actual deformation in the TLS mine and analyze the error.
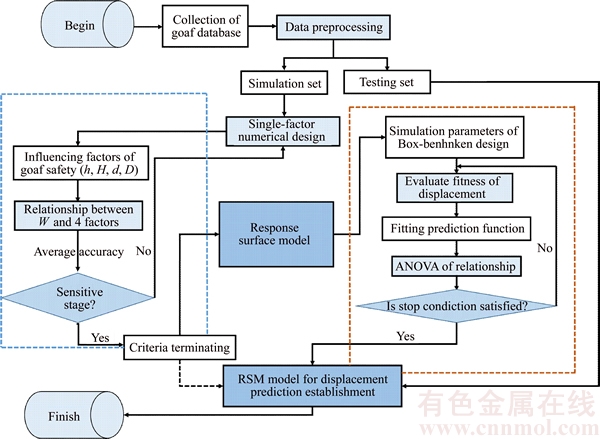
Figure 1 Evaluation procedure of research
2.1 Identification of impact factors
There are two goaf failure features of open-pit mining, which references a theoretical analysis, field observations and the results of previous studies [23-25]: the first feature is the shear failure on the two ends of the gob, which is caused by an oversized gap span and overweight load. The second feature is the roof tensile failure when the received tensile stress is larger than the admissible value. Both features will cause roof collapse and add enormous pressure to the production of the mine. The TLS open-pit cemented filling body of full tailings on the bottom and the backfilled dry stacked gangue are sources of pressure filtration and pre-dehydration. This will reduce the use of industrial water to some extent. The following four main parameters affect the goaf stability in the TLS pit: 1) Height of tailing gangue (H), the scope of its coverage extends from �C185 m to 15 m, and a depth of 150 m contains no remaining backfill. 2) Boundary pillar thickness (h), the value of h has an optimal solution between security and economic recovery. The residual ore will exhibit a significant loss when h is large and will threaten mining safety when h is small. 3) Gob area span (D), two parallel stopes with the same span range along the ore body. D needs to satisfy the rationality of the stope layout because it affects the stability of the space.4) Column thickness (d), a column width of d is required to ensure mining safety because it directly affects the stability and extraction rate.
2.2 Numerical model
A FLAC3D model was established to perform a single-factor numerical analysis of the four factors, as shown in Figure 2. The model contained 21300 nodes, 10520 units and the dimensions 480 m��320 m��20 m. The entire model was restricted with regard to the Z coordinate and Y=0 plane. In the center of each goaf roof, the two monitoring points were used and called 1#, 2#. These points were employed to monitor the roof displacement and the plastic zone. To avoid the random nature of the statistical process during the numerical simulation, impact factors (X) were employed to calculate the error by a unit of a (the value of a in this work is 10%X), namely, using three data simulations of each level of X�Ca, X, and X+a. By averaging the deformation results, the data statistics of the simulation error from each group is given.

Figure 2 FLAC3D model of orebody environment and diagram of goaf excavation
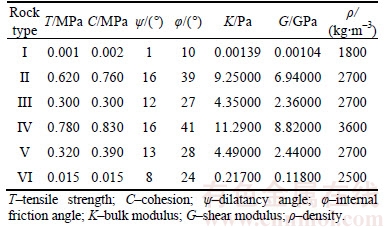
The physical-mechanical parameters of the TLS rock mass, which are shown in Table 1, are based on the laboratory experiments of rock mechanics.
Table 1 Physical-mechanical parameters of rock mass
2.3 Single-factor simulation
The gob deformation for different parameters (H, h, D, d) in the single-factor experiment group is presented in Table 2. The results can be divided into four main points: 1) Change the height of the boundary pillar thickness (initial H=50 m, D=12 m, d=6 m) from 4 m to 40 m by uniformly increasing the height by 3 m, and collect the displacement of each monitoring point (1#, 2#) by the levels h and h��0.3 m; 2) Test the width of the gob span (initial H=50 m, h=16 m, and d=6 m) from 4 m to 28 m by uniformly increasing the width by 2 m, and add the displacement by the level of D and D��0.2 m; 3) Test the width of the column thickness (initial H=50 m, h=16 m, D=12 m) from 2 m to 14 m by uniformly increasing the width by 1 m and count the displacement by the levels d and d��0.1 m; 4) Test the height of the tailing gangue (initial h=16 m, D=12 m, d=6 m) from 50 m to 200 m by uniformly increasing the height by 10 m and count the displacement by the levels H and H��1 m.
3 Results and discussion
3.1 Single-factor simulation results
As demonstrated by the univariate results, the difference between the vertical displacements of two monitoring points (1#, 2#) is almost nonexistent. Thus, the displacement of the points (1#, 2#) can be replaced by their average value. From the analysis of the error bars, the fluctuation in the displacement of 10%X is investigated. Illustrative numerical results are calculated and given in Figure 3.
Figure 3(a) shows that the influence of a single factor on the roof deformation (W) in the gob roof has a negative correlation. The impact process can be divided into three stages: The first stage is the shear failure area (h<7 m), which may be caused by complicated factors, such as external loads. As shown in Figure 4(a) (h=4 m), the goaf roof collapses but the column was not destroyed. The second stage is a sensitive area (10 m
Table 2 Single-factor numerical design

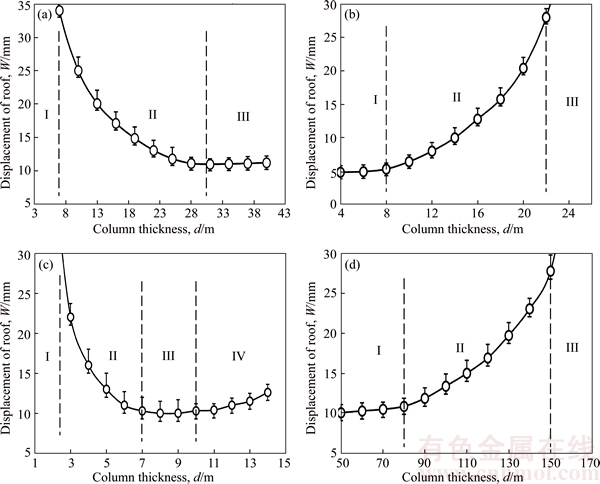
Figure 3 Effect of boundary pillar thickness (a), gob area span (b), column thickness (c), and height of tailing gangue (d) on displacement of monitoring points with method of control variables
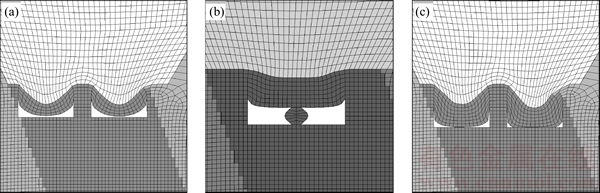
Figure 4 Goaf failure features for different conditions of roof collapse (a), column damage (b), and roof collapse (c)
Figure 3(c) illustrates that W contours satisfy the decreasing curve relationship for different d values. Four stages exist: The first stage is a failure area (d<3 m), in which the column is too narrow to bear due to the large load in the stud. As shown in Fig. 4(b) (d=3 m), the column damage causes roof collapse. The second stage is a sensitive area (3 m
As illustrated in Figure 3(d), the W contours satisfy the nonlinear increasing relation for different H values. Three stages exist: The first stage is a stable area (H<80 m), in which W is nearly unchanged when H varies. The second stage is a sensitive area (80 m
Each of the sensitive areas in Figure 3 will provide data for additional comprehensive studies for the following reasons: First, the gob is not destroyed in these stages and is always a prerequisite for subsequent studies. Second, the economic conditions of sensitive areas are multi- adjustable and unpredictable because a stable area may cause significant loss during mine production.
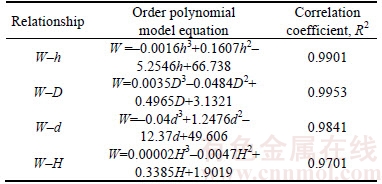
For the study of the nonlinear relationship between W and H, h, D, d, the paper applies (Table 3) a mathematical prediction model and function fitting coefficient by applying MATLAB. The calculation results are reasonable, and the fitting coefficients of W are 0.9901, 0.9953, 0.9841,and 0.9701.
Table 3 Fitting results of single-factor analysis and displacement of monitoring points
3.2 BBD analysis of selected factors and programs
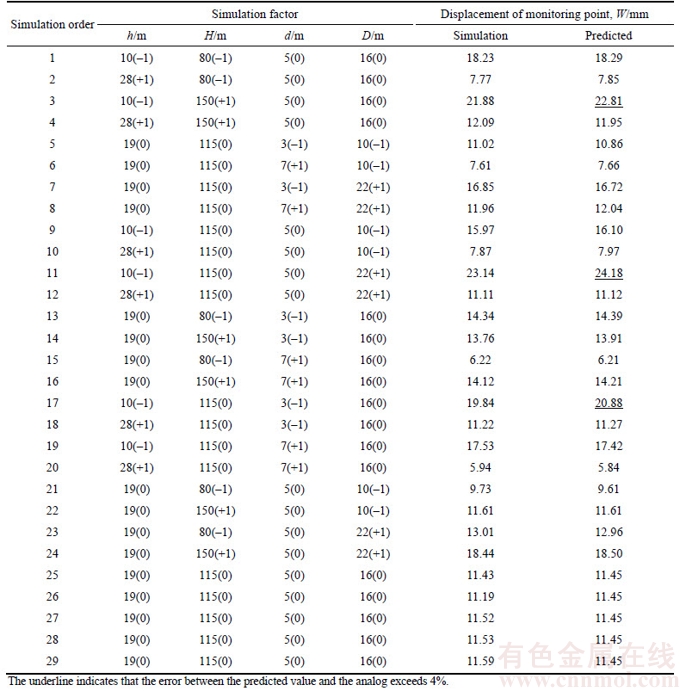
According to the simulation results of the single-factor experiments and BBD principles, this paper selects four significant factors (H, h, D, and d) to conduct comprehensive research of a response surface. By considering the economic benefits, the production costs and the safety of underground space, we can predict the deformation and perform an optimization using comprehensive factors of the sensitive areas (H (80�C150 m); h (10�C28 m); D (10�C22 m); and d (3�C7 m)). Thus, a 4-factor, 5-level BBD model that requires 29 simulations (Table 4) is applied to optimize the displacement parameters. As observed in Table 4, the numbers 1 to 24 correspond to the factorial points, and the numbers 25 to 29 are zero factor points. The average displacements of the monitoring points (1#, 2#) are recorded from FLAC3D simulation, and the predictive values are calculated from the BBD analysis.
As shown in Figure 1, to obtain a reasonable response surface, function calculations are performed according to the design matrix that is generated by the Box-Behnken factorial design. Based on the data obtained from the numerical simulations, which are listed in Table 4, we can obtain the relation among the causal variables using multivariate two-function fitting methods as follows:
For the programming regression equation:


 (1)
(1)
where in Eq. (1), A, B, C, and D represent the program values of H, h, D, and d. However, the formula has limitations because it is not easy to use in many cases, such as substituting the intermediate data into the formula. Equation (2) demonstrates the relationship between the independent variables (X) and the target content (W) in second-order polynomial models:

 (2)
(2)
Table 4 Simulation parameters of Box-Behnken design and displacement of monitoring points
The actual regression equation fitting correlation coefficient R2=0.9875, which is close to 1, indicates that the deformation prediction of goaf has a reasonable fitting effect on the simulation range. This finding implies that only 0.125% of the total variation cannot be explained by the quadratic function.
The predicted values listed in Table 4 comprise feedback from the deformation in different conditions. The calculation formula of the prediction error is shown as follows:
 (3)
(3)
where Wp and Ws are the predicted displacement and actual displacement, respectively; �� is the relative error.
The statistics (Table 4) show that the simulation errors of groups 3, 11, and 17, which are 4.25%, 4.49%, and 4.23%, respectively, and the remaining errors are less than 2%; thus, a favorable reliability is ensured. Due to the large displacement values of the stope roof (21.88 mm, 23.14 mm, 19.84 mm of groups 3, 11, and 17, respectively), the system is in the critical relative failure position and is in danger of collapse, which caused a large error.
The statistical significance of the quadratic models is verified by an ANOVA. The ANOVA results for the quadratic model of the deformation analysis are listed in Table 5. The table contains seven columns: the first column shows the source model, the main effects (A�CD) and the two-way interaction effects of the factors (AB�CD2). The second column lists the sum of squares (SS), which is applied to recording the variability in the data. The third column gives the degree of freedom (df). The fourth column lists the mean square (MS), which is equivalent to the SS divided by df. The fifth column reveals the F-value; the sixth column lists the p-value and the seventh column provides the significance level. Adequate precision calculates (29 runs) the single factors of the deformation, and R2 indicates the coefficient of multiple determination. The correlation coefficient of the quadratic model (R2=0.9994; Adj-R2=0.9989) implies that 99.94% of the variance in the RSM can be illustrated with a quadratic function. A P-value less than 0.0500 indicates that the model is more significant with linear and quadratic model terms, and the model terms are insignificant when the P-value exceeds 0.1000. When A, B, C, D, AC, AD, BC, BD, A2, B2, and D2 are significant, the other terms are insignificant. To obtain a refined response surface model, the statistically insignificant data can be deleted according to the backward elimination method. The F-value can be employed to explain the important degree of influence factors. The greater the F-value is, the more important the role of the factor in the system is. As shown in Table 5, the sensitivity of the four factors, from large to small, can be determined: h>D>d>H. The F-value of the model (1358.92) explains the significance of the regression model. The lower values of pure error represent the reproducibility. The lack of fit is 0.6158, which is more significant than the basic amount of 0.05; the predicted values correspond to the numerical results. The ANOVA of the BBD model can be employed to calculate and optimize any given variable in the interval of the numerical design.
3.3 Comprehensive study of BBD
By selecting any two parameters from H, h, D and d, the three-dimensional response surface (Figure 5) about the factor sensitivity interval can be plotted according to the regression equation. The horizontal plane of Figure 5 shows the correlation of the factors; when the shape resembles an ellipse, the relationship is distinct. Otherwise, the correlation is not distinct when it resembles a circular shape [26].
Table 5 Analysis of variance (ANOVA) for displacement of monitoring points
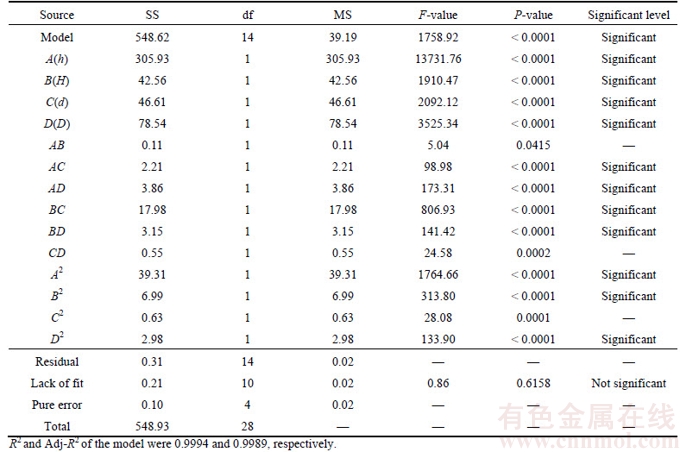

Figure 5 Response surface plots illustrating effect:
As shown in Figure 5(a), the gob displacement (W) proportionally increases when the roof thickness (h) and the height of tailing gangue (H) increase. A zero factor point exists (when H(0)= 115 m, h(0)=19 m, d(0)=5 m, and D(0)=16 m), as shown in Figure 5(a). The change in the displacement rate before and after the zero factor point is substantial; thus, the location of the point can be considered to simultaneously reduce loss and ensure the safety of the roof. The graph curvature indicates that the influence of h is more significant than the influence of H. The negative effects of h and d on W are depicted in Figure 5(b), which reveals that the zero factor point maintains a smaller rate than the latter and the effect of h is more significant than that of d. As shown in Figure 5(c), the impact of h is equivalent to the impact of D, and the zero factor point has the phenomenon of mutation. The effect of H and d on W is shown in Figure 5(d); deformation increases with an increase in H and a decrease in d. Figure 5(e) shows that the curvature of the BBD surface is small. The dependence of the displacement of the roof on D is greater than the dependence of the displacement of the roof on H, and the zero factor point can be regarded as the mutation point. As indicated in Figure 5(f), the three-dimensional response surface that is formed between W and d, D is nearly a plane; thus, no mutation point is observed.
However, obtaining the minimum point from the BBD response surface should not be the only objective in practical applications. Although the minimum displacement is the most intuitive judgment to ensure stope safety, we need to conduct benefit optimization based on security. The selected point should be satisfied with a relatively small displacement value and growth rate. As shown in Table 4, the displacement values of the zero factor points are 11.43, 11.19, 11.52, 11.53, and 11.59 mm, and the increasing rate of the stope roof significantly increased after this point. The results indicate that the single-factors analysis and the BBD method yield promising results with high accuracy, which provides a new method for the prediction of stability problems in complex conditions.
4 Engineering applications
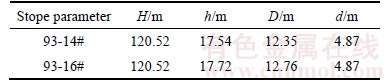
To efficiently mine residual ore by a mechanized panel slicing filling mining method in the south pit of the TLS mine, two parallel stopes, 93-14# and 93-16#, were arranged along the strike (Figure 6). The average height of the stope is 6 m. An additional study of roof stability is essential due the rock fragmentation and developed joints because the numerical model can only simulate the approximate range of the calculations and the actual parameters cannot be accurately reflected. Thus, the ideal deformation analysis results need to be assessed by fitting the mathematical prediction model. Table 6 shows the measured stope structure and the surrounding parameters.
1) By substituting the established mathematical prediction formula model, the predicted displacement can be obtained according to the stope parameters. The displacement values of #93-14 and #93-16 are WP1=11.14 mm and WP2=11.49 mm. The mined-out area of the plastic zone distribution is shown in Figure 6(a), where the distribution of the plastic area in the studs is greater than the distribution of the plastic area on the roof and is substantially greater in 93-16# than 93-14# due to the faults in the east stope. Figure 6(b) reveals the displacement vector of the stope roof. We obtain the simulation deformation of the two stopes, WS1=11.29 mm and WS2=11.35 mm, which differ by 0.15 mm and 0.14 mm compared with WP1 and WP2. The relative errors that are calculated from Eq.(3) are 1.22% and 1.32%, which can be satisfied by the simulation results.
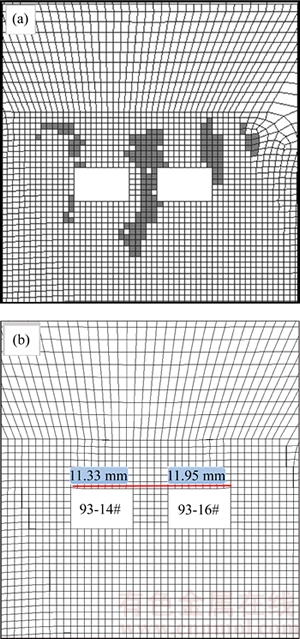
Figure 6 Plastic zone distribution (a) and vertical displacement of simulation stope (b)
Table 6 Parameters of stope and surrounding conditions
2) To further verify the reasonableness of the forecast, two monitoring points were established on the center of the stope roof (93-14# and 93-16#) in the TLS underground mine. After measurement, the displacements of the two points are 11.33 mm and 11.95 mm, and the errors of the two points are 1.67% and 3.85% when compared with the prediction values. The interference from complex geological structures, such as faults, may be a reasonable explanation for the larger errors in 93-16#. The error values remain within an acceptable range, which can be considered an actual prediction. The model obtained from comprehensive simulation, research and analysis can significantly reduce the error in the simulation process. In addition, accidental assessments may be eliminated by multiple simulations in complex rock conditions.
5 Conclusions
1) A four-level, 29-group factorial analysis model was employed to arrange the numerical simulation, and an RSM was applied to statistically analyzing the results. By the combination of single- factor research and numerical simulation, the influence interval of multiple factors, which affect the stability of the mined-out area was obtained. By utilizing a fitting analysis of multiple functions in the single-factor graph, we calculated a reliable curve fitting and correlation coefficient.
2) According to the sensitivity analysis and ANOVA, the sensitivity of the four factors, from large to small, can be determined: boundary pillar thickness (h), gob area span (D), column thickness (d), and height of tailing gangue (H). From a statistical comparison of the P-value and F-value from the BBD results, the role of the four factors is significant; thus, it cannot be ignored in the assessment of the production process.
3) By utilizing a collation process and multiple regression approach that is based on a numerical simulation of RSM data, the correlation function of four factors and the deformation can be calculated. By combining with the parameters of the stope of the TLS mine, actual results can be obtained after substitution and examination. The relative errors of deformation are 1.67% and 3.85%, which have some reference value for mining safety.
4) The prediction model has certain limitations when the changes in the lithology and geological structure are significant. The relative error will increase, especially in complex conditions.
References
[1] MASOUD Z N, RAFAEL J, REZA K. A new open-pit mine slope instability index defined using the improved rock engineering systems approach [J]. International Journal of Rock Mechanics & Mining Sciences. 2013, 61(7): 1�C14.
[2] GOODFELLOW R C, DIMITRAKOPOULOS R. Global optimization of open pit mining complexes with uncertainty [J]. Applied Soft Computing, 2016, 40(4): 292�C304.
[3] NABIOLLAH A, MAJID A, MEHDI R. Integration of sustainable development concepts in open pit mine design [J]. Journal of Cleaner Production, 2015, 108(12): 1037�C1049.
[4] GAO Yu-kun, BAO Na, ZHANG Ying-hua, JIANG Li-ming, HUANG Zhi-an. Research on index system of rock slope safety evaluation for open pit mine [J]. Procedia Engineering, 2011, 26: 1692�C1697.
[5] SHI Xiu-zhi, HUANG Gang-hai, ZHANG Shu, ZHOU Jian. Goaf surrounding rock deformation and failure features using FLAC3D in underground mining shifted from open-pit in complex situation [J]. Journal of Central South University: Science and Technology, 2011, 42(6): 1710�C1718. (in Chinese)
[6] JIAO Y, HUDSON J A. The fully-coupled model for rock engineering systems [J]. International Journal of Rock Mechanics & Mining Sciences, 1995, 32(5): 491�C512.
[7] SHISHVAN M S, SATTARVAND J. Long term production planning of open pit mines by ant colony optimization [J]. European Journal of Operational Research, 2015, 240(2): 825�C836.
[8] ZHOU Jian, LI Xi-bing, MITRI H S. Classification of rockburst in underground projects: Comparison of ten supervised learning methods [J]. Journal of Computing in Civil Engineering, 2016, 6: 04016003.
[9] ZHOU Jian, LI Xi-bing, MITRI H S. Comparative performance of six supervised learning methods for the development of models of hard rock pillar stability prediction [J]. Natural Hazards, 2015, 79(1): 291�C316.
[10] CERYAN N, CERYAN S. An application of the interaction matrices method for slope failure susceptibility zoning: Dogankent settlement area (Giresun, NE Turkey) [J]. Bull Eng Geol Environ, 2008, 67(3): 375�C385.
[11] ROZOS D, PYRGIOTIS L, SKIAS S. An implementation of rock engineering system for ranking the instability potential of natural slopes in Greek territory: An application in Karditsa County [J]. Landslides, 2008, 5(3): 261�C270.
[12] KHALOKAKAIE R, ZARE N M. Ranking the rock slope instability potential using the Interaction Matrix (IM) technique; a case study in Iran [J]. Arab J Geosci, 2012, 5(2): 263�C273.
[13] ZHANG M S, ZHU W C,HOU Z S. Numerical simulation for determining the safe roof thickness and critical goaf span [J]. Journal of Mining & Safety Engineering, 2012, 29(4): 543�C548. (in Chinese)
[14] LI Di-yuang, LI Xi-bing, ZHAO Guo-yan. Roof security thickness determination of underground goaf under open-pit mine [J]. Opencast Mining Technology, 2005(5): 17�C20. (in Chinese)
[15] ZHAO Y L, WU Q H, WANG W J. Strength reduction method to study stability of goaf overlapping roof based on catastrophe theory [J]. Chinese Journal of Rock Mechanic, 2010, 29(7): 1424�C1434. (in Chinese)
[16] WU Q H, PENG Z B, CHEN K P. Synthetic judgment on two-stage fuzzy of stability of mine gob area [J]. Journal of Central South University: Science and Technology, 2010, (7): 1424�C1434. (in Chinese)
[17] AMIR M, STEFAN C, IBRAHIM S. Inverse identification of flow stress in metal cutting process using response surface methodology [J]. Simulation Modelling Practice and Theory, 2016, 60(1): 40�C53.
[18] XU J L, WANG W C, LIANG H. Optimization of ionic liquid based ultrasonic assisted extraction of antioxidant compounds from Curcuma longa L. using response surface methodology [J]. Industrial Crops and Products, 2015, 76(12): 487�C493.
[19] SRIMANTA R, JERALD A L. Using the Box�CBenkhen design (BBD) to minimize the diameter of electrospun titanium dioxide nanofibers [J]. Chemical Engineering Journal, 2011, 169: 116�C125.
[20] TAHEREH B G, RANJBAR A A. Geometry optimization of a nanofluid-based direct absorption solar collector using response surface methodology [J]. Solar Energy, 2015, 122(12): 314�C325.
[21] OSASAN K S, STACEY T R. Automatic prediction of time to failure of open pit mine slopes based on radar monitoring and inverse velocity method [J]. International Journal of Mining Science and Technology, 2014, 24(3): 275�C280.
[22] FILIZ P, KADIR O. Partial collapses experienced for a steel space truss roof structure induced by ice ponds [J]. Engineering Failure Analysis, 2016, 60(2): 155�C165.
[23] PISKOTY G, WULLSCHLEGER L, LOSER R, HERWIG A, TUCHSCHMID M, TERRASI G. Failure analysis of a collapsed flat gymnasium roof [J]. Engineering Failure Analysis, 2014, 35(12): 104�C113.
[24] BLAAUWENDRAAD J. Ponding on light-weight flat roofs: strength and stability [J]. Engineering Structures, 2007, 29(5): 832�C849.
[25] T K G, GREGORY A K. Storm duration effects on roof-to-wall-connection failures of a residential, wood-frame, gable roof [J]. Journal of Wind Engineering and Industrial Aerodynamics, 2014, 133: 101�C109.
[26] WANG W, CHENG Y P, WANG H F. Fracture failure analysis of hard�Cthick sandstone roof and its controlling effect on gas emission in underground ultra-thick coal extraction [J]. Engineering Failure Analysis, 2015, 54: 150�C162.
(Edited by YANG Hua)
���ĵ���
�ɶ���β��¶��ӿ��²ɳ��ȶ���Ӱ�����Ӧ��Ԥ�����
ժҪ����ѧ����¶����²ɿ����ȶ�����ʵ�ֵ��²п�ȫ��Ч�زɵĹؼ����ڶ�ͭ��ɽ����²п���лزɵ�ͬʱ�������ϲ�¶��ӻ���ɶ�βɰ��Ϊ�о��ø��������µIJɳ��������⣬���õ����ط�����FLAC3D��ֵ���������ú�����Ϻͻع��������������d���������D�����綥�����h��βɰ�Ѹ�H��4��Ӱ�����ضԿ���λ�Ƶ�Ӱ�������������ɸѡ���������4��������λ����W����϶Ƚϸߣ����ϵ��R2��0.9701������29������Box-Behnken����������ԭ�����Ӧ�����飬�����������µ�βɰ�ѻ����̽���ģ�⣬����Ϸ���ع���ϼ������Է������õ�Ӱ��ɿ����ȶ��Ե������̶�����Ϊh>D>d>H����4����Ϊ���ɺ��ӵ���Ҫ���ء����Ԥ��ģ�ͶԹ���ʵ��ɳ������������Ԥ������������֤����֤�������������Ԥ��Ϻã�������ֱ�ﵽ1.67%��3.85%�����н�ǿ�IJο���ֵ��Ӧ�ÿɿ��ԡ�
�ؼ��ʣ���Ӧ�棻Box-Behnken���������ƣ���ֵģ�⣻���綥��������Ԥ��
Foundation item: Project(2017YFC0602902) supported by the National Science and Technology Pillar Program during the 13th Five-Year Plan Period, China; Project(2015CX005) supported by the Innovation Driven Plan of Central South University, China; Project(2016zzts445) supported by the Fundamental Research Funds for the Central Universities, China
Received date: 2016-06-06; Accepted date: 2017-12-20
Corresponding author: CHEN Jia-yao, Master; Tel: +86-17305893887; E-mail: chenjiayaozj@163.com
Abstract: Deformation prediction and the analysis of underground goaf are important to the safe and efficient recovery of residual ore when shifting from open-pit mining to underground mining. To address the comprehensive problem of stability in the double mined-out area of the Tong-Lv-Shan (TLS) mine, which employed the dry stacked gangue technology, this paper applies the function fitting theory and a regression analysis method to screen the sensitive interval of four influencing factors based on single-factor experiments and the numerical simulation software FLAC3D. The influencing factors of the TLS mine consist of the column thickness (d), gob area span (D), boundary pillar thickness (h) and height of tailing gangue (H). The fitting degree between the four factors and the displacement of the gob roof (W) is reasonable because the correlation coefficient (R2) is greater than 0.9701. After establishing 29 groups that satisfy the principles of Box-Behnken design (BBD), the dry gangue tailings process was re-simulated for the selected sensitive interval. Using a combination of an analysis of variance (ANOVA), regression equations and a significance analysis, the prediction results of the response surface methodology (RSM) show that the significant degree for the stability of the mined-out area for the factors satisfies the relationship of h>D>d>H. The importance of the four factors cannot be disregarded in a comparison of the prediction results of the engineering test stope in the TLS mine. By comparing the data of monitoring points and function prediction, the proposed method has shown promising results, and the prediction accuracy of RSM model is acceptable. The relative errors of the two test stopes are 1.67% and 3.85%, respectively, which yield satisfactory reliability and reference values for the mines.
