
J. Cent. South Univ. (2016) 23: 2935-2940
DOI: 10.1007/s11771-016-3357-9

Nonlinear chaotic characteristic in leaching process and prediction of leaching cycle period
LIU Chao(����), WU Ai-xiang(�Ⱞ��), YIN Sheng-hua(������), CHEN Xun(��ѫ)
State Key Laboratory of Ministry of Education of China for High-Efficient Mining and Safety of Metal Mines (University of Science and Technology Beijing), Beijing 100083, China
 Central South University Press and Springer-Verlag Berlin Heidelberg 2016
Abstract:
A laboratory leaching experiment with samples of different grades was carried out, and an analytical method of concentration of leaching solution was put forward. For each sample, respectively, by applying phase space reconstruction for time series of monitoring data, the saturated embedding dimension and the correlation dimension were obtained, and the evolution laws between neighboring points in the reconstructed phase space were revealed. With BP neural network, a prediction model of concentration of leaching solution was set up and the maximum error of which was less than 2%. The results show that there exist chaotic characteristics in leaching system, and samples of different grades have different nonlinear dynamic features; the higher the grade of sample, the smaller the correlation dimension; furthermore, the maximum Lyapunov index, energy dissipation and chaotic extent of the leaching system increase with grade of the sample; by phase space reconstruction, the subtle change features of concentration of leaching solution can be magnified and the inherent laws can be fully demonstrated. According to the laws, a prediction model of leaching cycle period has been established to provide a theoretical foundation for solution mining.
Key words:
1 Introduction
In leaching process, a series of physical and chemical reactions exist, including dissolution, diffusion, mass transfer and crystallization [1-2]. Considerable researches have been conducted to reveal the mechanism of solute transport and the variation of porosity and permeability [3-4]. However, what people are concerned about most are the change rules of concentration of leaching solution and the influencing factors.
Leaching system is a complicated nonlinear dynamic system affected by not only intrinsic factors but also external stochastic factors, which shows determinacy and some uncertainty as well as randomness. Therefore, it is difficult to develop mathematical models to predict the future state of the system. Phase space reconstruction and neural network can build a bridge between deterministic system and stochastic system [5]. However, there are few literatures reported about the nonlinear chaotic characteristic and leaching cycle period prediction of leaching system.
Hence, in this work, a laboratory leaching experiment was carried out to obtain the concentration of leaching solution of different grade samples. The chaotic characteristics were analyzed based on phase space reconstruction. The evolution laws of phase points distance and energy dissipation were revealed. Leaching cycle period was accurately predicted by combining gradient descent method and chaos optimization method with BP neural network, and a corresponding prediction system was set up to provide a theoretical foundation for solution mining.
2 Experiment
2.1 materials
To simulate the leaching process of sandstone-type ore, four samples of different grades (respectively 0, 1%, 3% and 5%) were made from river sand as aggregate, cement as binding agent and salt as useful component, and a laboratory leaching experiment was carried out with water as the leaching solution. Each of the samples was 50 mm in height and 25 mm in diameter, as shown in Fig. 1 [6-7].
2.2 Experimental procedure
Firstly, the cement, salt, river sand and water in a mixing barrel were whisked together until they well combined. After even agitation, the slurry was plunged into moulds with vibration. 24 h later, the moulds were removed, then, the samples were placed indoors for 28 d. Secondly, the samples were put into a constant temperature of oven, still at 105 ��C for 2 d. Lastly, after weighing was completed, each sample was put into purified water (550 mL), respectively, and the concentration of leaching solution was measured every 12 h. For each sample, it has been measured 126 times, so there are 504 data in all, as shown in Fig. 2.

Fig. 1 Finished samples

Fig. 2 Monitoring curve of concentration of leaching solution
3 Analysis on concentration of leaching solution
According to Fig. 2, the useful component also has been detected in the leaching solution of sample of grade 0, which indicats that there may exist salt in the experimental materials. The changing curve of leaching rate with time can be figured out, as shown in Fig. 3.
According to Fig. 3, the leaching rate increases gradually with the reaction progress. Furthermore, it performs an evolution of initial fast-increasing, midterm slow-increasing and final stabilizing. Early in the leaching process, the leaching rate of low grade samples is lower than that of higher-grade samples. However, in the later stage, it��s exactly the opposite.
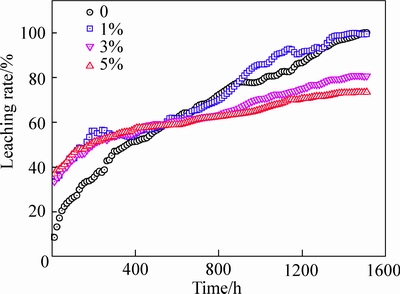
Fig. 3 Changing curve of leaching rate with time
4 Chaotic characteristic of leaching process
4.1 Phase space reconstruction
During the leaching process, change in the concentration of leaching solution is the result of material and energy exchange with the outside. So, it is a nonlinear dynamical system with energy dissipation. The laws of energy dissipation are reflected in the monitoring data, but it is difficult to establish mathematical models.
The monitoring data in the leaching experiment are four groups of univariate time series, x1, x2, ��, xm (m=126), with time interval ��t=12 h. By adopting proper time interval, the phase space of concentration of leaching solution can be reconstructed as
 (1)
(1)
where n is the embedding dimension of the dynamic system; �� is the new time interval, ��=k��t(k=1, 2, 3, ��). The number of phase points is N (N=m-n+1). All the points, with coordinates {x(ti), x(ti+��), ��, x(ti+(m-1)��)}, constitute a reconstructed phase space.
After the reconstruction of phase space, according to Takens�� Embedding Theorem [8], a reasonable embedding dimension n can be obtained to keep diffeomorphism between the locus in the reconstructed phase space and the quondam dynamical system, where n��2D+1 and D are the dimension of the new dynamical system which can be calculated by Grassberger- Procaccia method shown as Eq. (2).
 (2)
(2)
where r is the measuring scale and Cn(r) is the probable distance between 2 points which is smaller than r in the reconstructed phase space [9]. The dimension D increases with the embedding dimension n, but when n exceeds a certain value, D increases little. So, the certain value can be considered the saturated embedding dimension, and D is referred to as the corresponding correlation dimension of the reconstructed phase space [10].
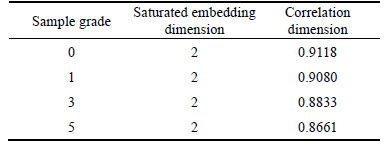
According to Eq. (1) and Eq. (2), set k=1, the saturated embedding dimension and the correlation dimension of time series of monitoring data can be calculated, as shown in Table 1. The saturated embedding dimension of all the four groups of time series in the reconstructed phase space is 2, but the correlation dimension increases with the decrease of grade of the sample.
Table 1 Saturated embedding dimension and correlation dimension of leaching system
4.2 Chaotic identification
At present, there are many methods for chaotic identification, such as phase diagram method, power spectrum method, entropy method and Wolf method. However, Wolf method is simpler and more practical than the others, the key idea of which is to calculate the Lyapunov index �� [11]. Lyapunov index is a fixed parameter to embody the development trend of locus in phase space. If ��<0, the dynamic system is steady. Instead, if �ˡ�0, chaotic characteristic exists in the system [12]. In N-dimension phase space, the number of Lyapunov indexes is N, and if the maximum Lyapunov index ��max��0, it means that the system has the characteristics of chaos [13-14].
According to the monitoring data in the leaching experiment (Fig. 2), for each sample, there are 125 2-dimension phase points in the reconstructed phase space with saturated embedding dimension m=2. On the basis of Wolf method, the maximum Lyapunov index ��max for each group of time series can be obtained: 


 0.0021. All the maximum Lyapunov indexes are larger than 0, which indicates chaotic characteristic in the leaching system. Furthermore, the maximum Lyapunov index and the chaotic extent increase with grade of the sample.
4.3 Distance evolution of neighboring points
After reconstruction of the time series, each phase point stands for a state of the solution system. Suppose that point Xa is the nearest to Xk, the distance Zk between them can be calculated as


 (3)
(3)
The rest can be obtained in a similar way, so the series Z of distance evolution of neighboring points in the reconstructed phase space can be deduced as
Z=(Z1, Z2, ��, Zj), j=1, ��, N (4)
For each reconstructed phase space of the monitoring data, the distance between two neighboring points can be obtained from Eq. (3), and an array Z is calculated by Eq. (4), which contains 125 distance values. In this experiment, the evolution curves of distances between neighboring points in time sequence of concentration of leaching solution are shown in Fig. 4.
According to Fig. 4, the curves show oscillations in phase point distance, whose amplitudes decrease with grade of the sample. Comparing Figs. 4 and 2, the concentration of leaching solution is studied on 1-dimension curve in Fig. 2, and the internal rules are covered by accumulation. So, it is hard to distinguish the chaotic characteristics. However, in Fig. 4, the subtle change features of the leaching system are magnified by phase space reconstruction, and the inherent laws are fully demonstrated in the 2-dimension space.
By analyzing the array Z with Fourier transform [15], the power spectrum can be obtained as
 (5)
(5)
According to Eq. (5), the time-power spectrum curve for the leaching system can be obtained, as shown in Fig. 5, which illustrates the evolution laws of energy dissipation [16]. Comparing the sub-graphs in Fig. 5, the energy dissipation increases with grade of the sample.
5 BP neural network prediction of leaching cycle period
5.1 Prediction of concentration of leaching solution
Each point in phase space represents a leaching state. So, the issue of predicting concentration of leaching solution is turned into determining the phase point position for the future [17]. BP neural network can abstract and simulate some basic characteristics of the human brain, the algorithm of which is essentially a nonlinear optimal program [18]. Through applying BP neural network, the trend of leaching system can be forecasted on the basis of a relatively small quantity of data. By the combination of gradient descent method and chaos optimization method, BP neural network can achieve the merit of rapid training [19]. Therefore, the concentration of leaching solution is predicted by combining phase space reconstruction with BP neural network. Thus, the fast and accurate prediction can be realized.

Fig. 4 Distance evolution curves of phase points:
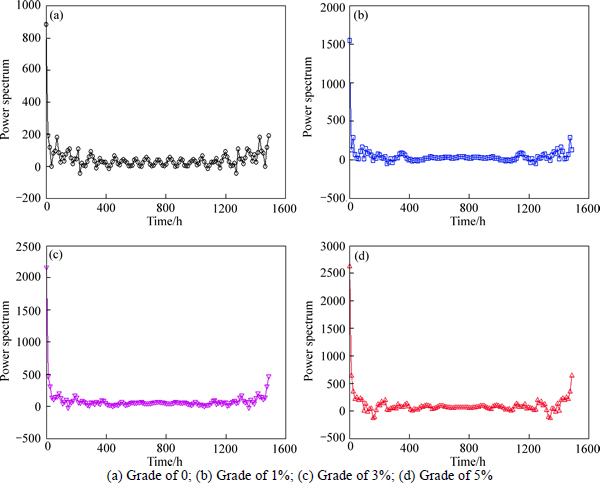
Fig. 5 Time-power spectrum curves for leaching system:
For the monitoring time series, neighboring points of concentration of leaching solution in reconstructed phase space were passed in as inputs, and the distance of neighboring point was passed out as output. Through training of the BP neural network, the prediction model was formed.
Using BP neural network, the linear first-order differential equation of Z can be gained as
 (6)
(6)
where b and c are parameters, which can be calculated by applying least square method.
The general solution of Eq. (6) is
 (7)
(7)
After the phase point distance is obtained, the position of phase point in reverse will be figured out, and the concentration of leaching solution can be acquired by solving Eq. (3).
5.2 Prediction of leaching cycle period
At the present time, to determine the leaching cycle period, there are two methods commonly used: one is based on design leaching rate, the other the breakeven point. Nevertheless, leaching cycle periods obtained by both the two approaches are determined by concentration of leaching solution. Taking the first method for instance, assuming that R is the design leaching rate, the condition equation can be described as
 (8)
(8)
where V is volume of the leaching solution; m is mass of the ore; G is ore grade. By substituting the predicted concentration of leaching solution into Eq. (8), the predicted leaching cycle period can be figured out.
Taking the sample with grade of 3% as an example, BP neural network model trained through the combination of the gradient descent method and chaos optimization method was adopted to predict the trend of concentration of leaching solution. To examine the predicted results, the last 20 data do not get involved in the training so that they can be used to verify the model. The contrast curves of measured and predicted concentration of leaching solution between the 1284th hour and the 1512th hour are shown in Fig. 6.
Comparing the last 20 data in Fig. 6, the errors between the measured and predicted data are very slight. The maximum error is less than 2%. Suppose that the designed leaching rate is 80%, the predicted leaching cycle period (1392 h) can be figured out by Eq. (8), which is very close to the measured value (1416 h).

Fig. 6 Comparison between measured and predicted results of concentration of leaching solution
In a similar way, leaching cycle period of the other samples can be predicted. The results show that the BP neural network prediction model based on phase space reconstruction has a high precision to approach the monitoring data.
6 Conclusions
1) Leaching system is a complicated nonlinear dynamic system affected by not only intrinsic factors but also external stochastic factors, which shows chaotic characteristic.
2) Samples of different grades have different nonlinear dynamic features: the higher the grade of sample, the smaller the correlation dimension; furthermore, maximum Lyapunov index, energy dissipation and chaotic extent of the leaching system increase with grade of the sample.
3) The subtle change features of the concentration of leaching solution are magnified and the inherent laws are fully demonstrated in the reconstructed phase space.
4) The prediction model of the leaching cycle period is established based on phase space reconstruction and BP neural network. Precise prediction of concentration of leaching solution is achieved, and the maximum error is less than 2%, which can provide a theoretical foundation for solution mining.
References
[1] LI Yu-hu, LIU Zhi-hong, ZHAO Zhong-wei, LI Qi-hou, LIU Zhi-yong, ZENG Li. Determination of arsenic speciation in secondary zinc oxide and arsenic leachability [J]. Transactions of Nonferrous Metals Society of China, 2012, 22(5): 1209-1216.
[2] WATLING H R. The bioleaching of sulphide minerals with emphasis on copper sulphides: A review [J]. Hydrometallurgy, 2006, 84(1/2): 81-108.
[3] WANG Yi-ming, WU Ai-xiang, ZUO Heng, YANG Bao-hua. Effect of particles sedimentation during leaching on seepage characteristic of copper dumps [J]. Transactions of Nonferrous Metals Society of China, 2007, 17(12): 2074-2078. (in Chinese)
[4] LI Hong-xu, CANG Da-qiang, QIU Guan-zhou, WU Ai-xiang. Kinetics of secondary copper sulfide heap bioleaching concerning potential and heap constitution [J]. Journal of Central South University: Science and Technology, 2006, 37(6): 1087-1093. (in Chinese)
[5] SIVAKUMAR B. Chaos theory in geophysics: Past, present and future [J]. Chaos, Solitons and Fractals, 2004, 19(2): 441-462.
[6] LIU Xin-yu, LIU Ai-hua, LI Xi-bing. Experimental study of permeability of rock-like material with filling fractures under high confining pressure [J]. Chinese Journal of Rock Mechanics and Engineering, 2012, 31(7): 1391-1398.
[7] WU Ai-xiang, LIU Chao, YIN Sheng-hua, KE Jing-fu, XUE Zhen-lin. Leaching properties of quasi-sandstone type ore [J]. The Chinese Journal of Nonferrous Metals, 2014, 24(7): 1856-1863. (in Chinese)
[8] PANAGOULIA D, VLAHOGIANNI E I. Non-linear dynamics and recurrence analysis of extreme precipitation for observed and general circulation model generated climates [J]. Hydrological Processes, 2014, 28(4): 2281-2292.
[9] LIU Zhi-xiang, GUO Yong-le, LIU Chao, LU Jun-hua. Laws of strata energy release and corresponding safety waming system in metal mine [J]. Transactions of Nonferrous Metals Society of China, 2011, 21(11): 2508-2512.
[10] ALBANO A M, MUENCH J, SCHWARTZ C, MEES A I, RAPP P E.Singular-value decomposition and the Grassberger-Procaccia algorithm [J]. Physical Review A, 1988, 38(6): 3017-3026.
[11] SHERIF J, SINGHANIA R. Extracting order from chaos [J]. Kybernetes, 1972, 38(6):1014-1020.
[12] BRESTEN C L, JAE H J. A study on the numerical convergence of the discrete logistic map [J]. Communications in Nonlinear Science and Numerical Simulation, 2009, 14(7): 3076-3088.
[13] WOLF A, SWIFT J B, SWINNEY H L, VASTANO J A. Determining Lyapunov exponents from a time series [J]. Physica, 1985, 16(3): 285-317.
[14] SHAHVERDIEV E M, HASHIMOVA L H, HASHIMOVA N T. Chaos synchronization in some power systems [J]. Chaos, Solitons and Fractals, 2008, 37(3): 827-834.
[15] LIU Zhi-xiang, LIU Chao, LIU Qiang, YUE Yan-liang. Chaotic time series reconstruction and security alarm system of rock mass deformation in undersea mining [J]. Chinese Journal of Geotechnical Engineering, 2010, 32(10): 1530-1534. (in Chinese)
[16] ANDERSV. Fourier analysis and its applications [M]. New York: Springer-Verlag, 2003: 122-145.
[17] KAYACAN E, ULUTAS B, KAYNAK O. Grey system theory-based models in time series prediction [J]. Expert Systems with Applications, 2010, 37(2): 1784-1789.
[18] SIVAKUMAR B, JAYAWARDENA A W, FERNANDO T M. River flow forecasting: Use of phase-space reconstruction and artificial neural networks approaches [J]. Journal of Hydrology, 2002, 265(1): 225-245.
[19] LIU Zhi-xiang, TANG Zhi-xiang, WANG Wei-hua, SUN Jing-jing, PENG Kang. New algorithm of mine slope reliability based on limiting state hyper-plane and its engineering application [J]. Journal of Central South University, 2015, 22(1): 317-322.
(Edited by YANG Hua)
Foundation item: Project(51374035) supported by the National Natural Science Foundation of China; Project(2012BAB08B02) supported by the National ��Twelfth Five�� Science and Technology, China; Project(NCET-13-0669) supported by New Century Excellent Talents in University of Ministry of Education of China
Received date: 2015-06-08; Accepted date: 2016-01-18
Corresponding author: YIN Sheng-hua, Professor, PhD; Tel: +86-10-62334680; E-mail: lchdaizi@163.com
Abstract: A laboratory leaching experiment with samples of different grades was carried out, and an analytical method of concentration of leaching solution was put forward. For each sample, respectively, by applying phase space reconstruction for time series of monitoring data, the saturated embedding dimension and the correlation dimension were obtained, and the evolution laws between neighboring points in the reconstructed phase space were revealed. With BP neural network, a prediction model of concentration of leaching solution was set up and the maximum error of which was less than 2%. The results show that there exist chaotic characteristics in leaching system, and samples of different grades have different nonlinear dynamic features; the higher the grade of sample, the smaller the correlation dimension; furthermore, the maximum Lyapunov index, energy dissipation and chaotic extent of the leaching system increase with grade of the sample; by phase space reconstruction, the subtle change features of concentration of leaching solution can be magnified and the inherent laws can be fully demonstrated. According to the laws, a prediction model of leaching cycle period has been established to provide a theoretical foundation for solution mining.
