
J. Cent. South Univ. Technol. (2011) 18: 250-258
DOI: 10.1007/s11771-011-0687-5
![]()
Modeling mechanistic responses in asphalt pavements under three-dimensional tire-pavement contact pressure
HU Xiao-di(����)1, 2, L. F. WALUBITA1
1. Texas Transportation Institute, Texas A&M University System, College Station, Texas 77840-3135, USA;
2. Transportation Research Center, Wuhan Institute of Technology, Wuhan 430073, China
? Central South University Press and Springer-Verlag Berlin Heidelberg 2011
Abstract:
A three dimensional finite element program incorporating actually measured vertical tire-pavement contact pressure (TPCP) was utilized for modeling the mechanistic responses in asphalt concrete (AC) layers by simulating various vehicle motions: stationary and non-stationary (i.e. in acceleration or deceleration mode). Analysis of the results indicated the following items. 1) It is critical to use the vertical TPCP as the design control criteria for the tensile strains at the bottom of the AC layer when the base layer modulus is lower in magnitude (e.g. ��400 MPa); however, when the base layer modulus is higher in magnitude (e.g. ��7 000 MPa), the horizontal TPCP and the tensile strains in the X-direction at the surface of the AC layer should also be considered as part of the design response criteria. 2) The definition of ��overload�� needs to be revised to include tire pressure over-inflation, i.e., a vehicle should be considered to be overloaded if the wheel load exceeds the specification and/or the tire inflation pressure is higher than the specification. 3) Light trucks have more structural impact on the strain responses and pavement design when the thickness of the surfacing AC layer is thinner (e.g. ��50 mm). 4) The acceleration of a vehicle does not significantly impact the AC surface distresses such as rutting at the top of the upgrade slopes or intersections; however, vehicle deceleration can dramatically induce horizontal shear strains and consequently, aggravate shoving and rutting problems at the highway intersections. Evidently, these factors should be taken into account during mechanistic stress-strain modeling and structural design of asphalt pavements.
Key words:
1 Introduction
Currently, in most analytical studies, only vertical tire-pavement contact pressure (TPCP) is used to model the pavement responses. This is mainly because vertical TPCP is much easier to measure (or model) than horizontal TPCP (i.e. latitudinal and longitudinal TPCP). In most cases, the vertical TPCP is simply assumed to be equal to the tire inflation pressure and the horizontal TPCP is ignored. However, even in the case of a fully bonded interfacial layer, latitudinal TPCP significantly affects the pavement strains at the interface [1]. Additionally, at some special sections, i.e. the top of upgrade slopes and intersections, the damaging effects such as deformation/rutting and/or shoving due to the induced strains, are more severe than those at the normal flat sections of the highway. One reason for this is the poor resistance of asphalt concrete (AC) to deformation/rutting induced by longer loading time at these sections in the AC layer, particularly at elevated temperatures. Another probable factor is the vehicle deceleration and/or acceleration that results from the changes in the vehicle speed. This deceleration/ acceleration ultimately induces a change in the longitudinal TPCP (along the vehicle travel direction) so that different mechanistic responses may arise at these sections.
So, with the exception of the vertical TPCP, calculating the mechanistic responses when considering three-dimensional (3D) stress-strain modeling requires knowledge of both the latitudinal and longitudinal TPCP. As a simple approximation method, the TPCP is traditionally assumed to be uniformly distributed over a circular contact area and simply equal to the tire inflation pressure and only the vertical TPCP is considered [2].
However, some studies have demonstrated that the vertical TPCP is far from being uniformly distributed and that the distribution of the vertical TPCP is significantly dependent on the tire load, tire inflation pressure, tire type, and tire age [3-4].
Some researchers have measured and/or approximated the three-dimensional TPCP. In their studies, SIDDHARTHAN et al [5] noticed that those horizontal TPCP distributions are non-uniform but resulted in much lower values in magnitude than those found by de BEER et al [6]. These researchers concluded that longitudinal and lateral TPCPs did not significantly influence the pavement responses because of their relatively low magnitudes compared with the vertical TPCP. They reported the maximum longitudinal and lateral TPCPs of about 12% and 16%, respectively, of the maximum vertical TPCP in their studies. However, Al-QADI et al [7-8] observed that the maximum longitudinal and lateral TPCPs measured in the field were about 10%-15% and 30%-51% of the vertical TPCP, respectively; but the transverse contact shear stress in the middle of each rib was close to zero.
MYERS et al [3] thought that the transverse and vertical TPCP distributions had more significant effects on the mechanistic responses than those caused by longitudinal TPCP distributions. Significant differences were found in the transverse TPCP distributions of bias ply and radial tires.
In 2003, SOON et al [9] observed that the tangential tractions were distributed anti-symmetrically and outward and had a zero value in the middle when the tire tread was loaded only vertically. These researchers also observed that the distribution of normal tractions had no qualitative effect on the horizontal surface stresses.
Based on the above literatures, the following characteristics can be inferred about the three- dimensional TPCP. 1) The vertical TPCP is absolutely non-uniformly distributed. 2) The lateral TPCP is variably different for each tire type and tread pattern. However, although the relationship between the vertical and lateral TPCP is indistinct to the longitudinal tread tire pattern, the lateral TPCP in the middle of each rib is often close to zero. 3) The influence of the longitudinal TPCP (when the velocity of a vehicle is constant) on a pavement structure is weaker relative to the vertical TPCP and lateral TPCP. 4) The TPCP changes with the wheel load level and tire inflation pressure. To some extent, the magnitude and influence of the TPCP are also dependent on the tire type, tread pattern and tire age, with the old tires associated with more severity. 5) The induction, orientation, and magnitude of the TPCP in the surfacing AC layer are equally dependent on the whole pavement structure, the layer thickness, and the layer material properties (i.e. modulus and Poisson ratio).
On the basis of the above discussions, the objective of this work was to model and compare the mechanistic responses under three-dimensional TPCP in an AC layer for the following three cases: 1) varied lateral TPCP, 2) different wheel load levels and tire inflation pressures, and 3) effects of vehicle acceleration/deceleration and TPCP stress-strain responses at some special highway sections such as the top of upgrade slopes and intersections.
To accomplish these objectives, a three-dimensional finite element (3D-FE) program (ANSYS) [10] incorporating the actually measured TPCP [4] was utilized to model the 3D TPCP and compute the mechanistic responses in an AC layer of a flexible asphalt pavement.
2 Methodological approach
2.1 3D-FE loading configuration and boundary conditions
Fig.1 shows the 3D-FE loading configuration in terms of the tire contact print area (shaded areas), the X-Y-Z coordinate system, and the pavement structure, simulated on the pavement surface for 3D-FE analysis. It is worthy to point out that the AC layer in Fig.1 can be divided into any number of sub-layers for 3D-FE modeling. The maximum dimensional lengths adapted for the X, Y, and Z axes were 5.0, 5.0, and 8.0 m, respectively. The boundary conditions were assumed as follows: 1) no Z-directional displacement on the underside, 2) no X-directional displacements on both the left and right sides of the origin, and 3) no Y-directional displacements on both the front (upper) and back (lower) sides of the origin. All the layers were assumed to be fully-bonded at the interface [11]. According to WANG and MACHEMEHL [12], the mechanistic response in an AC layer due to the effect of dual tires on a single axle configuration is similar to the effect of dual tires on each of the tandem axles. So, only dual tires on a single axle loading configuration were considered in the 3D-FE analysis in this study. Additionally, linear elastic material properties for each layer were used in this study. Theoretically, viscoelastic modeling for the AC layer and non-linear elastic modeling for the base layer are desirably more reasonable for mechanistic response analysis. However, it was considered acceptable to use linear elastic material properties in this study because the computed results based on multi-layer linear elastic theory were satisfactorily verified with measured field data [13].
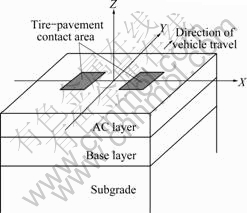
Fig.1 Simulated 3D-FE loading configuration on pavement surface
2.2 Applied three-dimensional tire-pavement contact pressure
Based on the fundamental mechanics theory and irrespective of the magnitude, distribution and direction of the TPCP, when the vehicle velocity is lower or zero, all of the outside forces acting on the pavement surface at a particular point must satisfy the following equations:
![]() (1)
(1)
![]() (2)
(2)
![]() (3)
(3)
In Eqs.(1)-(3), ![]() is the vertical TPCP that acts on each node in the 3D-FE program (kN); n is the total number of nodal points where the TPCP acts in the 3D-FE program; W is the applied wheel load (kN);
is the vertical TPCP that acts on each node in the 3D-FE program (kN); n is the total number of nodal points where the TPCP acts in the 3D-FE program; W is the applied wheel load (kN); ![]() is the longitudinal TPCP acting on each node in the 3D-FE program (kN); m is the vehicle mass (kg); a is the vehicle acceleration or deceleration (m/s2); and
is the longitudinal TPCP acting on each node in the 3D-FE program (kN); m is the vehicle mass (kg); a is the vehicle acceleration or deceleration (m/s2); and ![]() is the lateral TPCP acting on each nodal point in the 3D-FE program (kN).
is the lateral TPCP acting on each nodal point in the 3D-FE program (kN).
When the vehicle speed is constant (i.e. a=0 m/s2), the composition of the forces in the Y direction is zero. At that time, the direction of the longitudinal TPCP at a given nodal point on the pavement surface varies between the entrance and exit point of the tire (see Fig.2), and the vehicle is assumed to move by the momentum that is caused by the longitudinal TPCP [14].
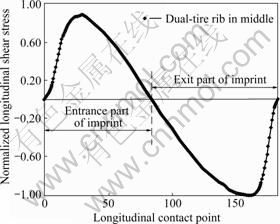
Fig.2 Distribution of measured longitudinal load stress [8]
2.3 Vertical TPCP
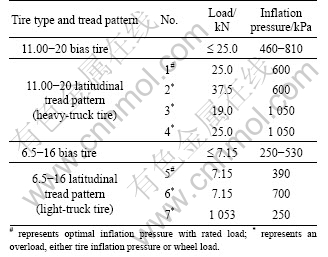
When the velocity of a vehicle is lower or zero, all of the vertical forces acting on the pavement surface must satisfy Eq.(1). Therefore, the sum of the vertical TPCPs acting on the pavement is assumed to be equal to the wheel load. For the actually measured static TPCP [4] in this study, two longitudinal tires tread patterns, a 6.5-16 bias tire (light truck) and an 11.00-20 bias tire (heavy truck), under different wheel loadings and different tire inflation pressures, were utilized.
The tread pattern and tire-pavement contact printing area of the 11.00-20 longitudinal patterned tire is similar to that of 6.5-16 longitudinal tread patterned tire, except for the width and length of the contact printing areas (see Figs.3(a) and 3(b)). Therefore, their tire-pavement contact areas were similarly and simplistically modeled as shown in Fig.3(c) for 3D-FE analysis (a series of interspaced rectangular blocks). For 3D-FE analysis shown in Fig.3(c), each rectangle was
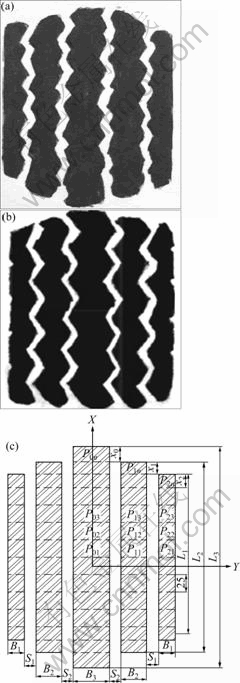
Fig.3 Tire-pavement contact printing areas and 3D-FE model simplification for longitudinal tread pattern tires: (a) 6.5-16 tire; (b) 11.00-20 tire; (c) Simplified 3D-FE configuration
subdivided into numerous meshes denoted as Pij and then, each mesh was assumed to be of uniform vertical TPCP. The vertical TPCP was symmetrically modeled about the X-Y axes. Based on HU��s laboratory study [4] of actual TPCP measurements, 7 TPCP loading-tire inflation pressure combinations including different tire types and tire tread patterns with varied load levels and tire inflation pressures were selected for 3D-FE evaluation in this study. These TPCP factor-level combinations are listed in Table 1.
Table 1 TPCP loading parameters
2.4 Lateral TPCP
The lateral tire-pavement contact pressure (LTPCP) is variably different for different tire types and tread patterns, and the relationship between vertical TPCP and LTPCP is indistinct [3, 7]. However, when the tire treads were loaded only vertically, two observations were made, based on the actually measured data [3, 7, 9]: 1) The LTPCP in the middle of each rib was approximately close to zero and the composition of the LTPCP acting on the pavement surface must satisfy Eq.(2), i.e., must sum up to zero; 2) For a given tire tread pattern at constant wheel loading and tire inflation pressure, the LTPCP will remain constant or change insignificantly with the change in the vehicle speed.
Based on these observations, the following assumptions were made for the following LTPCP configuration: 1) When the LTPCP value in the middle of each rib is zero including that on both sides of each rib, the directions of the LTPCP are anti-symmetrical and in the inward direction (see Fig.4); 2) For each node that only endures the wheel load partially, the LTPCP is proportional to the vertical tire-pavement contact pressure acting on that node.
In 1996 and 2002, de BEER et al [6] and SIDDHARTHAN et al [5] reported that the maximum LTPCP was about 16% of the maximum vertical TPCP. However, AL-QADI and YOO [7] and MYERS et al [6]
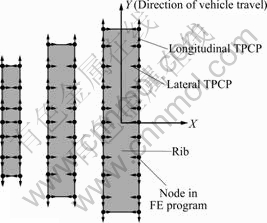
Fig.4 Schematic horizontal TPCP direction acting on nodes (Only 3 of 5 ribs are shown)
reported the maximum LTPCP of about 30%-51% of the vertical TPCP based on field measurements. As a matter of fact, the proportion of the LTPCP to the vertical TPCP depends on the inner configuration of the tire, the tire inflation pressure, the tire type and tread pattern, the tire age, the abrasion condition of the tire, etc. These all make the computation of the true magnitude of the LTPCP somewhat complex. On this basis, the following proportions of the LTPCP to the vertical contact pressure were assumed for this study to be 15%, 30% and 45%.
2.5 Longitudinal TPCP
The longitudinal TPCP is considered not to significantly influence the mechanistic responses if the vehicle is stationary or moving at a constant speed [3, 5-7]. However, when the vehicle is accelerating or decelerating, i.e., the speed is changing, the longitudinal TPCP changes significantly and may probably have a significant impact on the mechanistic responses. To maintain the equilibrium, the composition of the longitudinal stress must still satisfy Eq.(3).
In consideration of the literature and Eq.(3), the following assumptions were made in this study with respect to modeling the longitudinal TPCP. 1) When a vehicle is moving at a constant speed and only one tire- pavement contact area is considered, the longitudinal TPCP at the middle node is zero. For each node at the entrance point, the longitudinal TPCP is about 12% of its vertical TPCP and the direction of the TPCP is along the direction of the vehicle travel. For each node at the exit point, the longitudinal TPCP is also about 12% of its vertical TPCP and the direction of stress (TPCP) is in the opposite direction of the vehicle travel (see Fig.4). 2) When a vehicle is accelerating or decelerating and all the nodes in the tire-pavement contact area are considered, the longitudinal TPCP is proportional to the vertical TPCP that is acting on the nodes and its magnitude is also dependent on the magnitude and direction of acceleration or deceleration. However, the composition of the longitudinal TPCP must be equal to ma (see Eq.(2)).
2.6 Pavement structures
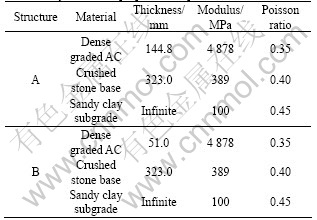
Two typical (simple) pavement structures were arbitrarily utilized: a thick and a thin AC pavement, differing only in the top AC layer thickness [15]. The pavement structures including the material properties are listed in Table 2.
Table 2 Layer material properties for pavement structures
3 Results and analysis
3.1 Mechanic responses computed
Structurally, the mechanistic responses of prime significance in the pavement structures shown in Table 2 include the following items: 1) the tensile stresses or strains at the bottom and surface of the AC layer, which are considered as the main factors that cause cracking in the AC layer, 2) the horizontal shear stresses or strains at the bottom and surface of the AC layer, which are considered as the main causes of horizontal shoving in the AC layer, 3) the 45? maximum shear stresses (=(��1-��3)/2; ��1 and ��3 are the first and third principal stresses, respectively) within the AC layer, which is considered by some researchers as the main factor that causes permanent deformation and rutting [16], and 4) the compressive stresses and strains on top of the subgrade that contributes to total pavement rutting.
However, because the objective of this study was to evaluate the mechanistic responses in the AC layer, only the stress-strain responses in the AC layers are presented. Based on the 3D-FE program ANSYS [10], the following mechanistic responses were computed and are presented: 1) the maximum tensile strains at the surface (��t,s,X and ��t,s,Y, X and Y directions, respectively) and at the bottom (��t,b,X and ��t,b,Y, X and Y directions, respectively) of the AC layer, 2) the maximum horizontal shear strains at the surface (��s,s,YZ and ��s,s,XZ) and at the bottom (��s,b,YZ and ��s,b,XZ) of the AC layer, and 3) the peak value of the 45? maximum shear stress (��max) in the AC layers.
3.2 Influence of lateral TPCP
The influence of the lateral TPCP on the mechanistic responses in the AC layer is presented. The tire load-inflation pressure combination No.1 in Table 1 was used. The percentages of the lateral TPCP to the vertical contact pressure were assumed as 15%, 30%, and 45%, respectively. Zero percent lateral and longitudinal TPCPs were also considered in the study, i.e., the case of only vertical TPCP without any lateral or horizontal TPCP. The pavement structures in Table 2 were utilized with the following three base layer moduli: 389 MPa (simulating a typical base layer), 7 000 MPa (simulating a semi-rigid base layer), and 30 000 MPa (simulating a Portland cement concrete (PCC) base layer). The 3D-FE results are presented in Table 3.
Based on Table 3, the following observations can be inferred:
1) The maximum tensile strains at the bottom of the AC layer, ��t,b,X and ��t,b,Y, are hardly influenced by the different magnitudes of the lateral TPCP regardless of the thickness of the AC layer and the modulus of the base layer. In other words, when the tensile strains at the bottom of the AC layer are of primary concern, the lateral TPCP can be ignored in the structural design analysis.
2) The maximum tensile strains in the Y direction at the surface of the AC layer, ��t,s,Y, varies as a function of the lateral TPCP depending on the base modulus. However, since the magnitude of ��t,s,Y is always lower or negative (i.e. the maximum is 45��10-6), the strains in the Y directions can structurally be ignored during structural design and analysis. The maximum tensile strains in the X direction at the surface of the AC layer, ��t,s,X, will obviously change proportionately as a function of the lateral TPCP (see Table 3). From Table 3, the maximum tensile strains at the bottom of the AC layer were higher in magnitude than the maximum tensile strains at the surface of AC layer only when the base layer modulus was lower (i.e. 389 MPa). When the base layer modulus was stiffer, i.e. 7 000 MPa and 30 000 MPa, the maximum tensile strains in the Y direction at the surface of the AC layer were comparatively higher in magnitude. For the structures evaluated in this study, if a strain of 70��10-6 is used as the governing mechanistic response parameter to control fatigue cracking in the AC layer [17], bottom-up initiated cracking due to excessive tensile strains associated with only the vertical TPCP is likely to occur only when the base layer modulus is relatively low in magnitude. However, when the base layer modulus is higher and if top-down initiated cracking is to be considered, it is critical that the controlling
Table 3 Computed results under different vertical TPCP
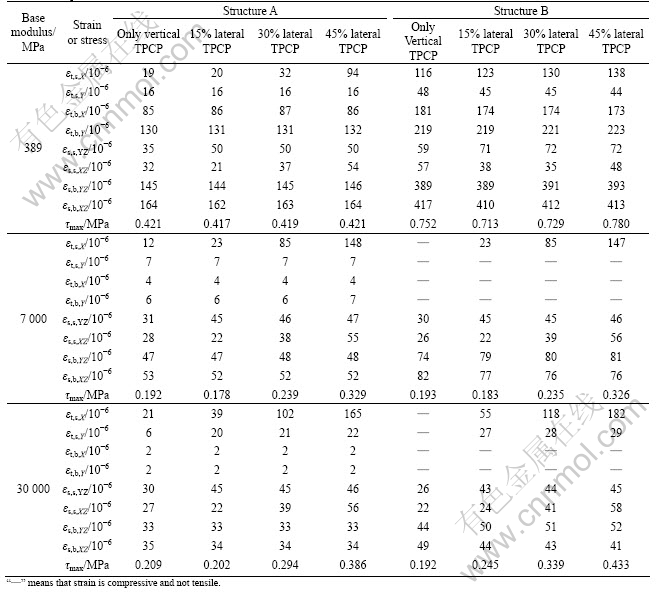
tensile strains at the surface of the AC layer (in the X direction) are related to the horizontal TPCP, especially at higher lateral TPCP values.
3) The lateral TPCP hardly influences the horizontal shear strains at the bottom of the AC layer. For the horizontal shear strains at the surface of the AC layer, although it is influenced by the lateral TPCP, this influence can be neglected since the computed response strains were similar in magnitude.
4) The peak value of the 45? maximum shear stress in the AC layers, ��max, was found to be influenced by the lateral TPCP only when the base layer modulus is higher (>389 MPa). Conversely, ��max increased with higher lateral TPCP.
3.3 Comparison of mechanistic responses under different wheel load levels and tire inflation pressures
As listed in Table 1, 7 tire load-inflation pressure combinations, which include overloading and over inflated tires, were considered. For each case, 12% and 15% of the longitudinal TPCP and lateral TPCP to the vertical contact pressure, respectively, were assumed. Considering the structures in Table 2 and the results presented in Table 4, the following items can be inferred:
1) Not only will different wheel load levels cause different mechanistic responses (under the same tire inflation pressure), different tire inflation pressures will also lead to different mechanistic responses in the same pavement structure if the load level is held constant.
2) The ��t,b,Y values in structure A and structure B under the 2 500 kN-600 kPa loading combination are 130��10-6 and 219��10-6, respectively. However, under the 2 500 kN-1 050 kPa loading combination, the ��t,b,Y values are 142��10-6 and 301��10-6, respectively; being higher in magnitude for the 2 500 kN-600 kPa loading combination. Furthermore, the ��t,b,Y in structure B under 3 750 kN-600 kPa is 231��10-6 whereas it is 266��10-6
Table 4 Computed results under different wheel load levels and tire inflation pressure
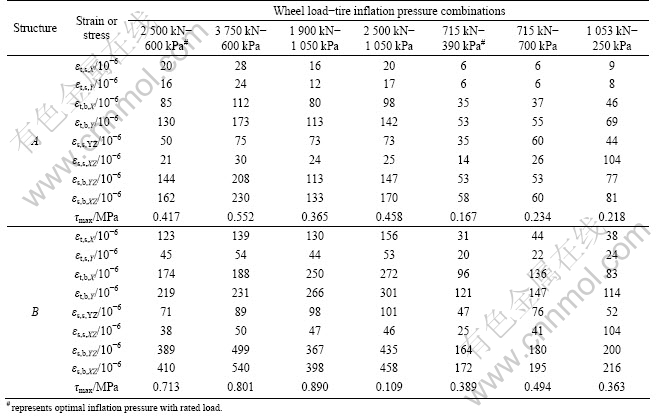
under the 1 900 kN-1 050 kPa loading combination. The ��t,s,X, ��max, and horizontal shear strains have the same characteristic in both structures. This means that when the tire inflation pressure is high (i.e. over the allowable range), even if the wheel load level is at the rated value (or below), the mechanistic responses are higher in magnitude than that with optimal tire inflation pressure whether the tire load is normal or a little higher. This is detrimental to pavements and is undesirable. Unfortunately, tire pressure over-inflation is a common occurrence in most countries including USA [18-19].
3) The ��t,b,X and ��t,b,Y of the AC layer in structure B caused by a light truck are more than 70��10-6. Specifically, the ��s,s,XZ in both structures under the 1 053 kN-250 kPa loading combination, is obviously higher than all the others factor-level combinations. Therefore, a light truck (i.e. ��30 kN on the rear axle) should have more structural recognitions in design and analysis, particularly when the thickness of the AC layer is thinner and is overloaded and/or over inflated.
3.4 Influence of acceleration/deceleration
As mentioned previously, on some special highway sections such as intersections and/or the top of upgrade slopes, rutting (and/or shoving) is generally more severe than that on normal flat sections of the highway. At these special sections, there are two changes probably influencing the mechanistic responses in the AC layer: one is the change in the vehicle speed leading to a longer loading time; and the other is the change of speed due to vehicle acceleration so that the longitudinal TPCP is changed as well. However, only the latter scenario is discussed in this work. The former scenario involves loading time and dynamic modulus, and is beyond the scope of this study.
Via observations and field measurements, the speed of a heavy truck with rated loading can be as low as 10 km/h on the top of an upgrade slope (with a gradient of 6%). Additionally, the acceleration of the vehicle changes with speed, and 1.5 m/s2 is considered the maximum for the first acceleration from 10 km/h to 20 km/h. As for the deceleration based on the Chinese industrial criterion for heavy trucks [20], the distance to apply brakes must be less than or equal to 12 m for a speed of 30 km/h. Based on this, 1.5 m/s2 acceleration and 1.5 m/s2 and 3.0 m/s2 deceleration were assumed in this study. The No.1 loading combination in Table 1 and the two structures in Table 2 were used to compute the stresses and strains. The lateral TPCP was taken as 15% of the vertical contact pressure. The results are listed in Table 5.
Based on the results in Table 5, the following deductions can be made:
1) Acceleration or deceleration hardly influences the ��t,s,X, ��t,b,X, ��t,b,Y, ��s,s,XZ and ��s,b,XZ in both structures, and neither is the ��s,b,YZ in structure A.
Table 5 Computed results under acceleration/deceleration
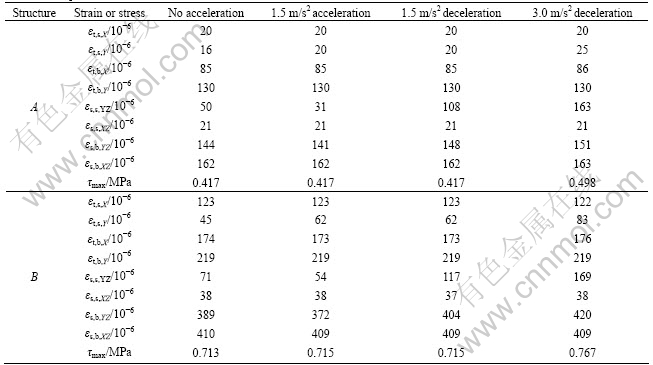
2) Although the acceleration influences ��t,s,Y and ��s,s,YZ in both structures and ��s,b,YZ in structure B, all the computed strain values are relatively smaller in magnitude. Additionally, acceleration does not appear to influence ��max in both structures A and B, that is, the influence of the acceleration on the mechanistic responses can be neglected. Therefore, one of the main causes of severe rutting and/or shoving at the top of upgrade slopes is attributed to the poor resistance of AC to deformation/ rutting due to longer loading time. This problem is potentially exacerbated at elevated temperatures, particularly in summer.
3) Different from the acceleration, deceleration caused dramatic changes in ��s,s,YZ in both structures, even at the 1.5 m/s2 deceleration rate, which has the same magnitude as the acceleration rate. And, when the deceleration rate increases, i.e., doubles to 3.0 m/s2, the induced ��s,s,YZ is substantially higher in magnitude in both structures. Compared with zero acceleration/deceleration, there is an increase of about 19.4% (structure A) and 7.6% (structure B) in ��max when the deceleration rate increases to 3.0 m/s2. Thus, based on these results, both longer loading time duration and changes in the horizontal TPCP due to vehicle deceleration aggravate rutting and shoving problems in the surfacing AC layer at highway intersections.
4 Summary and conclusions
1) Controlling the tensile strains at the bottom of AC layer as the design criteria to mitigate bottom-up initiated cracking is critical, particularly when the base layer modulus is relatively lower in magnitude (e.g. ��400 MPa) compared with the surfacing AC modulus. Furthermore, only the vertical TPCP has considerable influence. However, when the base layer modulus is relatively higher in magnitude (e.g. ��7 000 MPa), the tensile strains in the X-direction at the surface of the AC layer and the horizontal TPCP (particularly at higher lateral TPCP values) should also be considered as a integral part of the design strain criteria.
2) Like overloading, over inflated tire pressure is detrimental to pavements even when the wheel loads are at or lower than the rated loading. On this basis, the findings of this study suggests that the definition of ��overloading�� needs to be revised to include tire pressure over-inflation, i.e., a vehicle should be considered to be overloaded if the wheel load exceeds the specification and/or the tire inflation pressure is higher than the specification. This will ultimately aid in mitigating pavement distresses that are related to high traffic loading.
3) When overloaded and/or over inflated, a light truck (e.g. ��30 kN on the rear axle) should be given more recognition in the structural design and analysis particularly when the thickness of the AC layer is relatively thin (e.g. ��50 mm).
4) The acceleration of a vehicle contributes negligibly to the permanent deformation and rutting in the surfacing AC layer on the top of upgrade slopes and highway intersections. By contrast, the deceleration of a vehicle can dramatically induce horizontal shear strains and consequently, aggravate rutting and shoving problems at highway intersections. Evidently, these factors should be taken into account during stress-strain modeling and structural design of asphalt pavements.
Overall, this analytical study has demonstrated the need to be cautious when selecting and utilizing strains as the mechanistic response and structural design criteria for asphalt pavements. Consideration of the pavement structure, materials, and the expected loading conditions (including vehicle speed) must always be given due to the cognizance when selecting the appropriate structural design criteria. Additionally, 3D stress-strain modeling should also be considered as a fundamental component of pavement structural design and analysis. During stress-strain modeling and pavement structural design, the highway geometrical characteristics such as intersections and slopes should be equally considered, which may be too vulnerable to the effects of vehicle deceleration.
References
[1] YOO P J, AL-QADI I L, ELSEIFI M A, JANAJREH I. Flexible pavement responses to different loading amplitudes considering layer interface conditions and lateral shear forces [J]. International Journal of Pavement Engineering, 2006, 7(1): 73-86.
[2] HUANG Y H. Pavement analysis and design [M]. Englewood Cliffs, NJ: Prentice Hall Inc, 1993: 158-162.
[3] MYERS L A, ROQUE R B, RUTH E. Measurement of contact stresses for different truck tire types to evaluate their influence on near-surface cracking and rutting [J]. Journal of the Transportation Research Board, 1999(1320): 175-184.
[4] HU Xiao-di. Measuring distribution of tire ground pressure and stress response analysis of asphalt pavement using those results [D]. Shanghai: Tongji University, 2003. (in Chinese)
[5] SIDDHARTHAN R V, KRISHNAMENON N, El-MOUSLY M, SEBAALY P E. Investigation of tire contact stress distributions on pavement response [J]. Journal of Transportation Engineering, 2002, 28: 136-144.
[6] de BEER M, FISHER C, JOOSTE F J. Determination of pneumatic tyre/pavement interface contact stresses under moving loads and some effects on pavements with thin asphalt surfacing layers [C]// Proceedings of the Eighth International Conference on Asphalt Pavements. Seattle, WA, 1996: 179-227.
[7] AL-QADI I L, YOO P J. Effect of surface tangential contact stress on flexible pavement response [J]. Journal of the Association of Asphalt Paving Technologists, 2007, 76: 558-582.
[8] AL-QADI I L, LOULIZI A, ELSEIFI M A, LAHOUAR S. The Virginia smart road: The impact of pavement instrumentation on understanding pavement performance [J]. Journal of the Association of Asphalt Paving Technologists, 2004, 73: 427-466.
[9] SOON S C, DRESCHER A, STOLARSKI H. Tire-induced surface stresses in flexible pavements [J]. Journal of Transportation Research Record, 2003(1896): 170-176.
[10] ANSYS 9.0 USER MANUAL [Z]. Canonsburg, PA: Ansys Inc, 2004.
[11] HU X D, WALUBITA L F. Modeling tensile strain response in asphalt pavements: Bottom-up and/or top-down fatigue crack initiation [J]. Journal of Road Materials and Pavement Design, 2008, 10(1): 125-154.
[12] WANG F, MACHEMEHL R B. Mechanistic�Cempirical study of effects of truck tire pressure on pavement [J]. Journal of the Transportation Research Board, 2006(1947): 136-145.
[13] HU X D, ZHOU F J, SCULLION T, WALUBITA L F. Proposed loading wave forms and loading time equations for m-e pavement design and analysis [J]. Journal of Transportation Research Board, 2009: CD-ROM.
[14] ZHUANG Ji-de. Technical of automobile tires [M]. Beijing: Press of Beijing Institute of Technology, 1996. (in Chinese)
[15] HUHTALA M, PIHLAJAMAKI J, PIENIMAKI M. Effects of tires and tire pressures on road pavements [J]. Journal of the Transportation Research Board, 1989(1227): 107-114.
[16] SUN Li-jun, HU Xiao-di, and BI Yu-feng. Top-down cracking analysis and control for asphalt pavements [C]// 10th International Conference on Asphalt Pavement. Qu��bec, Canada. 2006, CD-ROM.
[17] WALUBITA L F, SCULLION S. Perpetual pavements in Texas: The fort worth SH 114 perpetual pavement in wise county [R]. Technical Report FHWA/TX-05/0-4822-2, TTI, TX, US, 2007.
[18] HUANG Wen-yuan. The primary research of equivalent factor of overloaded axle on asphalt pavement [J]. Journal of Highway and Transportation Research and Development, 2000, 25(1): 151-156. (in Chinese)
[19] WANG F, INMAM R F, MACHEMEHL R B, ZHANG Z, WALTON C M. A survey study of current pavement-related truck characteristics in Texas [C]// Proc 30th Annual Canadian Society of Civil Engineering Conference. Montreal, Quebec, Canada, 2002, CD-ROM
[20] The detection specification for apply the brake of China [S]. China Communication Press, 1980: 35-37. (in Chinese)
Received date: 2010-01-07; Accepted date: 2010-04-30
Corresponding author: HU Xiao-di, Research Assistant, PhD; Tel: +1-979-8624932; E-mail: huxiaodi625@hotmail.com
