
J. Cent. South Univ. Technol. (2011) 18: 2192-2200
DOI: 10.1007/s11771-011-0962-5![]()
Degradation behavior of aggregate skeleton in stone matrix asphalt mixture
MA Tao(����), WANG Zhen(����), ZHAO Yong-li(������)
School of Transportation, Southeast University, Nanjing 210096, China
? Central South University Press and Springer-Verlag Berlin Heidelberg 2011
Abstract:
The degradation behavior of aggregate skeleton in stone matrix asphalt mixture was investigated based on theoretical analysis, laboratory test and field materials evaluation. A stress-transfer model was established to provide the fundamental understanding of the stress distribution and degradation mechanism of stone matrix asphalt (SMA) aggregate skeleton. Based on the theoretical analysis, crushing test and superpave gyratory compactor (SGC) test were used to evaluate the degradation behavior of aggregate skeleton of SMA. To verify the laboratory test results, gradation analysis was also conducted for the field materials extracted from SMA pavements after long-time service. The results indicate that the degradation of SMA aggregate skeleton is not random but has fixed internal trend and mechanism. Special rule is found for the graded fine aggregates generated from coarse aggregate breakdown and the variation of 4.75 mm aggregate is found to play a key role in the graded aggregates to form well-balanced skeleton to bear external loading. The variation of 4.75 mm aggregate together with the breakdown ratio of aggregate gradation can be used to characterize the degradation behavior of aggregate skeleton. The crushing test and SGC test are proved to be promising in estimating the degradation behavior of SMA skeleton.
Key words:
stone matrix asphalt; aggregate; gradation; skeleton; degradation��
1 Introduction
Stone matrix asphalt (SMA) has become more and more popular around the world due to its ability of withstanding heavy traffic without appreciable rutting and its lower maintenance costs than traditional hot asphalt mixture [1-2]. SMA consists of two components: a coarse aggregate skeleton providing the strength for mixture by stone-on-stone contact and a high binder content mortar adding durability of the asphalt mixtures [3-4]. Since the strength of SMA relies heavily on the stone-on-stone aggregate skeleton, it is imperative that the mixture should be designed with a strong aggregate skeleton. Traditionally, the SMA gradation specifications have been used to help to ensure an adequate aggregate skeleton during mixture compaction [5-7]. Different methodologies to evaluate the aggregate structure in SMA mixtures have been developed by numerous studies [8-10], most of which focused on measuring stone-on- stone contact in an SMA specimen by analyzing the voids between the coarse aggregates of the mixtures. Some of these studies incorporated imaging technology to measure aggregate properties and aggregate contact in SMA mixtures [11-13].
However, it is still inevitable for the aggregate skeleton of SMA to deteriorate due to long-term fatigue effect of the repeated vehicle loading applications on pavements, particularly under heavy traffic and high tire pressure [14-15]. The degradation of aggregate skeleton during service life of pavements can alter the original design and lead to severe distresses. Therefore, it is important to determine the degradation propensity of aggregate skeleton of SMA during life-time service.
With some early-built SMA pavements reaching the end of service life, recycling of SMA has gained more and more attention. Since the aggregate skeleton is imperative for SMA to perform, to properly maintain and/or recycle the SMA, an urgent need is required to characterize the degradation behavior of aggregate skeleton of SMA.
The main objectives of this work are to provide fundamental understanding of degradation mechanisms and tendency of aggregate skeleton of SMA, and to verify the practicality of using laboratory tests to characterize the degradation behavior of aggregate skeleton of SMA.
2 Experimental
2.1 Materials
Single-size aggregates with different sizes, 2.36, 4.75, 9.5, 12.5, 16 and 19 mm, were selected for use. Aggregate mixes with different composition proportions were prepared based on the selected single-size aggregates. Field materials were also extracted from different SMA pavements after long-time service for use.
2.2 Testing procedures
Crushing test was mainly used to investigate the degradation propensity of aggregate. For each sample, 3 kg aggregate mix was prepared according to designed composition proportion and crushed under designed pressure. Superpave gyratory compactor was mainly used to investigate the degradation behavior of aggregate skeleton. For each sample, 5 kg aggregate mix was prepared according to design gradation and compacted by designed gyrations. Gradation analysis was conducted to the crushed and/or compacted aggregate mixes, as well as materials extracted from SMA pavements to evaluate the degradation characterization of SMA aggregate skeleton.
3 Results and discussion
3.1 Analysis of stress transfer in SMA skeleton
3.1.1 Stone-on-stone contacting model
Figure 1 shows a typical schematic diagram for the aggregate skeleton of SMA mixture. Clearly, the internal stress in aggregate skeleton is transferred through the contacting points between aggregates. On a crossing section, the contacting area of aggregates is much smaller than the total area of the cross section. Therefore, a small load on the crossing section may cause a high concentrated stress at the contacting point which may cause breakdown of aggregate by exceeding its strength limit. To simplify the analysis of stress transfer between aggregates in the skeleton, aggregates are assumed to be spherical and distribute uniformly around each other. Figure 2 shows an ideal three-dimensional stone-on- stone contacting model, in which the d-size aggregates distribute uniformly around the D-size aggregate. Both D and d are diameters of aggregates.
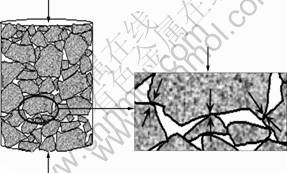
Fig.1 Schematic diagram of aggregate skeleton of SMA mixture
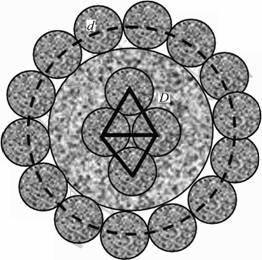
Fig.2 Three-dimensional stone-on-stone contacting model
The dashed line shown in Fig.2 forms a virtual sphere which has the same center with the D-size aggregate. The diameter of this virtual sphere is the sum of D and d. The surface of the virtual sphere passes through the centers of all the d-size aggregates. Meanwhile, as shown by the bold solid lines, an equilateral triangle with side length of d is formed by connecting the centers of the three contacting d-size aggregates. All the equilateral triangles together can form a polyhedron which has a similar surface area with the virtual sphere. Assuming that the polyhedron has the same surface area with the virtual sphere, the number of the d-size aggregate can be calculated. As the number of contacting point between d-size and D-size aggregate equals the number of d-size aggregates, the stress at the contacting point generated by the pressure on the D-size aggregate can be calculated as follows.
The virtual sphere surface S and the equilateral triangle surface s are calculated by
![]() (1)
(1)
![]() (2)
(2)
Each triangle connects three d-size aggregates. Meanwhile, each d-size aggregate is involved in six triangles. Therefore, the number of the d-size aggregates on the virtual sphere can be calculated by
![]() (3)
(3)
As the stress, defined as q, on the crossing section of D-size aggregate is transferred by the contacting point to the d-size aggregates, the contacting stress, defined as p, at each contacting point between the d-size aggregate and D-size aggregate can be calculated by
![]() (4)
(4)
Defining equivalent diameter as ![]() Eq.(4)
Eq.(4)
becomes
![]() (5)
(5)
When D equals d, defining D=d��D0, Eq.(5) is switched to
![]() (6)
(6)
Equations (5) and (6) indicate that the stress p at the contacting point of aggregates is proportional to both the square of the equivalent diameter D* and the overall stress q on the whole aggregate system. The relationship between p and the aggregate size can be calculated, as shown in Fig.3. Figures 3(a), (b) and (c) show the relationship between p and D0, the relationship between p and d when D equals 19 mm, and the relationship between p and D while d equals 0.3 mm, respectively. Two important findings are indicated by Fig.3. First, it is clearly shown that the contacting stress p between aggregates decreases with decreasing the aggregate size in the aggregate system. The other important finding is that the turning points for the three curves all locate at the same point with the aggregate sieving size of 4.75 mm. This means that the coarser the aggregate is, the higher the stress concentrates at the contacting points in the aggregate system. The fine aggregate smaller than 4.75 mm has higher stress-transfer efficiency than the coarse aggregate bigger than 4.75 mm.
3.1.2 Experimental verification
The aggregate will break down when the contacting stress between aggregates exceeds the compressive strength of aggregate. Therefore, the breakdown ratio of aggregate, defined as the mass loss percent of the original aggregate, is certainly related to the contacting stress which is influenced by the aggregate size and the overall pressure on the aggregate based on the previous analysis. Consequently, the breakdown ratio of aggregate will be affected by both the overall pressure on aggregate and the aggregate size.
To verify the relationship between aggregate breakdown and overall pressure on aggregate system, crushing tests with different pressures including 50, 100, 150, 200, 250 and 400 kN were conducted to 19 mm single-size aggregate specimens. The relationship between breakdown ratio of aggregate and pressure is shown in Fig.4(a). To verify the relationship between aggregate breakdown and aggregate size, crushing tests with pressure of 400 kN were conducted to different single-size aggregate specimens such as 2.36, 4.75, 9.5, 13.2, 16 and 19 mm aggregate, respectively. According to Eq.(6), single-size aggregate mix means D=d=D0, therefore, the relationship between the breakdown ratio of aggregate and the square of D* or D0 is shown in Fig.4(b). Furthermore, 19 mm aggregate was selected as D-size aggregate and mixed with 16, 9.5 or 4.75 mm aggregate, which was considered as d-size aggregate, separately to get different aggregate mixes consisting of two different sizes of aggregates, such as 19-16 mm, 19- 9.5 mm and 19-4.75 mm aggregate mixes, respectively. According to Eq.(5), in these aggregate mix specimens D=19 mm while d changes from 16 mm to 4.75 mm, therefore, the relationship between aggregate breakdown ratio by crushing test and the square of D* or d is shown in Fig.4(c).
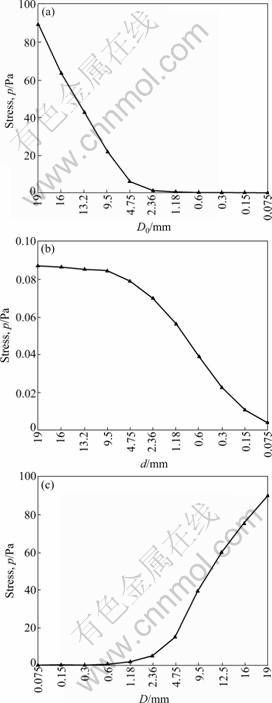
Fig.3 Relationships between stress p and aggregate size: (a) D= d=D0; (b) D=19 mm; (c) d=0.3 mm
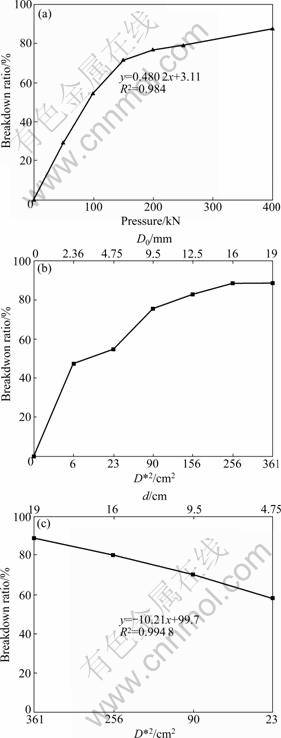
Fig.4 Relationships between breakdown ratio and pressure or aggregate size: (a) D=d=D0 =19 mm; (b) D=d=D0; (c) D= 19 mm
Figure 4(a) indicates that the breakdown ratio of aggregate has an approximately linear relationship with the pressure on aggregate when the pressure is less than 200 kN. This verifies the linear relationship between the contacting stress p of aggregates and the overall pressure q on the aggregate system shown in Eqs.(5) and (6). After the pressure exceeds 200 kN, the breakdown ratio of aggregate changes slowly with the increase of pressure. This is because the pressure already exceeds the compressive strength limit of the whole aggregate system. Figures 4(b) and (c) indicate that the breakdown ratio decreases with decreasing the aggregate size in the aggregate system and a turning point shows up at 4.75 mm in Fig.4(b). This verifies the relationship between contacting stress p of aggregates and the overall pressure on aggregate system shown by Eqs.(5) and (6) as well as in Fig.3.
Therefore, the stone-on-stone contacting model for the aggregate system is validated. The coarse aggregate larger than 4.75 mm mainly provides strength to form skeleton to bear the overall pressure on the aggregate system, while the fine aggregate smaller than 4.75 mm mainly provides contacting points to transfer stress within the aggregate system. 4.75 mm is the demarcation point between coarse and fine aggregates.
3.2 Degradation analysis of SMA skeleton
3.2.1 Degradation analysis of aggregate
To evaluate the degradation behavior of aggregate, single-size aggregate specimens with different sizes of 2.36, 4.75, 9.5, 13.2, 16 and 19 mm were tested by crushing tests, respectively. The gradation analysis results for the crushed aggregate mix of different sing-size aggregate specimens are shown in Fig.5.
Two important characteristics are indicated by Fig.5. First, all of the original aggregates break into graded aggregates as shown in Figs.5(a) and (b). Although the breakdown ratios of different original aggregates are different, all the gradation curves have similar shape and trend, especially for the fine aggregate parts smaller than 9.5 mm. To further analyze this characteristic, the fine aggregates smaller than 9.5 mm were separated to conduct the gradation analysis again. As shown in Fig.5(c), the passing ratio has a linear relationship with the sieve size for the separated fine aggregates. And the relationship curves for different original aggregates are very similar to each other. The second characteristic is that all of the gradation curves for different original aggregates show peak values at the same point of 4.75 mm, as indicated in Fig.5(b).
3.2.2 Degradation analysis of aggregate mix
To further verify the previous analysis of aggregate degradation, three different aggregate mix specimens consisting of 4.75, 9.5, 13.2 and 16 mm aggregates were prepared. The compositions for three aggregate mix specimens are listed in Table 1.
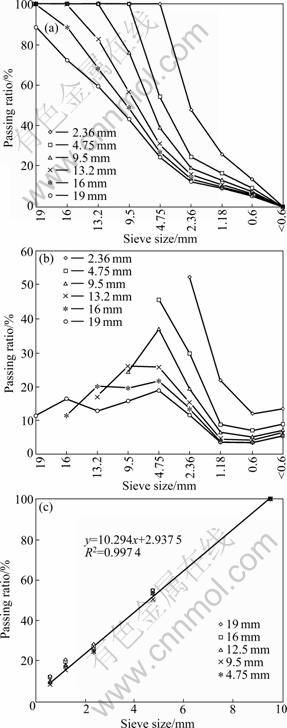
Fig.5 Gradation analysis results for aggregate with different sizes by crushing tests: (a) Passing ratio for different sieve sizes; (b) Retained ratio for different sieve sizes; (c) Relationship between passing ratio and sieve size for separated fine aggregates
Table 1 Composition for three aggregate mixes
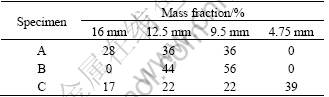
Crushing tests were conducted to the three aggregate mix specimens. The gradation analysis results for crushed aggregate mixes are shown in Fig.6. It is clearly indicated that, although the three specimens A, B and C have significantly different original compositions as shown in Table 1, they all break into aggregate mixes with much similar gradation, especially for the fine aggregate parts smaller than 9.5 mm, as shown in Figs.6(a) and (b). The fine aggregate parts smaller than 9.5 mm were separated from the crushed aggregate mixes to conduct the gradation analysis again. As shown in Fig.6(c), the passing ratio has a linear relationship with the sieve size for the separated fine aggregates and the relationship curves for different original aggregate mix specimens are very similar to each other. Meanwhile, all the crushed gradation curves for the three aggregate mix specimens show peak values at the same point of 4.75 mm.
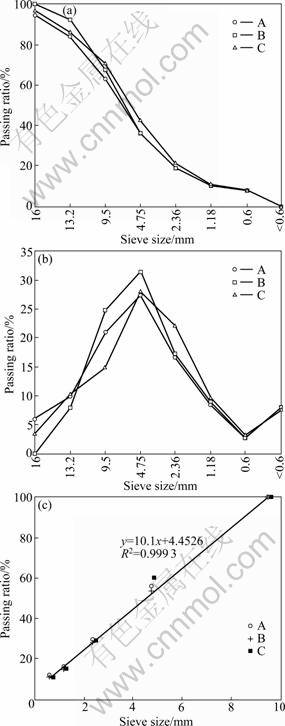
Fig.6 Gradation analysis results for aggregate mix specimens by crushing tests: (a) Passing ratio for different sieve sizes; (b) Retained ratio for different sieve sizes; (c) Relationship between passing ratio and sieve size for separated fine aggregates
Thus, the degradation behavior of aggregate mix confirms the degradation behavior of single-size aggregate in the previous analysis. And the degradation behavior of aggregate also well validates the previous stone-on-stone contacting model. It can be concluded that the breakdown of aggregate under pressure is not random. The coarse aggregate tends to break into graded fine aggregates following fixed internal trend to generate enough contacting points between aggregates to distribute concentrated stress in aggregate system and finally to form a well-balanced aggregate skeleton to bear the external pressure. The 4.75 mm aggregate usually having the highest content in the aggregate gradation can provide certain strength as well as certain contacting points for the aggregate skeleton, therefore, is the key controlling point of the aggregate skeleton.
3.2.3 Degradation analysis of SMA gradation
To analyze the degradation behavior of SMA gradation, two aggregate mixtures of SMA13 were prepared according to the coarser limit gradation and the median gradation in the gradation design specification, respectively. The specimens were compacted using superpave gyratory compactor (SGC) at different gyrations. Based on the previous analysis, two parameters, the variation of 4.75 mm aggregate and the breakdown ratio of gradation, were introduced to characterize the gradation degradation. The variation of 4.75 mm aggregate is defined as the change of the retained ratio of 4.75 mm aggregate from the original gradation to the after-compaction gradation. The breakdown ratio of gradation is defined as the total change of the retained ratio of all the aggregate sizes in the gradation from the original gradation to the after-compaction gradation. Figure 7 shows the gradation analysis results for SGC tests. Figure 7(a) shows the gradation limits for SMA13 gradation design. Figures 7(b) and (c) show the original gradation and the after- compaction gradation compacted by SGC for 200 gyrations for the aggregate mix specimen with coarser limit gradation and the aggregate mix specimen with median gradation, respectively. Figures 7(d) and (e) show the variation of 4.75 mm aggregate and the breakdown ratio of gradation at different SGC gyrations for the aggregate mix specimen with coarser limit gradation and the aggregate mix specimen with median gradation, respectively.
From Fig.7(a), it can be seen that the designed SMA gradation is composed of graded aggregates and the 4.75 mm aggregate has the highest content. Furthermore, the SMA gradation curves have similar shape and trend with the crushed gradation curves for the single-size aggregate and the aggregate mix shown in Fig.5(b) and Fig.6(b). The objective of gradation design of SMA is to provide stable skeleton structure based on reasonable compositions of aggregate with different sizes to distribute concentrated stress in aggregate system to bear external loading. Therefore, this proves again the validity of the previous stone-on-stone contacting model and the degradation behavior analysis of aggregate.
From Figs.7(b) and (c), it is clearly indicated that the after-compaction gradation is finer than the original gradation. The retained ratios of coarse aggregates become lower while the retained ratios of fine aggregates become higher after compaction by SGC. Especially, the content of 4.75 mm aggregate has significant increase. Compared with the design gradation curves in Fig.7(a), it is observed that the after-compaction gradation for the specimen with coarser limit design gradation, as shown in Fig.7(b), moves towards to and is very similar to the median design gradation, and the after-compaction gradation for the specimen with median design gradation, as shown in Fig.7(c), moves towards to and is very similar to the finer limit design gradation. Therefore, the repeated loading causes coarse aggregate to break into graded fine aggregate to generate enough contacting points to distribute the concentrated stress in SMA skeleton. However, the degradation behavior of SMA gradation is not random but follows fixed internal trend or disciplines, similar to the degradation behavior of single-size aggregate, to keep reasonable aggregate skeleton to bear external loading.
Figures 7(d) and (e) show that the variation of 4.75 mm aggregate and the breakdown ratio of gradation are closely related to the compacting gyrations of SGC. Both the variation of 4.75 mm aggregate and the breakdown ratio increase almost linearly with increasing the gyrations. It is also clearly indicated that the specimen with median design gradation has lower variation of 4.75 mm aggregate and breakdown ratio of gradation than the specimen with coarser limit design gradation. It is understandable based on the stone-on- stone contacting model. Since the 4.75 mm aggregate is the demarcation point between coarse aggregate and fine aggregate and can provide certain strength as well as certain contacting points in aggregate skeleton, the coarse aggregates tend to break into 4.75 mm aggregate first and then fine graded aggregates with increasing the repeated loadings. The coarser gradation has less contacting points between aggregates than the median gradation, therefore, more coarse aggregates in the coarser gradation will break into fine graded aggregates, especially 4.75 mm aggregates, to generate more contacting points to distribute the concentrated stress in aggregate skeleton.
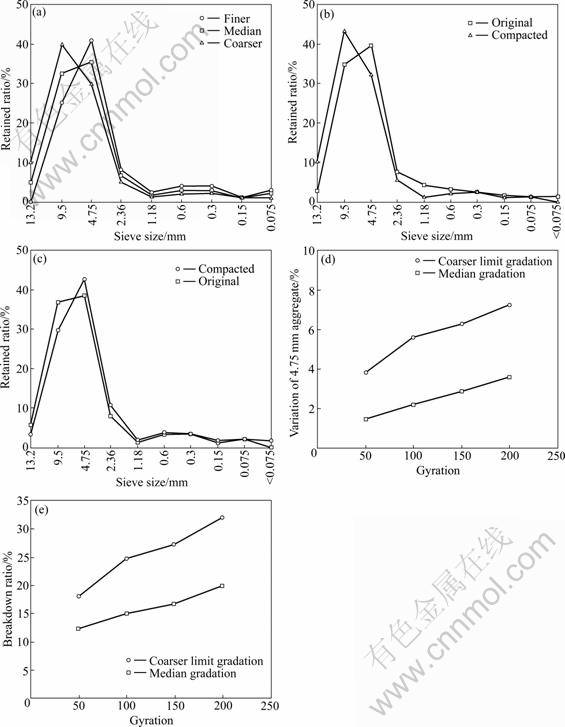
Fig.7 Gradation analysis results for SMA aggregate mixtures compacted by SGC: (a) Grading limits for SMA13 gradation design; (b) SMA13 with coarser limit gradation; (c) SMA 13 with median gradation; (d) Variation of 4.75 mm aggregate; (e) Breakdown ratio of gradation
3.2.4 Degradation evaluation of field SMA
To further verify the degradation behavior of SMA skeleton due to long-term vehicle loading effect, field SMA13 materials were extracted from three expressway pavements already used for 3, 5 and 8 a, respectively. The gradation analysis results are shown in Fig.8.
As shown in Figs.8(a), (b) and (c), it is clearly indicated that the materials from traffic lane have finer gradation than those from non-traffic lane. The degradation behavior of field SMA materials is very similar to the SMA aggregate mix in the SGC tests. The retained ratios of coarse aggregate decrease while the retained ratios of fine aggregate increase. Especially, the content of 4.75 mm aggregate has significant increase. Therefore, the variation of 4.75 mm aggregate and the breakdown ratio of gradation can still be used to characterize the degradation of field SMA materials. As shown in Figs.8(d) and (e), both the breakdown ratio and the variation of 4.75 mm aggregate increase with the increasing service lives of pavements. This means that the SMA skeleton deteriorates gradually following specific internal rule due to the external repeated loading. Therefore, the testing results of field materials confirm the degradation behavior analysis results of laboratory testes.
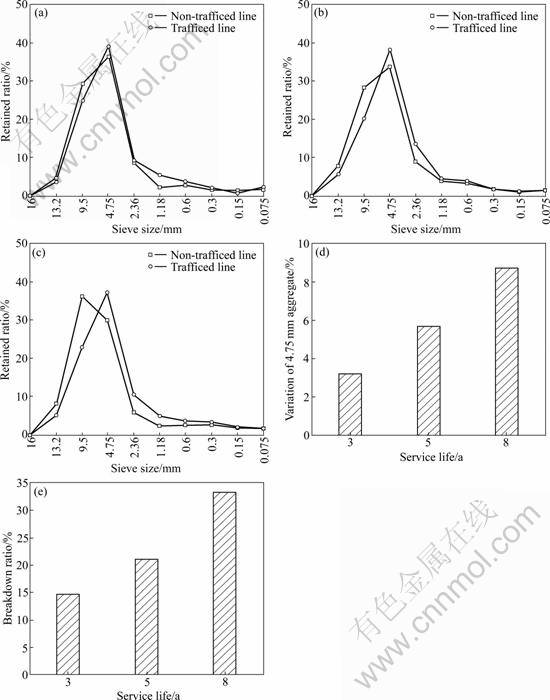
Fig.8 Gradation analysis results for field SMA materials: (a) From three-year pavement; (b) From five-year pavement; (c) From eight- year pavement; (d) Variation of 4.75 mm aggregate; (e) Breakdown ratio of gradation
4 Conclusions
1) A stone-on-stone contacting model is established and validated with limited number of tests to provide a fundamental understanding of the stress distribution in SMA skeleton which is the key cause for the degradation of aggregate and skeleton of SMA. Based on theoretical and experimental analysis, 4.75 mm aggregate is proved to be the demarcation point between coarse aggregate and fine aggregate.
2) The degradation behavior of SMA skeleton due to repeated vehicle loading is not random but from coarse to fine gradually, which can be indicated by decreasing retained ratio of coarse aggregate and increasing retained ratio of fine aggregate especially the increasing content of 4.75 mm aggregate. During the degradation process of SMA skeleton, to keep the whole skeleton stable, the compositions of the generated fine aggregate follow fixed specific internal rule, which can be indicated by a linear relationship between the passing ratio and the sieving size for the generated fine aggregates.
3) The superpave gyratory compactor test is proved to be easy-doing and promising in capturing the degradation of SMA aggregate skeleton. And the variation of 4.75 mm aggregate and breakdown ratio of gradation can quantitatively depict the degradation behavior of SMA skeleton.
4) More work is needed to conduct further testing to verify the relationship between the degradation effect of laboratory procedure and degradation effect of field vehicle loading. And more influence factors for degradation behavior of aggregate skeleton in stone matrix asphalt mixture, such as strength and shape of aggregate, will be considered in the future study.
References
[1] YE Qun-shan, WU Shao-peng, CHEN Zheng, LIU Zhi-fei. Rheological properties of asphalt mixtures containing various fibers [J]. Journal of Central South University of Technology, 2008, 15(s1): 333-336.
[2] IBRAHIM M A. Laboratory comparison study for the use of stone matrix asphalt in hot weather climates [J].Construction and Building Materials, 2006(20): 982-989.
[3] WU Shao-peng, XUE Yong-jie, YE Qun-shan, CHEN Yong-chun. Utilization of steel slag as aggregates for stone mastic asphalt (SMA) mixtures [J]. Building and Environment, 2007, 42: 2580-2585.
[4] FAN Xiao-hui, GAN Min, JIANG Tao, YUAN Li-shun, CHEN Xu-ling. Influence of flux additives on iron ore oxidized pellets [J]. Journal of Central South University of Technology, 2008, 15(s1): 732-737.
[5] BROWN E R, HADDOCK J E, MALLICK R B, LYNN T A. Development of a mixture design procedure for stone matrix asphalt (SMA) [R]. NCAT Report No. 97-3. National Center for Asphalt Technology, 1997.
[6] BROWN E R, MALLICK R B. Stone matrix asphalt-properties related to mixture design [R]. NCAT Report No. 94-2. National Center for Asphalt Technology, Auburn University, 1994.
[7] BROWN E R, JOHNE H, CAMPBELL C. Investigation of stone matrix asphalt mortars [J]. Journal of the Transportation Research Record, 1996, 1530: 95-102.
[8] XIE H, WASTON D E. Determining air voids content of compacted stone matrix asphalt mixtures [J]. Journal of the Transportation Research Record, 2004, 1891: 203-211.
[9] WASTON D E, MASAD E, MOORE K A, WILLIAMS K, COOLEY L A. Verification of voids in coarse aggregate testing: Determining stone-on-stone contact of hot-mix asphalt mixtures [J]. Journal of the Transportation Research Board, 2004, 1891: 182-190.
[10] BROWN E R, HADDOCK J E. Method to ensure stone-on-stone contact in stone matrix asphalt paving mixtures [J]. Journal of the Transportation Research Board, 1997, 1583: 11-18.
[11] LYNN T A. Evaluations of aggregate size characters in stone matrix asphalt (SMA) and superpave design mixtures [M]. Auburn: Auburn University, 2002.
[12] MASAD E. X-ray computed tomography of aggregates and asphalt mixes [J]. Materials Evaluations Journal, 2004, 62: 775-783.
[13] DENNIS G, MASAD E, CHOWDHURY A, DALLAS L. Characterization of aggregate resistance to degradation in stone matrix asphalt mixtures [J]. Journal of the Transportation Research Record, 2006, 1982: 55-63.
[14] PERVIZ A, BURAK S. Evaluation of steel slag coarse aggregate in hot mix asphalt concrete [J]. Journal of Hazardous Materials, 2009, 165: 300-305.
[15] YANG Sheng-feng, YANG Xin-hua, CHEN Chuan-yao. Simulation of rheological behavior of asphalt mixture with lattice model [J]. Journal of Central South University of Technology, 2008, 15(s1): 155-157.
(Edited by YANG Bing)
Foundation item: Project(51008075) supported by the National Natural Science Foundation of China; Project(2006AA11Z110) supported by the National High Technology Research and Development Program of China
Received date: 2010-10-27; Accepted date: 2011-04-10
Corresponding author: MA Tao, PhD; Tel: +86-25-83791654; E-mail: mataoseu@163.com
Abstract: The degradation behavior of aggregate skeleton in stone matrix asphalt mixture was investigated based on theoretical analysis, laboratory test and field materials evaluation. A stress-transfer model was established to provide the fundamental understanding of the stress distribution and degradation mechanism of stone matrix asphalt (SMA) aggregate skeleton. Based on the theoretical analysis, crushing test and superpave gyratory compactor (SGC) test were used to evaluate the degradation behavior of aggregate skeleton of SMA. To verify the laboratory test results, gradation analysis was also conducted for the field materials extracted from SMA pavements after long-time service. The results indicate that the degradation of SMA aggregate skeleton is not random but has fixed internal trend and mechanism. Special rule is found for the graded fine aggregates generated from coarse aggregate breakdown and the variation of 4.75 mm aggregate is found to play a key role in the graded aggregates to form well-balanced skeleton to bear external loading. The variation of 4.75 mm aggregate together with the breakdown ratio of aggregate gradation can be used to characterize the degradation behavior of aggregate skeleton. The crushing test and SGC test are proved to be promising in estimating the degradation behavior of SMA skeleton.
