
Trans. Nonferrous Met. Soc. China 29(2019) 2546-2555
Preparation of micro/nano-structured ceramic coatings on Ti6Al4V alloy by plasma electrolytic oxidation process
Da-jun ZHAI1,2,3, Ke-qin FENG1
1. School of Mechanical Engineering, Sichuan University, Chengdu 610065, China;
2. Department of Materials Engineering, Sichuan Engineering Technical College, Deyang 618000, China;
3. Sichuan Laboratory of Engineering Aeronautical Materials Inspection and Die-forging Technology, Deyang 618000, China
Received 17 March 2019; accepted 6 November 2019
Abstract:
In order to improve the osseointegration and antibacterial activity of titanium alloys, micro/nano-structured ceramic coatings doped with antibacterial element F were prepared by plasma electrolytic oxidation (PEO) process on Ti6Al4V alloy in NaF electrolyte. The influence of NaF concentration (0.15-0.50 mol/L) on the PEO process, microstructure, phase composition, corrosion resistance and thickness of the coatings was investigated using scanning/transmission electron microscopy, energy dispersive spectroscopy, atomic force microscopy, X-ray diffractometer, and potentiodynamic polarization. The results demonstrated that Ti6Al4V alloy had low PEO voltage (less than 200 V) in NaF electrolyte, which decreased further as the NaF concentration increased. A micro/nano-structured coating with 10-15 ��m pits and 200-800 nm pores was formed in NaF electrolyte; the morphology was different from the typical pancake structure obtained with other electrolytes. The coating formed in NaF electrolyte had low surface roughness and was thin (<4 ��m). The NaF concentration had a small effect on the phase transition from metastable anatase phase to stable rutile phase, but greatly affected the corrosion resistance. In general, as the NaF concentration increased, the surface roughness, phase (anatase and rutile) contents, corrosion resistance, and thickness of the coating first increased and then decreased, reaching the maximum values at 0.25 mol/L NaF.
Key words:
plasma electrolytic oxidation; Ti6Al4V alloy; micro/nano structure; NaF; surface modification;
1 Introduction
Ti and its alloys, unlike bioactive ceramics, bioglass, hydroxyapatite (HA), or glass ceramics, cannot directly bind to bone due to their poor osseointegration and bone induction properties [1,2]. Surface modification is an effective way to improve the biological properties of Ti implants [3-5]. Plasma electrolytic oxidation (PEO) is an electrochemical anodizing process that employs a higher potential and discharge. PEO porous coatings can improve the mechanical connection between implants and cells, increase the surface roughness of samples, and provide a larger area for initial adhesion and osteoblasts diffusion [6].
WEBSTER and EJIOFOR [7] found that coating Ti or its alloy surface with nano particles (<1 ��m) significantly promoted osteoblast adhesion. ESTRIN et al [8] found that the proliferation rate of osteoblast- like cells increased by 20-fold when the average grain size of a pure Ti surface decreased from 4.5 to 200 nm. BRAMMER et al [9] found that 30-nm long nanotubes greatly promoted cell adhesion, but were not conducive to cell differentiation; in contrast, nanotubes with lengths of 70-100 nm significantly promoted the formation of alkaline phosphatase but did not improve cell proliferation to such an extent. On the other hand, some researchers have noted that the micro-scale surface structure is conducive to the adhesion and reproduction of bone cells, the promotion of bone growth and bone conduction, and the formation of mechanical bonds with surrounding bone tissue [10-12]. Therefore, the PEO coating of Ti alloys to form a micro-nano structure has become a focal point of implant tissue interaction and bone integration.
PEO technology can also be used to introduce various elements into the PEO coating. By careful element selection, this can produce a film having antibacterial or other functions [13,14]. Compared with Ag and Cu, F has both excellent antibacterial properties and certain osteogenic activity, so the addition of F has attracted great attention for improving the antibacterial activity of medical devices [15,16]. LIU et al [17,18] reported that incorporating F ions into the surface of a Ti implant improved its antibacterial activity and biocompatibility. Similarly, COOPER et al [19] showed that F ions treatment of TiO2 grit-blasted Ti substrates enhanced the osteoblastic differentiation of human mesenchymal stem cells and significantly increased the bone-to-implant contact in a rat tibia model. Furthermore, it is noted that dental implants with F-modified TiO2 showed the improved bone response and clinical performance by inducing topographical changes at the nano-scale and incorporating F ions in the surface structure [20].
YEROKHIN et al [21] reported that the PEO process showed relatively complex behavior when fluorides (NaF or KF) were used as the electrolyte, and that F ion concentration affected the size of the discharge pores. MOON and KWON [22] found that PEO films prepared in a NaF-containing electrolyte presented nodular features, and the surface roughness and thickness of the PEO film increased with increasing NaF concentration. Similar results were confirmed by other researchers, who further demonstrated that the fluoride-doped coatings had markedly improved corrosion resistance and microhardness [23,24]. However, VENKATESWARLU et al [25] found that the presence of fluoride promoted the transformation from anatase to rutile of the TiO2 coatings, resulting in a more porous surface structure with an unstable barrier layer, which weakened corrosion resistance. Nevertheless, MAKHLOUF and SOLIMAN [26] argued that doping had almost no effect on the crystal phase of ceramic coatings formed by PEO on magnesium alloys, and that fluoride-doped PEO coatings provided superior corrosion resistance in comparison with the magnesium substrate. It follows that fluoride has been widely studied as an additive in PEO electrolyte, although the effects of fluoride additives on the PEO process are not clear. Therefore, we studied the PEO process with fluoride as the principal component of the electrolyte to determine its effects, with the aim of proving micro/nano-structured coatings with antibacterial function.
2 Experimental
Ti6Al4V alloy samples with sizes of d10 mm �� 10 mm were cut from a bar for the PEO experiments. The nominal composition (mass fraction) of this Ti alloy was 0.141% Fe, 0.008% H, 0.13% O, 6.43% Al, 4.13% V, and balance Ti. The base electrolyte was NaF with a concentration of 0.15-0.5 mol/L; the pH was adjusted to 10 by the addition of NaOH. The PEO process was carried out using pulsed electrical power (WDM20-700, Xihua University) providing positive pulsed voltage. The Ti6Al4V samples were coated using PEO for 10 min with an average anode current density of 15 A/dm2, a fixed frequency of 200 Hz, and a duty cycle of 45%. The electrolyte temperature was kept below 20 ��C by a heat exchange system during the PEO process.
The thickness of the PEO coating was detected using a coating thickness gauge (Fischer DUAL- SCOPE MP0). The surface and cross-sectional morphology of the PEO coatings were observed by scanning electron microscopy (SEM, Phenom ProX) and transmission electron microscopy (TEM, JEM-2100F, JEOL Co., Ltd.). The distributions of Ti, O, F, and Al were determined by energy dispersive spectrometry (EDS, Phenom ProX). Surface profile analysis was carried out (at small scale) to calculate the discharge channel diameter and average surface roughness (Ra) by using atomic force microscopy (AFM, SPM-9600) in tapping mode over a scanning area of 3 ��m �� 3 ��m. The surface roughness of the coated specimens was calculated using Gwyddion 2.43 software. The phase composition of the coatings was investigated by X-ray diffractometer (XRD, AL-2700B) using Cu K�� radiation at 40 kV and 30 mA over a 2�� range of 10��-90�� with a scan speed of 0.1 (��)/s. The phase composition of the coatings was quantitatively analyzed by the adiabatic method. The adiabatic method is based on the theory that the peak intensity of a particular phase in a phase mixture is proportional to its mass fraction [27]. Based on the adiabatic theory, if there are N phases in a system, the mass fraction of phase i can be calculated using Eq. (1):
 (1)
(1)
where wi is the mass fraction of phase i in the sample, Ii is the strongest diffraction peak strength of phase i, and Kji is the intensity ratio of the strongest diffraction peak of reference phase j to phase i (1:1 mixing). Potentiodynamic polarization curves of the substrate and samples with different PEO treatment time were recorded in 3.5 wt.% NaCl solution using a CS120 electrochemical measurement system at a scan rate of 0.1 mV/s, from -0.4 to 0.2 V. Prior to the test, all samples were immersed in the test solution for 4 h to attain a stable open circuit potential (OCP). OCP measurements were conducted every 5 min throughout the 4 h immersion time. According to the Stern-Geary equation [28], the polarization resistance (Rp) was calculated as follows:
 (2)
(2)
where ��a and ��c are Tafel constants of anode and cathode, respectively, and Jcorr is the corrosion current density.
3 Results and discussion
3.1 Effect of F ion concentration on discharge behavior
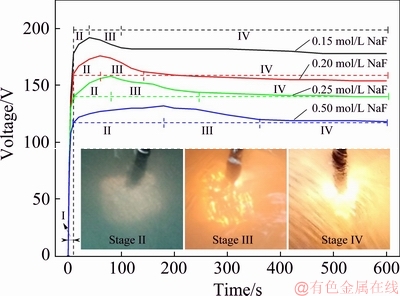
Fig. 1 Voltage-time response during PEO process in NaF electrolyte
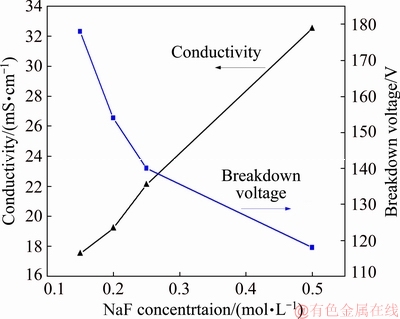
Fig. 2 Breakdown voltage of PEO process in NaF electrolyte and its conductivity
The voltage-time response curves of the PEO process on Ti6A14V alloy in NaF electrolyte are presented in Fig. 1. The PEO process consisted of four stages, depending on the rate at which the process voltage was changed and the type of spark discharge was observed. In Stage I (the ��traditional anodization�� stage), the process voltage increased linearly at a very high rate (11.7-17.8 V/s). No sparks were observed on the sample surface. This was reportedly caused by the formation of a thin anodic barrier film at the substrate/electrolyte interface [25,29]. Moreover, as the NaF concentration was increased, the breakdown voltage (see Fig. 2) decreased. This is because the increased electrolyte conductivity causes a larger number of electrons to be injected into the oxide conductive belt at the electrolyte/oxide interface, promoting the breakdown of the coating [30]. In Stage II (the ��spark discharge�� stage), the rate at which the process voltage increased was significantly reduced (0.47-0.09 V/s). Many small white sparks flashed rapidly on the sample surface. During this stage, the spark discharge time increased gradually as the F ion concentration increased. In Stage III (the ��dynamic micro arc discharge�� stage), as the PEO process continued, the process voltage gradually dropped, and the tiny sparks grew into larger micro arcs with an orange color that flashed across the sample surface. As the F ion concentration increased, the rate at which these micro arcs traveled decreased. Whereas the arc brightness first rose and then decreased, reaching a maximum at 0.25 mol/L NaF. In Stage IV (the ��near steady arc discharge�� stage), the voltage reached a relatively stable value, and few arcs were observed. However, some continuous discharge arcs occasionally occurred in certain corners and specific areas of the sample, especially in the 0.25 mol/L NaF electrolyte.
3.2 Surface morphology of micro/nano-structured coatings
Figure 3 shows the surface morphologies of the PEO-coated Ti6Al4V alloys in NaF electrolytes with different concentrations. After PEO in 0.15 mol/L NaF electrolyte, two discharge areas were observed on the coating surface (Fig. 3(a)): a spark discharge area, with pores of 200-800 nm in diameter, and an arc discharge area, with pits of ~11.1 ��m. While there were many spark pores distributed evenly on the coating surface, but there were only a few pits caused by micro arc discharge, and they were not obvious. The coating formed in 0.20 mol/L NaF electrolyte developed a large number of discharge pits with a diameter of ~13.2 ��m (Fig. 3(b)). Increasing the F ion concentration clearly promoted micro arc discharge both in terms of quantity and size. In 0.25 mol/L NaF electrolyte, the pits were larger and deeper due to the occurrence of micro arc discharge in the same regions (Fig. 3(c)). When the NaF concentration reached 0.50 mol/L, the powerful arc discharges moved slowly on the sample surface, making the discharge pits connect with each other to form a ditch morphology (Fig. 3(d)). However, there were still a large number of submicron-size spark pores in the micron pits. These results demonstrated that coatings with micro/ nano structures can be obtained by PEO using NaF electrolyte.
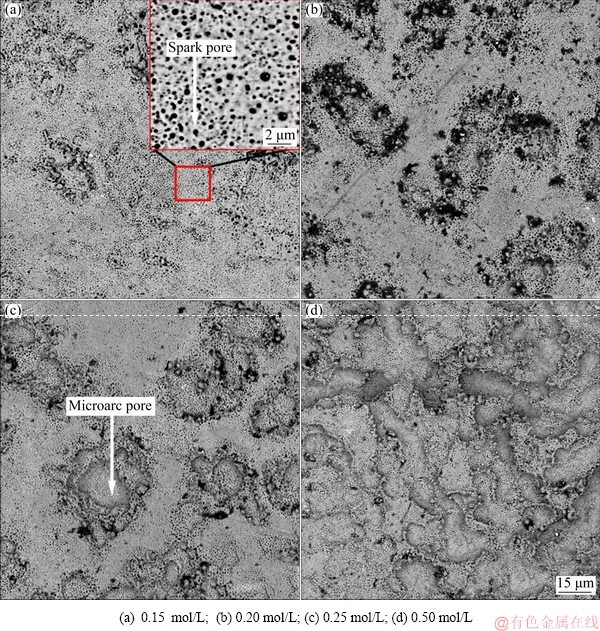
Fig. 3 Surface morphologies of PEO-coated Ti6Al4V alloys in NaF electrolytes with different concentrations
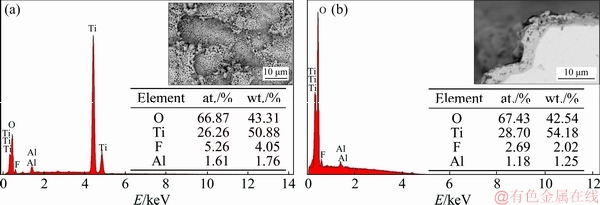
Fig. 4 EDS analysis of PEO-coated Ti6Al4V alloys in 0.50 mol/L (a) and 0.25 mol/L (b) NaF electrolytes
The morphologies of pores and pits observed in Fig. 3 are different from the pancake structures that are typically seen for PEO-treated Ti6Al4V alloy using other electrolytes [31]. It is possible that the F ion concentration is a key factor in changing the discharge model and structure evolution. EDS analysis showed that there were some residual fluoride crystals near the pits (Fig. 4). Some residual molten oxide could be observed around the pores or pits, but most of the molten oxide was dissolved, exposing the structure of the discharge channels. It is well known that F ion can bond with H ion to form HF, which preferentially adsorbs to certain parts of the TiO2 film. Once this happens, dissolution of the molten oxide occurs as the O atoms of TiO2 are replaced by F atoms. The reaction is described as follows [32]:
Ti+2H2O��TiO2+4H++4e (3)
TiO2+6F-+4H+�� +2H2O (4)
Here, it should be noted that F ions can dissolve TiO2 and promote the formation of an anodizing porous film, which contributes to the spark discharge and micro arc discharge. This may explain the fact that the discharge becomes increasingly violent as the F ion concentration increases, until a continuous arc discharge is generated that yields a ditch morphology. In addition, many pits were observed on the surface of the PEO coating in which discharge pores formed, while no nodular bulges or pancake structures were found surrounding the pores. Thus, the structural evolution of these PEO coatings is evidently different from that of the outward-growth coatings reported in Ref. [33].
The three-dimensional AFM surface topographic images of PEO-coated Ti6Al4V alloys in NaF electrolytes are shown in Fig. 5. Two types of pores can be observed: submicron-size pores, 200-800 nm in diameter (Fig. 5(a)); micron-size pores, 1-2 ��m in diameter (Fig. 5(c)). The results showed that the modification of Ti6Al4V alloy by PEO with 0.15, 0.20, or 0.25 mol/L NaF led to the increase in the root mean square roughness (Rq), average surface roughness (Ra), and maximum vertical distance between the highest and lowest points in the area of analysis (Rmax). However, when the NaF concentration reached 0.50 mol/L, the powerful arc discharges induced serious ablation of the coating, which decreased the surface roughness.
3.3 Cross-sectional morphology of micro/nano- structured coatings
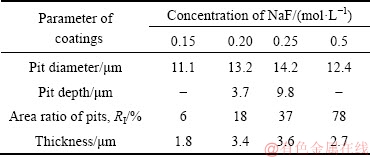
The cross-sectional morphologies of the PEO-coated Ti6Al4V alloys in NaF electrolytes with different concentrations are displayed in Fig. 6. Parameters such as pit dimension, area ratio of pits, and coating thickness were obtained from Fig. 3 and Fig. 6 and are given in Table 1. As shown in Fig. 6(a), with 0.15 mol/L NaF electrolyte, the contact interface between the substrate and PEO coating was largely flat, with some submicron- size pores observed in the coating. Notably, very few pits caused by arc discharge were found. Thus, the growth of the coating in the 0.15 mol/L NaF electrolyte was almost entirely attributed to spark discharge and anodization. As shown in Fig. 6(b), with 0.20 mol/L NaF electrolyte, the contact interface had many peaks and valleys due to the existence of pits caused by arc discharge. The pits grew in both diameter and depth as the NaF concentration increased up to 0.25 mol/L (see Fig. 6(c) and Table 1). Particularly, in 0.25 mol/L NaF electrolyte, the arc discharge moved repeatedly over the same region to create a large pit (Fig. 3(c) and Fig. 6(c)). However, as the F ion concentration increased to 0.50 mol/L, the contact interface became relatively flat again, due to the existence of numerous pits distributed evenly over the sample surface, in full contact with each other (Fig. 6(d)).
Some researchers have proposed a voltage difference (��U) between the maximum working voltage and the breakdown voltage, which may represent the power of the discharge and affect the dimensions of the pits and the coating thickness [34]. Figure 7 demonstrates that both ��U and the coating thickness first rose and then decreased with the increase of F ion concentration, reaching a maximum value for the 0.25 mol/L NaF electrolyte. The same tendency was observed in the pit dimensions, as shown in Table 1. Therefore, it was concluded that F ions promoted the growth of the coating by increasing the power of the discharge.
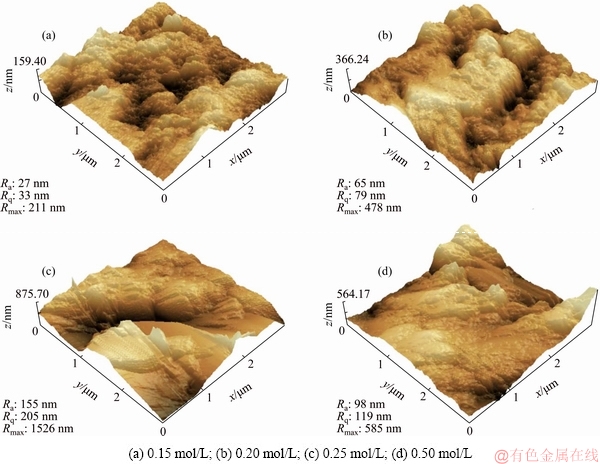
Fig. 5 3D surface topographic images and parameters of surface roughness of PEO-coated Ti6Al4V alloys in NaF electrolytes with different concentrations
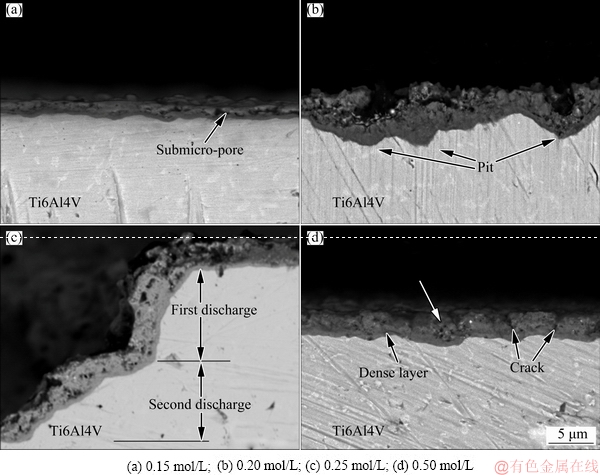
Fig. 6 Cross-sectional morphologies of PEO-coated Ti6Al4V alloys in NaF electrolytes with different concentrations
Table 1 Parameters of PEO coatings obtained by scanning electron microscopy
3.4 Phase compositions of micro/nano-structured coatings
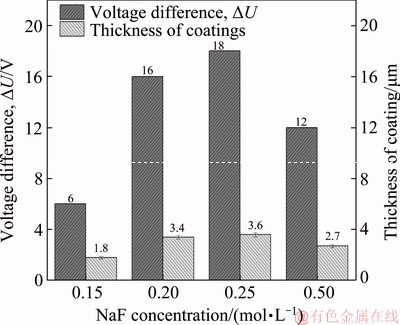
Fig. 7 Column diagram of voltage difference (��U) and thickness of PEO coatings corresponding to different concentrations of NaF electrolytes
Figure 8(a) displays a TEM bright-field image of the inner dense layer of the PEO coating obtained in 0.25 mol/L NaF electrolyte, and the corresponding selected area diffraction pattern is shown in Fig. 8(b). A 50 nm thick layer of amorphous TiO2 was observed at the coating/substrate interface. Figure 8(c) shows a TEM dark-field image of the porous layer of the PEO coating obtained in 0.25 mol/L NaF electrolyte, and the corresponding selected area diffraction pattern is given in Fig. 8(d). The porous layer clearly consisted of a large number of nanocrystalline rutile TiO2 grain and anatase TiO2 grain.
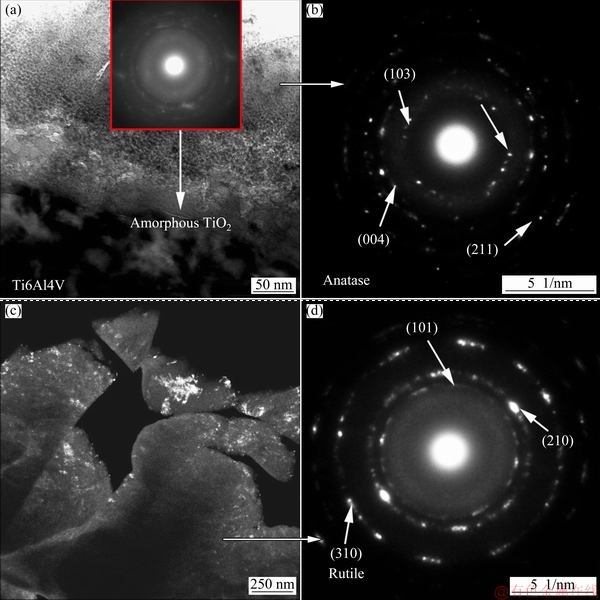
Fig. 8 TEM bright-field image of inner dense layer of PEO coating obtained in 0.25 mol/L NaF electrolyte (a) and its selected area diffraction pattern (b), TEM dark-field image of porous layer of coating obtained in 0.25 mol/L NaF electrolyte (c) and its selected area diffraction pattern (d)
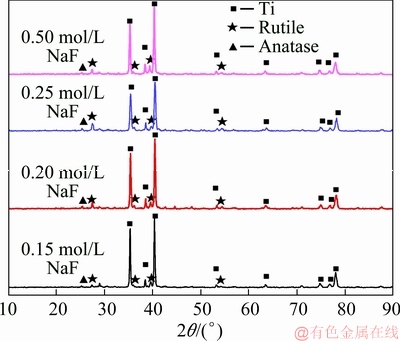
Fig. 9 XRD patterns of PEO coatings obtained in NaF electrolyte with different concentrations
XRD patterns (see Fig. 9) of the PEO coatings revealed that they mainly consisted of rutile and anatase phases. The intensities of the Ti substrate peaks were very strong, indicating that the coating was thin enough to be easily penetrated by the X-ray. The Al content in the substrate was low, so it can be ignored in the analysis. Figure 10 illustrates the influence of NaF concentration on the mass fractions of main phase. It was found that the amount of rutile and anatase phase in the coatings gradually increased as the NaF concentration increased up to 0.25 mol/L. Of the two phases, the amount of rutile phase increased faster, indicating that a phase transformation from metastable anatase to stable rutile phase occurred. This can be explained by the fact that a stronger spark was created in the discharge channel with a higher concentration of F ions, and a higher local temperature was reached. However, when the NaF concentration exceeded 0.25 mol/L, the amounts of rutile and anatase phases were both significantly reduced, which could be related to the conversion of plasma discharge to arc discharge, leading to coating ablation. The ablation of rutile was intenser, indicating that the rutile phase was on the outermost layer of the coating, which is consistent with the results shown in Fig. 8.
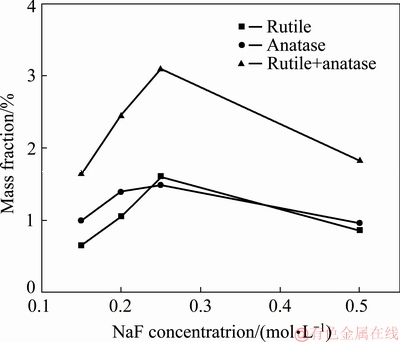
Fig. 10 Influence of NaF concentration on mass fraction of phases
3.5 Corrosion resistance of micro/nano-structured coatings

Fig. 11 Tafel polarization curves of PEO coatings obtained in NaF electrolytes with different concentrations
Table 2 Potentiodynamic polarization data of PEO coating obtained in NaF electrolyte
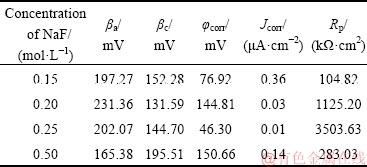
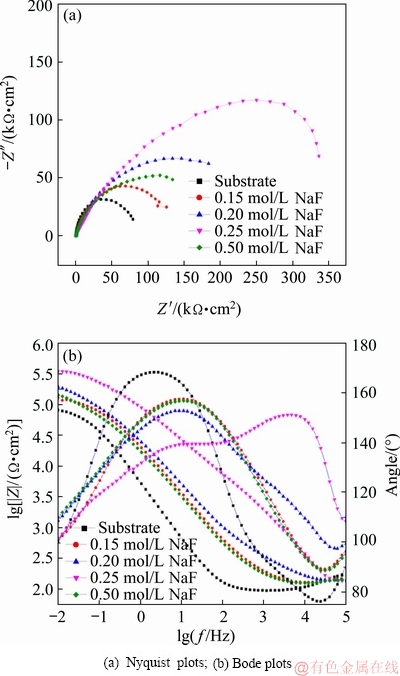
Fig. 12 EIS spectra of PEO coatings obtained in NaF electrolytes with different concentrations: (a) Nyquist plots; (b) Bode plots
Potentiodynamic polarization curves of the PEO coatings were obtained over a potential range of ��600 mV in 3.5% NaCl solution (see Fig. 11). The Tafel constants (��a and ��c), corrosion potential (��corr), and corrosion current density (Jcorr) were derived from the plots by Tafel extrapolation and are presented in Table 2. According to the Stern-Geary equation [28], it was found that the corrosion current density of the coating was reduced as the NaF concentration increased from 0.15 to 0.25 mol/L. Moreover, the coating formed in 0.25 mol/L NaF electrolyte had the best corrosion resistance, which could be attributed to the thicker coating. To further confirm the influence of F ions on the corrosion resistance of the PEO coating, the AC impedances of Ti alloy and PEO-treated samples were measured. Figure 12 shows the electrochemical impedance spectra of PEO coatings obtained in NaF electrolytes with different concentrations. Studies have shown that that the reactance arc in the high frequency region reveals the properties of the solution/film interface, and the reactance arc in the low frequency region indicates the properties of the oxide film itself [21,35]. ZHU et al [35] found that there is a direct relationship between arc radius and corrosion rate in Nyquist plots. Compared with the Ti alloy substrate, thecorrosion resistance of the PEO-treated sample was significantly improved. As the NaF concentration increased from 0.15 to 0.25 mol/L, the radius of the capacitance loop and |Z| (Z is impedance of the coated samples) decreased, which indicates an increase in the corrosion resistance of the oxide film. Therefore, the incorporation of F ions (using NaF electrolyte with a concentration of ��0.25 mol/L) can promote the growth of the PEO coating and improve the corrosion resistance of the sample. However, as the NaF concentration increased to 0.50 mol/L, the discharge became increasingly violent, and coating ablation occurred, leading to inferior corrosion resistance of the PEO coating.
4 Conclusions
(1) The Ti6Al4V alloys had very low PEO voltage (less than 200V) in NaF electrolyte. As the NaF concentration increased, the conductivity of the electrolyte gradually increased, the PEO voltage gradually decreased, and the brightness of the discharge spark firstly increased and then decreased, reaching a maximum at 0.25 mol/L NaF.
(2) The morphology of the pores formed on the PEO-treated Ti6Al4V alloy in NaF electrolyte was different from the typical pancake structure produced in other electrolytes. Most of the molten oxides were dissolved by NaF solution, and the entire structures of the discharge channels, including a large number of nanometer-sized discharge pores, were exposed. Thus, micro/nano-structured coatings can be formed on Ti6Al4V alloy by PEO treatment in NaF electrolyte. The number of pits with diameters of 10-15 ��m increased as the NaF concentration increased. In addition, pores with diameters of 200�C800 nm were evenly distributed across the whole coating including the surface of the pits.
(3) The coatings obtained in NaF electrolyte mainly consisted of amorphous TiO2, anatase phase, and rutile phase. The F ions promoted a slight phase transformation from metastable anatase to stable rutile phase.
(4) The coating formed in NaF electrolyte was thin (<4 ��m) and had low surface roughness. The F ion concentration had little effect on the phase transition, but significantly affected the corrosion resistance. In general, the surface roughness, rutile and anatase contents, corrosion resistance, and thickness of the coating firstly increased and then decreased as NaF concentration increased, reaching the maximum values at 0.25 mol/L NaF.
References
[1] YOON I K, HWANG J Y, JANG W C, KIM H W, SHIN U S. Natural bone-like biomimetic surface modification of titanium [J]. Applied Surface Science, 2014, 301: 401-409.
[2] TERLEEVA O P, SHARKEEV Y P, SLONOVA A I, MIRONOV I V, LEGOSTAEVA E V, KHLUSOV I A, MATYKINA E, SKELDON P, THOMPSON G E. Effect of microplasma modes and electrolyte composition on micro-arc oxidation coatings on titanium for medical applications [J]. Surface and Coatings Technology, 2010, 205(6): 1723-1729.
[3] SHARKEEV Y, KOMAROVA E, SEDELNIKOVA M, SUN Z M, ZHU Q F, ZHANG J, TOLKACHEVA T, UVARKIN P. Structure and properties of micro-arc calcium phosphate coatings on pure titanium and Ti-40Nb alloy [J]. Transactions of Nonferrous Metals Society of China, 2017, 27(1): 125-133.
[4] SHIVARAM A, BOSE S, BANDYOPADHYAY A. Understanding long-term silver release from surface modified porous titanium implants [J]. Acta Biomaterialia, 2017, 58: 550-560.
[5] SURMENEV R A, SURMENEVA M A, IVANOVA A A. Significance of calcium phosphate coatings for the enhancement of new bone osteogenesis��A review [J]. Acta Biomaterialia, 2014, 10(2): 557-579.
[6] Narayanan T, MIN H L. Nanoscale modification of magnesium with highly textural lamellar nanosheets towards increasing the corrosion resistance and bioactivity [J]. Surface and Coatings Technology, 2016, 304: 425-437.
[7] Webster T J, Ejiofor J U. Increased osteoblast adhesion on nanophase metals: Ti, Ti6Al4V, and CoCrMo [J]. Biomaterials, 2004, 25(25): 4731-4739.
[8] ESTRIN Y, KASPER C, DIEDERICHS S, LAPOVOK R. Accelerated growth of preosteoblastic cells on ultrafine grained titanium [J]. Journal of Biomedical Materials Research: Part A, 2009, 90(4): 1239-1242.
[9] BRAMMER K S, OH S, COBB C J, BJURSTEN L M, HEYDE H V D, JIN S. Improved bone-forming functionality on diameter- controlled TiO2 nanotube surface [J]. Acta Biomaterialia, 2009, 5(8): 3215-3223.
[10] MARTINEZ E, ENGEL E, PLANELL J A, SAMITIER J. Effects of artificial micro- and nano-structured surfaces on cell behavior [J]. Annals of Anatomy, 2008, 191(1): 126-135.
[11] FLEMMING R G, MURPHY C J, ABRAMS G A, GOODMAN S L, NEALEY P F. Effects of synthetic micro- and nano-structured surfaces on cell behavior [J]. Biomaterials, 1999, 20(6): 573-588.
[12] LU X, Feng B, Weng J, LENG Y. The effects of micro-and nano-structured biomaterial surfaces on osteogenetic-related cells [J]. Materials China, 2013, 32(10): 611-622. (in Chinese)
[13] REN F J, Ling Y H, Feng J Y. The role of W doping in response of hydrogen sensors based on MAO films [J]. Applied Surface Science, 2010, 256(12): 3735-3739.
[14] Cheng S, Wei D, Zhou Y, Guo H. Characterization and properties of microarc oxidized coatings containing Si, Ca and Na on titanium [J]. Ceramics International, 2011, 37(6): 1761-1768.
[15] YOSHINARI M, ODA Y, KATO T, OKUDA K. Influence of surface modifications to titanium on antibacterial activity in vitro [J]. Biomaterials, 2001, 22(14): 2043-2048.
[16] WANG Y S, ZHANG S, ZENG X T, MA L, WENG W J, YAN W Q, QIAN M. Osteoblastic cell response on fluoridated hydroxyapatite coatings [J]. Acta Biomaterialia, 2007, 3(2): 191-197.
[17] LIU H Y, XIAO J, ZHONG W J, WANG L P, QI M, YING X X, NAKANO K, KAWAKAMI T, MA G W. In vitro behavior of bacteria on fluoride ion-coated titanium: With special regards on porphyromonas gingivalis [J]. Journal of Hard Tissue Biology, 2011, 20(1): 47-52.
[18] LIU H X, WANG X J, WANG L P, LEI F Y, WANG X F, AI H J. Effect of fluoride-ion implantation on the biocompatibility of titanium for dental applications [J]. Applied Surface Science, 2008, 254(20): 6305-6312.
[19] COOPER L F, ZHOU Y S, TAKEBE J, GUO J L, ABRON A, HOLMEN A, ELLINGSEN J E. Fluoride modification effects on osteoblast behavior and bone formation at TiO2 grit-blasted c.p. titanium endosseous implants [J]. Biomaterials, 2006, 27(6): 926-936.
[20] LAMOLLE S F, MONJO M, LYNGSTADAAS S P, ELLINGSEN J E, HAUGEN H J. Titanium implant surface modification by cathodic reduction in hydrofluoric acid: Surface characterization and in vivo performance [J]. Journal of Biomedical Materials Research: Part A, 2009, 88(3): 581-588.
[21] YEROKHIN A L, NIE X, LEYLAND A, MATTHEWS A, DOWEY S J. Plasma electrolysis for surface engineering [J]. Surface and Coatings Technology, 1999, 122(2-3): 73-93.
[22] MOON S, KWON D. Anodic oxide films formed on AZ31 magnesium alloy by plasma electrolytic oxidation method in electrolytes containing various NaF concentrations [J]. Journal of the Korean Institute of Surface Engineering, 2016, 49(3): 225-230.
[23] LV G H, CHEN H, WANG X Q, PANG H, ZHANG G L, ZOU B, LEE H J, YANG S Z. Effect of additives on structure and corrosion resistance of plasma electrolytic oxidation coatings on AZ91D magnesium alloy in phosphate based electrolyte [J]. Surface and Coatings Technology, 2010, 205(S1): 36-40.
[24] WANG Y J, LIU Z G, OUYANG J H, WANG Y M, ZHOU Y. Preparation and high temperature oxidation resistance of microarc oxidation ceramic coatings formed on Ti2AlNb alloy [J]. Applied Surface Science, 2012, 258(22): 8946-8952.
[25] VENKATESWARLU K, RAMESHBABU N, SREEKANTH D, BOSE A C, MUTHUPANDI V, SUBRAMANIAN S. Fabrication and characterization of micro-arc oxidized fluoride containing titania films on Cp Ti [J]. Ceramics International, 2013, 39(1): 801-812.
[26] MAKHLOUF A S H, SOLIMAN H. Handbook of nanoceramic and nanocomposite coatings and materials [M]. Oxford: Butterworth- Heinemann, 2015: 389-401.
[27] LI B, GUO Y H. Application of phase quantitative analysis in aluminum industry [J]. Physical Testing & Chemical Analysis, 2011, 47: 217-221.
[28] Stern M, Geary A L. Electrochemical polarization I. A theoretical analysis of the shape of polarization curves [J]. Journal of the Electrochemical Society, 1957, 104(1): 56-63.
[29] MI T Y, JIANG B, LIU Z, FAN L. Plasma formation mechanism of microarc oxidation [J]. Electrochimica Acta, 2014, 123: 369-377.
[30] LIANG J, GUO B G, TIAN J, LIU H W, ZHOU J F, LIU W M, XU T. Effects of NaAlO2 on structure and corrosion resistance of microarc oxidation coatings formed on AM60B magnesium alloy in phosphate-KOH electrolyte [J]. Surface and Coatings Technology, 2005, 199(2-3): 121-126.
[31] JIANG X D, PAN C X. Handbook of nanoceramic and nanocomposite coatings and materials [M]. Oxford: Butterworth- Heinemann, 2015: 257-276.
[32] WANG Y, WU Y C, QIN Y Q, XU G B, HU X Y, CUI J W, ZHENG H M, HONG Y, ZHANG X Y. Rapid anodic oxidation of highly ordered TiO2 nanotube arrays [J]. Journal of Alloys & Compounds, 2011, 509(14): L157-L160.
[33] CHENG Y L, PENG Z M, WU X Q, CAO J H, SKELDON P, THOMPSON G E. A comparison of plasma electrolytic oxidation of Ti-6Al-4V and Zircaloy-2 alloys in a silicate-hexameta phosphate electrolyte [J]. Electrochimica Acta, 2015, 165: 301-313.
[34] ERFANIFAR E, ALIOFKHAZRAEI M, NABAVI H F, AGHDAM A S R. Growth kinetics and morphology of microarc oxidation coating on titanium [J]. Surface & Coatings Technology, 2017, 315: 567-576.
[35] ZHU Q Z, XUE W B, WU X L, LU L, LIU G J, LI W F. Electrochemical corrosion property of microarc oxidation ceramic coatings on 20vol.% Al2O3-SiO2(sf))/AZ91D magnesium matrix composite [J]. Rare Metal Materials and Engineering, 2011, 40(5): 911-916. (in Chinese).
���õ����ӵ����������Ti6Al4V�Ͻ�����Ʊ�/�����մ�Ϳ��
�Դ��1,2,3�������1
1. �Ĵ���ѧ ��е����ѧԺ���ɶ� 610065��
2. �Ĵ�����ְҵ����ѧԺ ���Ϲ���ϵ������ 618000��
3. �Ĵ�ʡ���ղ��ϼ����ģ���ռ�������ʵ���ң����� 618000
ժ Ҫ��Ϊ������ѺϽ�Ĺ������ԺͿ������ԣ���NaF���Һ�ж�Ti6Al4V�Ͻ���е�������������(PEO)�������Ʊ�������FԪ�ص�/���ṹ�մ�Ϳ�㡣����ɨ��/����������������ǡ�ԭ����������X���������ǺͶ���λ�������ֶΣ��о�NaFŨ��(0.15~0.50 mol/L)��PEO���ա�Ϳ�������֯������ɡ���ʴ�Ժͺ�ȵ�Ӱ�졣�����������NaF���Һ��Ti6Al4V�Ͻ��PEO��ѹ��(����200 V)��������NaFŨ�ȵ����ӣ�PEO��ѹ��һ�����͡���NaF���Һ���γɾ��п��ֱ�Ϊ10~15 ��m��200~800 nm��/�ɽṹͿ�㣬��Ϳ�����ò�����������Һ���γɵĵ��ͱ�״�ṹ��ͬ����NaF���Һ���γɵ�Ϳ��ֲ�����ֲڶȺ�С����Ƚϱ�(<4 ��m)��NaFŨ�ȶԴ�����̬���ѿ������ȶ����ʯ��ת���Ӱ���С������Ϳ����ʴ��Ӱ��ϴ��ܵ���˵������NaFŨ�ȵ����ӣ�Ϳ��ı���ֲڶȡ����ѿ�ͽ��ʯ��������ʴ�Ժͺ����������С��NaFŨ��Ϊ0.25 mol/Lʱ�ﵽ���ֵ��
�ؼ��ʣ�����������������Ti6Al4V�Ͻ�/�ɽṹ��NaF���������
(Edited by Wei-ping CHEN)
Corresponding author: Ke-qin FENG; Tel: +86-13628058806; E-mail: kqfeng@scu.edu.cn
DOI: 10.1016/S1003-6326(19)65162-9
Abstract: In order to improve the osseointegration and antibacterial activity of titanium alloys, micro/nano-structured ceramic coatings doped with antibacterial element F were prepared by plasma electrolytic oxidation (PEO) process on Ti6Al4V alloy in NaF electrolyte. The influence of NaF concentration (0.15-0.50 mol/L) on the PEO process, microstructure, phase composition, corrosion resistance and thickness of the coatings was investigated using scanning/transmission electron microscopy, energy dispersive spectroscopy, atomic force microscopy, X-ray diffractometer, and potentiodynamic polarization. The results demonstrated that Ti6Al4V alloy had low PEO voltage (less than 200 V) in NaF electrolyte, which decreased further as the NaF concentration increased. A micro/nano-structured coating with 10-15 ��m pits and 200-800 nm pores was formed in NaF electrolyte; the morphology was different from the typical pancake structure obtained with other electrolytes. The coating formed in NaF electrolyte had low surface roughness and was thin (<4 ��m). The NaF concentration had a small effect on the phase transition from metastable anatase phase to stable rutile phase, but greatly affected the corrosion resistance. In general, as the NaF concentration increased, the surface roughness, phase (anatase and rutile) contents, corrosion resistance, and thickness of the coating first increased and then decreased, reaching the maximum values at 0.25 mol/L NaF.
