
J. Cent. South Univ. (2017) 24: 1443-1449
DOI: 10.1007/s11771-017-3548-z

Differential amplification method for flow structures analysis of centrifugal pump between design and off-design points
ZHANG He-hui(�����)1, DENG Sheng-xiang(��ʤ��)1, QU Ying-jie(��Ӣ��)2
1. School of Energy Science and Engineering, Central South University, Changsha 410083, China;
2. Hunan M&W Energy Saving Tech.Co.Ltd., Changsha 410208, China
 Central South University Press and Springer-Verlag Berlin Heidelberg 2017
Abstract:
The three-dimensional internal flow field of centrifugal pump is complex and variable with design parameters and operation conditions. The post-processing technique named differential amplification method was proposed for the comparison study of different flow structures. The full steady flow fields of an industrial centrifugal pump working on-design and off-design points were numerically investigated by solving Reynolds average Navier-Stokes equations together with a shear-stress transport (SST) k-w turbulence model. And the numerically predicted performance curves of the studied pump agree well with test measurement results. Compared with the flow flied on design point under the help of differential amplification method, the disturbance caused by interaction between blade and volute tongue is very obvious and it extends to the diffuser pipe on the working point with 0.8 times rated flux. While on the point with 1.2 times rated flux, the flow distribution in impeller region is roughly even and it flows more to the bottom section of the diffuser pipe. The above method was proved to be good at displaying the subtle secondary flow structure changes with a higher resolution effect relative to single isolated case observation, which helps the optimization decision-making from multiple design cases.
Key words:
differential amplification; computational fluid dynamics (CFD); flow structure; centrifugal pump��
1 Introduction
Centrifugal pumps are widely applied in various liquid transportation facilities for their advantages of stable performance, wide working scope, simple structure and easy maintainability. While nowadays the pressure of resources and environment draws higher demand in their performance, especially the requirement of low energy consumption, long lifetime, low noise and little vibration. It is the fluid behavior inside pumps that plays a predominant role in the index of the above performances [1-4]. The fluid behavior concentrates on the flow structures of the flow flied, thus the acquisition and analysis of flow structures inside pump becomes the base of further product design refinement.
The internal flow field of pump can be obtained mainly by velocity field measurement techniques and mathematical simulation method. WU et al [5] investigated the flow structures of tip leakage vortex (TLV) in a water-jet pump by particle image velocimetry (PIV) measurements, and revealed the TLV separation process and its accompanying turbulence phenomenon with high-magnification instantaneous data. PEDERSEN et al [6] used both PIV and laser Doppler velocimetry (LDV) to survey the flow inside the rotating passages of a six-bladed shrouded centrifugal pump at design and off-design conditions. Results showed that the velocity distribution at design load was well-behaved flow without any separation, while at the quarter-load a large recirculation cell appeared near the inlet of the stalled passage. Compared with velocity field measurement techniques, the mathematical simulation method can provide more flow information with relative lower cost, so numerical calculation technologies have been widely made to study the flow field inside pump, especially for the comparison of different design schemes or working conditions. LANGTHJEM and OLHOFF [7, 8] developed a two-dimensional numerical model to establish relationship between the hydrodynamics and hydroacoustics of pump, and the acoustic pressure filed was well predicted by flow field. The main source of noise came from the unsteady impeller blade surface forces, which involved the vortex near the volute tongue. Therefore, an optimal tongue structure had been picked out to reduce flow-induced noise by comparing the flow field difference of several structure schemes. The computational fluid dynamics (CFD) method can also be applied to locate excessive energy loss by the analysis and comparisons of secondary flow structures. With this method, LABIB et al [9] investigated the effect of skew angles of multistage centrifugal impellers on second flow in the flow passage of the impellers, and finally obtained the optimum parameter combination of design and operating conditions.
In essence, the key to optimize internal fluid behavior of pump lies in the comparative study of flow structures under different cases obtained by whether flow field measurements or CFD calculation. However, for most literature reports, the flow field from different cases is simply illustrated by separate distribution diagrams, such as velocity vector [10], pressure nephogram [11] and streamline [12], which is often not enough for intensive comparison and discrimination. In fact, as the internal three-dimensional flow flied of centrifugal pump is so complicated with strong turbulent, back flow and secondary circulation, it remains to make a new approach for researchers to identify and locate the subtle distinction of different cases clearly.
The objective of the present work is to propose the differential amplification method in analyzing flow structures of centrifugal pump, which can amplify the difference of flow structures from design and off-design operation points. The flow field information is calculated with CFD method by commercial software, and a series of display on flow structures difference can be made with clear and obvious show. First, the principal and assumption of the differential amplification method in flow structures analysis will be presented. Then, a numerical analysis and its experimental verification will be done on an industrial centrifugal pump as the application example of the above method, which focuses on the energy efficiency difference under operation conditions of 0.8Qn, 1.0Qn and 1.2Qn, where Qn means the rated flux of the pump. At last, the differential amplification method will be taken to capture the flow structure difference between the design and off-design points in the post-processing of CFD, and reveal the causes of efficiency fall at off-design points from the view of flow behavior.
2 Differential amplification method in flow field analysis
2.1 Principle
The idea of differential amplification method comes from the differential amplifier in the electronic circuit field, which is designed to amplify the difference between two input voltages [13]. The differential amplifier, shown in Fig. 1, consists of five connection ports. With the two source ports (Vs+ and Vs-) providing power supply voltage, the voltage difference of the two inputs, V+ and V- , will be amplified with a gain of A, and then transferred to the output port Vout, which can be described as
 (1)
(1)
where V+ and V- are input voltage; Vout is output voltage; A is a constant as the amplification factor of the differential amplifier.
The principle of differential amplifier circuit can also be applied into the flow field comparison of different cases. Imagine that there are two flow fields, named as case I and case II respectively, containing different velocity distribution information but sharing the same coordinate system, thus the velocity difference of point K can be expressed as

 (2)
(2)
where UK nd U��K are the velocity vectors on point K of case I and case II, respectively (m/s); and ��UK is their difference value. The three-dimensional velocity components of UK (or U��K) are uK, vK and wK (or u��K, v��K and w��K) respectively. xK, yK and zK are the three- dimensional coordinate (m) of the investigated point K, and note that point K is required to exist in both cases. Similarly, Eq. (2) is also appropriate for the comparison of other flow parameters like vorticity, pressure and swirling strength, merely the vector subtraction should be changed into scalar subtraction for scalar parameter.

Fig. 1 Differential amplifier circuit
With the difference of certain flow parameters on each point from two cases, it is convenient to observe the flow structures difference values distribution of all the invested points by displaying them with enlarged display scale.
2.2 Applicability and recommendation
First of all, a declaration is made that the differential amplification method is only suitable when the order of magnitudes of difference value is higher than the measurement or calculation error, so a large enough signal to noise ratio (SNR) can be ensured. In practice, it is recommended that the observer evaluate the measurement deviation or numerical calculation residuals before analyzing difference value distribution obtained by the above method. Another recommendation is that a feature comparison basis should be selected in advance if several cases are to be compared. In general, the case with the best performance or most regular flow distribution can be chosen as the comparison base.
3 Numerical calculation and experiment verification
To prove the effect of differential amplification method, flow structures on different operation points of an industrial centrifugal pump were investigated. It was expected that the reason of performance reduction on off-design points could be explained from the view of flow structure transform. The flow field information came from numerical results obtained by CFD, and the predicted performance curves of CFD were verified through experimental test.
3.1 Object introduction
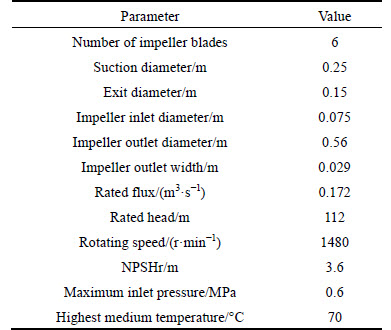
An industrial horizontal double entry split pump with a six-blade impeller was studied, which was made by Hunan M&W Energy Saving Tech. Co. Ltd. The pump was designed for clean water, and the main structure and performance parameters are listed in Table 1.
In order to better understand the inner structure of the pump for later discussion, a middle section of the inner fluid region is illustrated in Fig. 2. The plane passes through the centers of both suction and exit faces,and is perpendicular to the main rotating shaft. An x-y coordinate axis is given on the plane, with the origin located on the impeller center. The impeller rotates in anti-clockwise direction, and the blades of it are labeled from blade I to blade VI according to the rotation direction. There are also six impeller passages labeled from passage 1 to passage 6 in anti-clockwise direction, with passage 1 located between blade I and blade II, and passage 2 located between blade II and blade III, and so on. The volute tongue locates in the fourth quadrant, near the 270�� rotation angle.
Table 1 Main structure and performance parameters of studied pump
3.2 Numerical model
The commercial CFD package Fluent 14.0 based on finite volume method was chosen for solving the 3D Reynolds averaged incompressible Navier-Stokes equations. The mass and momentum conservation equations under the rectangular coordinate system are given as
 (3)
(3)
 (4)
(4)
where u represents the velocity (m��s-1); x is coordinate position (m); r is density (kg��m-3); p is static pressure (Pa); F is external body force term (N��m-3); and t represents time (s). The subscripts i and j represent the three directions in x, y and z��respectively. Parameter tij is the viscous stress tensor, which is defined as
 (5)
(5)
where m represents dynamic viscosity (kg��m-1��s-1), and xij is the Krnecker delta. When i=j, xij=1; otherwise, xij=0.
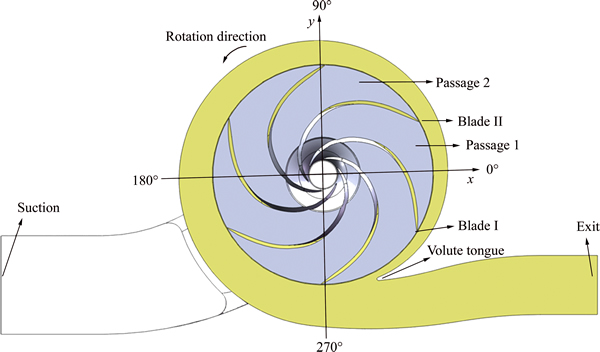
Fig. 2 Mid-plane view of inner fluid region
The shear-stress transport (SST) k-w turbulence model, developed by MENTER [14], was applied to get the CFD solving equations closed. The SST k-w model integrates both the advantages of the k-e model and k-w model, using the standard k-e model for far field free shear flow region while gradually changing it into k-w model for near-wall region. This model can deal well with complicated separation flow caused by multi- curvature revolving walls, so it is quite suitable for the inner flow flied calculation of centrifugal pumps [15]. The coefficients of the turbulence model are given as
 (6)
(6)
where F1 and F2 are coefficients of k-e model and k-w model, respectively; F1 represents the blending function. F1 equals 1 for near-wall region, and changes into 0 for outer wake region. The details for specific values can be referred to Ref. [14].
The inner fluid region of the pump was separated into three fluid zones with two different reference frames. The impeller region was set in rotating reference frame with a rotation speed of 1480 r/min. The reference frame in suction chamber and pumping volute was set as stationary. The mass flow inlet boundary condition was imposed on the suction face of the suction chamber with a 5% turbulence intensity. And the exit face of the pumping volute was set to be outflow for capturing the fully developed velocity distribution. A stationary motion state and no-slip shear condition wall boundary was given to all internal faces of the pump case. Fluid property was set as the feature of pure water at 25 ��C. The steady numerical computation was considered to be converged as the maximal residual reached 1.0��10-4. The grid structure was fully hexahedral structured with local refinement, as shown in Fig. 3. Six cases with different numbers of cells were numerical calculated to perform the grid sensitivity study, in which the mass flow rate on inlet was fixed as Qn. Figure 4 shows the change of predicted head value with the increase of cell number. It is obvious that the head value starts to be stable at the third point in Fig. 4, which corresponds to the grid number of 712980, so grid with that cell number was used for further computation with consideration of both time cost and result accuracy.
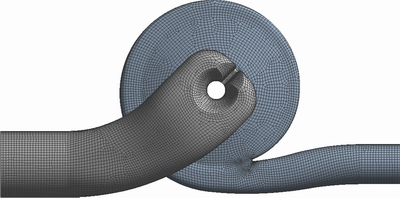
Fig. 3 Grid computational model
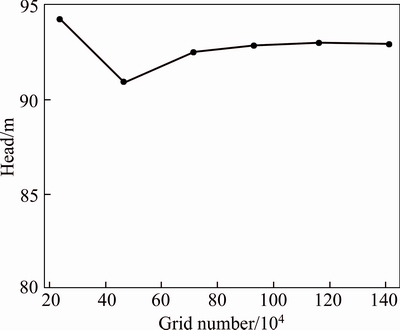
Fig. 4 Predicted head value versus grid number
Five different flow rates, 0.8Qn, 0.9Qn, Qn, 1.1Qn and 1.2Qn were specified in order to numerically predict the flow capacity-head curve (Q-H) and capacity- efficiency (Q-��) curve of the pump. The efficiency �� (%) is calculated as
 (7)
(7)
where H represents head (m); Q is the volume flux (m3��s-1); n is the rotation speed (rev��min-1); T is the torque (N��m) acts on the main shaft.
3.3 Experimental verification
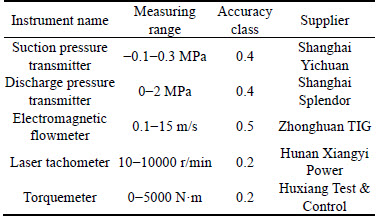
An experimental test was carried out according to ISO 9906��2012 standard with a Grade 2 accuracy [16], which was commonly adopted for industrial pumps. Transmission medium for test was clean cold water. The technical specifications and suppliers of test instruments are listed in Table 2, and details for experimental set up and test procedure could be got in Ref. [17].
Table 2 Technical specifications and suppliers of test instruments
4 Results and discussion
Before any discussion of the flow structures of the flow field developed in the studied pump, a comparison of the computational and experimental Q-H and Q-�� curves is shown in Fig. 5. The predicted performance curves by CFD generally agree well with the tested curves over a wide flow range, and it reaches the maximal value at the flow rate around 0.172 m3/s (Qn) for both the calculated and tested Q-�� curves, which can be considered the design load point.
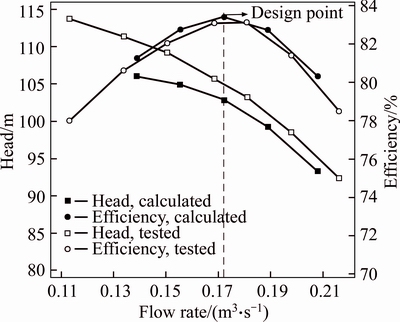
Fig. 5 Calculated and tested pump performance curves
The predicted efficiency at Qn point is as high as 83.42%, while it falls obviously when the flow rate increases or decreases. The predicted efficiency drops to 81.26% for the 0.8Qn point and 80.31% for the 1.2Qn point. The reason for the efficiency reduction lies into the flow structures change under off-design conditions, which can be better explored by adopting the differential amplification method.
Three different operation points, 0.8Qn, Qn and 1.2Qn points were selected as typical cases for flow structure analysis. Firstly, the velocity vector distribution on the mid-plane of above three points is shown in Fig. 6 as an example to demonstrate the shortness of flow structures display by single isolated case. Figure 6 shows that on all three operation points, there is flow separation phenomenon in the diffuser pipe. But the flow structures of them caused by flow separation are different. A section near the volute tongue of diffuser pipe was chosen for key discussion, and it was marked by rectangular dotted box. For the marked section, main flow dominates the center region in Fig. 6(b), while it deviates from the center line and flows more to the upper area (in Fig. 6(a)) or down area (in Fig. 6(c)) near the pipe wall, which may induce more friction loss and cause the efficiency decrease. Moreover, the vector in Fig. 6(b) seems to be more even than that in the rest two operating points.
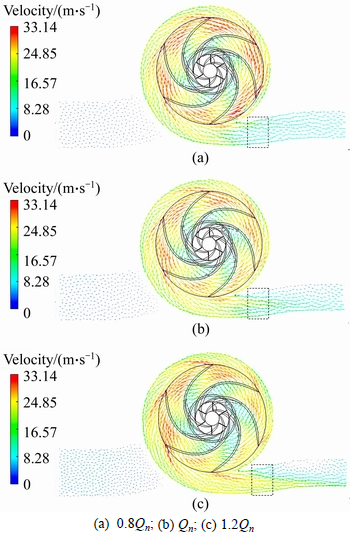
Fig. 6 Velocity vector distribution on mid-plane:
However, it is difficult to get clear and sufficient information about the flow structures difference with the above comparison. Next, with flow field on the Qn operation point as the datum for consistency, velocity difference vector distribution obtained by differential amplification method is shown in Fig. 7. Average values of the velocity difference are 1.52 m/s (for Fig. 7(a)) and 1.48 m/s (for Fig. 7(b)) respectively, which are only within one order of magnitude of each original velocity, so the amplification of numerical calculation residuals can be ignored. Note that the direction of most vectors in Fig. 7(a) is opposite relative to ordinary flow situation, because the flux of minuend object (Qn) is larger than that of the subtractor (0.8Qn).

Fig. 7 Velocity difference vector distribution on mid-plane:
There are few flow structure changes in the suction region on the off-design points. Because the structure of suction section is relatively smooth and straight, and fluid flow in that region is mainly driven by negative pressure made by impeller motion, so the increase of flow rate will not cause obvious change of flow direction. However, due to the complicated second flow caused by impeller rotation and the interaction between blade and volute tongue, the flow structures in the impeller region and pumping volute change significantly on off-design points. In Fig. 7(a), the velocity difference between 0.8Qn and Qn points is much larger in Passage 6 than that in the rest passages, which induces much disturbance in the junctional zone of blade VI and volute tongue, and the disturbance extends to the diffuser pipe. While in Fig. 7(b), velocity difference vector between 1.2Qn and Qn points is relatively well proportioned in each passage within the impeller region, and it is slightly larger only in passage V and passage VI. The velocity difference gets the maximum near the lower tube wall in the middle section of the diffuser pipe marked with rectangular dotted box, thus adjusting curvature of the inner wall in that area may help to get higher efficiency on over-load working condition.
Besides the vector distribution comparison, it can also achieve a good resolution to apply the differential amplification method to analyze the contour map containing flow field information. The normal component of velocity curl difference contour on the mid-plane is shown in Fig. 8. Velocity curl is a trivector describing the infinitesimal rotation of a three- dimensional vector field, and it reflects the fluid rotation speed and energy dissipation of eddy flow. For the velocity vector U=(u, v, w), its velocity curl �� can be calculated as
 (8)
(8)
where i, j and k are the vector units of the x, y and z coordinates, respectively. The unit of velocity curl is s-1. In Fig. 8, the normal component of velocity curl difference is the z-component of the curl as the mid-plane locates on the x-y plane. The area where the velocity curl is greater than 0 denotes that the fluid rotates clockwise on the plane, otherwise its rotation is anti-clockwise. In Fig. 8(a), it is easy to find that the normal component of velocity curl in the near wall area of the volute tongue is especially high and its opposite wake region of blade IV becomes much less when the flux drops to the under-load condition.
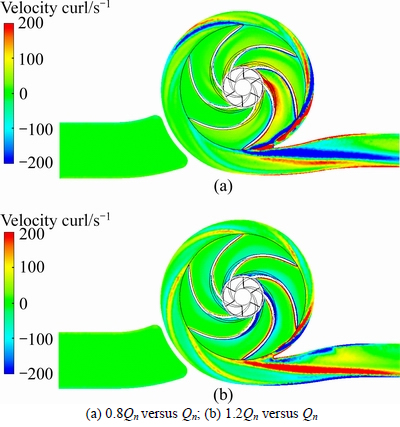
Fig. 8 Normal component of velocity curl difference contour on mid-plane:
An unexpected finding is that on the pressure surface of blade VI, the fluid rotates faster when the operation point changes into the 0.8Qn from Qn, which may come from the influence of the interaction between volute tongue and blade VI. The contour in passages of the impeller region of Fig. 8(b) is more uniform than that of Fig. 8(a), and contour value in the wake region of each blade is roughly equal. So, it can be inferred that the added flux is evenly spread by all the six blades approximatively when the operation point moves to 1.2Qn from Qn. In both Figs. 8(a) and (b), the wake region of blade VI is significant, which extends to the volute exit and dominates the diffuser pipe region.
A possible explanation for flow structure changes on off-design points is that, there is an optimal flow rate matching the fluid domain and rotation speed of the pump, and sensitivity of each design parameter on the flow structures is different. Thus, the differential amplification method provides an effective tool for locating the sensitive spots of pumps with case comparisons and guiding the further optimization for wider high efficiency working condition.
5 Conclusions
1) This work focuses on proposing a new way named the differential amplification method for the observing of flow field results, thus better and clearer flow structures contrastive analysis can be applied. Numerical investigation of the flow field of a centrifugal pump on different operating points with this method proved the resolving capability of it.
2) Compared with design point, the flow structure characteristics of CFD results becomes different when the centrifugal pump operates on off-design point, and this phenomena is especially obvious for the region near the volute tongue and the blade wake region in pumping volute. Applying the differential amplification method for multifactor analysis is prospective to reveal the latent relationship between flow structures and engineering design data.
References
[1] XIA Mi-mi, LAI Xi-de, LUO Bao-jie, LI Jing-yue. Research on inner flow field of centrifugal pump with splitter blades [J]. Journal of Engineering for Thermal Energy & Power, 2015, 30(4): 598-604. (in Chinese)
[2] SONG Peng-yun, HE Peng-cheng. Characteristics of internal flow and pumping performance for conical blade pumping ring [J]. Journal of Drainage and Irrigation Machinery Engineering, 2015, 33(4): 327-332. (in Chinese)
[3] JIANG Y Y, YOSHIMURA S, IMAI R, KATSURA H, YOSHIDA T, KATO C. Quantitative evaluation of flow-induced structural vibration and noise in turbomachinery by full-scale weakly coupled simulation [J]. Journal of Fluids and Structures, 2007, 23: 531-544.
[4] KORCZAK A, MARTSYNKOVSKYY V, PECZKIS G, ZAHORULKO A. Diagnosis of the phenomenon of flow as an inspiration to inventions in the domain of constructing hydraulic machines [J]. Procedia Engineering, 2012, 39: 286-302.
[5] WU H, MIORINI R L, KATZ J. Measurements of the tip leakage vortex structures and turbulence in the meridional plane of an axial water-jet pump [J]. Experiments in Fluids, 2011, 50(4): 989-1003.
[6] PEDERSEN N, LARSEN P S, JACOBSEN C B. Flow in a centrifugal pump at design and off-design conditions-Part I: Particle image velocimetry(PIV) and laser doppler velocimetry(LDV) measurement [J]. ASME Journal of Fluid Engineering, 2003, 125: 61-72.
[7] LANGTHJEM M A, OLHOFF N. A numerical study of flow-induced noise in a two-dimensional centrifugal pump. Part I. Hydrodynamics [J]. Journal of Fluids and Structures, 2004, 19: 349-368.
[8] LANGTHJEM M A, OLHOFF N. A numerical study of flow-induced noise in a two-dimensional centrifugal pump. Part II. Hydroacoustics [J]. Journal of Fluids and Structures, 2004, 19: 369-386.
[9] LABIB M N, WOO J S, CHOI D Y, UTOMO T, FAJAR B, CHUNG H S, JEONG H M. Numerical assessment on improving multistage centrifugal impeller performance by changing inlet skew angle at impeller inlet [J]. Journal of Central South University, 2012, 19: 953-961.
[10] WANG Chun-lin, ZENG Cheng, YANG Xiao-yong, PENG Hai-bo, LIU Dong. Numerical simulation of internal flow field and performance prediction of reversible double suction pump [J]. Journal of Drainage and Irrigation Machinery Engineering, 2015, 33(7): 577-582. (in Chinese)
[11] ZHANG Ren-hui, GUO Rong, YANG Jun-hu, LI Ren-nian. Analysis of flow in vane diffuser and its optimization based on CFD method [J]. Journal of Drainage and Irrigation Machinery Engineering, 2015, 33(9): 762-767. (in Chinese)
[12] ZHANG De-sheng, SHI Wei-dong, ESCH B P M, SHI Lei, DUBUISSON M. Numerical and experimental investigation of tip leakage vortex trajectory and dynamics on an axial flow pump [J]. Computers & Fluids, 2015, 112: 61-71.
[13] GRAY P R, HURST P J, LEWIS S H, MEYER R G. Analysis and design of analog integrated circuits (5th Edition) [M]. New York: John Wiley & Sons, NY, USA, 2009.
[14] MENTER F R. Two-Equation eddy-visocity turbulence models for engineering applications [J]. AIAA Journal, 1994, 32(8): 1598-1605.
[15] ZHANG De-sheng, PAN Da-zhi, SHI Wei-dong, WU Su-qing, SHAO Pei-pei. Study on tip leakage vortex in an axial flow pump based on modified shear stress transport k-�� turbulence model [J]. Thermal Science, 2013, 17(5): 1551-1555.
[16] ISO 9906��2012. Rotodynamic pumps �� Hydraulic performance acceptance tests-Grades 1, 2 and 3 [S].
[17] KEAN W C, THONG S L, WINOTO S H. Numerical study of inlet and impeller flow structures in centrifugal pump at design and off-design points [J]. International Journal of Fluid Machinery and systems, 2011, 4(1): 25-32.
(Edited by DENG L��-xiang)
Cite this article as:
ZHANG He-hui, DENG Sheng-xiang, QU Ying-jie. Differential amplification method for flow structures analysis of centrifugal pump between design and off-design points [J]. Journal of Central South University, 2017, 24(6): 1443-1449.
DOI:https://dx.doi.org/10.1007/s11771-017-3548-zFoundation item: Project(2014GK3150) supported by Science and Technology Plan of Hunan Province, China
Received date: 2015-11-26; Accepted date: 2016-03-17
Corresponding author: ZHANG He-hui, PhD, Professor; Tel: +86-731-88879863; E-mail: hehuizhang@csu.edu.cn
Abstract: The three-dimensional internal flow field of centrifugal pump is complex and variable with design parameters and operation conditions. The post-processing technique named differential amplification method was proposed for the comparison study of different flow structures. The full steady flow fields of an industrial centrifugal pump working on-design and off-design points were numerically investigated by solving Reynolds average Navier-Stokes equations together with a shear-stress transport (SST) k-w turbulence model. And the numerically predicted performance curves of the studied pump agree well with test measurement results. Compared with the flow flied on design point under the help of differential amplification method, the disturbance caused by interaction between blade and volute tongue is very obvious and it extends to the diffuser pipe on the working point with 0.8 times rated flux. While on the point with 1.2 times rated flux, the flow distribution in impeller region is roughly even and it flows more to the bottom section of the diffuser pipe. The above method was proved to be good at displaying the subtle secondary flow structure changes with a higher resolution effect relative to single isolated case observation, which helps the optimization decision-making from multiple design cases.
