

Formation and evolution characteristics of bcc phase during isothermal relaxation processes of supercooled liquid and amorphous metal Pb
ZHOU Li-li1,2, LIU Rang-su1, TIAN Ze-an1, LIU Hai-rong3,
HOU Zhao-yang4, ZHU Xuan-min1, LIU Quan-hui1
1.
2. Department of Information Engineering,
3.
4. Department of Applied Physics, Chang��an University,
Received 6 July 2010; accepted 22 November 2010
Abstract:
The formation and evolution characteristics of bcc phase during the isothermal relaxation processes for supercooled-liquid and amorphous Pb were investigated by molecular dynamics simulation and cluster-type index method (CTIM). It is found that during the relaxation process, the formation and evolution of bcc phase are closely dependent on the initial temperature and structure. During the simulation time scale, when the initial temperature is in the range of supercooled liquid region, the bcc phase can be formed and kept a long time; while it is in the range of glassy region, the bcc phase can be formed at first and then partially transformed into hcp phase; when it decreases to the lower one, the hcp and fcc phases can be directly transformed from the glassy structure without undergoing the metastable bcc phase. The Ostwald��s ��step rule�� is impactful during the isothermal relaxation process of the supercooled and glassy Pb, and the metastable bcc phase plays an important role in the precursor of crystallization.
Key words:
supercooling liquid; amorphous metal Pb; isothermal relaxation process; bcc phase transformation; molecular dynamics simulation;
1 Introduction
It is well known that the supercooled liquid and amorphous metals are thermodynamically unstable, which will undergo structural rearrangements and transform into crystalline structures during isothermal relaxation processes. Though this subject has been studied extensively by means of simulations[1-3] and experiments[4-5], many problems still have not been fully understood, such as, the formation and evolution mechanisms of metastable bcc phase during the isothermal relaxation process for many metals are still a mystery.
For a long time, a lot of works have been interested in the metastable bcc phase since it is often formed before a stable crystal structure occurrence during the solidification process[6-11]. The well known ��step rule�� proposed by OSTWALD[6] suggests that the phase formed at first is not necessarily to the thermodynamically stable one, but rather to the one with free energy closest to the liquid phase. Thereafter, the ��step rule�� was re-examined by STRANSKI and TOTOMANOW[7] who argued that the phase with the lowest free energy barrier to nucleate is the first one formed. ALEXAMDER and McTAGUE[8] suggested that for very general symmetry considerations the metastable bcc phase is uniquely favored in the supercooled liquid. A theoretical study by KLEIN and LEYVRAZ[9] employing a long-range potential model also demonstrated that the metastable bcc phase can be easily obtained rather than the equilibrium fcc structure.
In fact, some metals[10-12] have been confirmed that in which the metastable bcc phase in deed can be formed at first during their solidification processes. In our simulation studies, it was also found that during the rapid cooling processes of liquid metals of Ag[13] and Pb[14], the metastable bcc phase was indeed formed at first and then crystallized into the hcp and fcc phases. These results are meaningful for searching the formation conditions of metastable bcc phase and the most effective solidification technique.
However, at present, the formation and evolution characteristics of bcc phase during the isothermal relaxation processes with different initial temperatures in the supercooled liquid, especially in amorphous metals are still not be deeply understood. Accordingly, the main purpose of this work is to study the formation and evolution characteristics of bcc phase during the isothermal relaxation processes of supercooled liquid and amorphous metal Pb, by using molecular dynamics method, and adopting the cluster-type index method (CTIM)[15-17], visual analysis method and so on.
2 Description of methods
2.1 Computational details
Our MD simulations are performed with a system consisting of 10 000 Pb atoms in a cubic box under periodic boundary conditions. The interactions among atoms are calculated via the effective pair potential function of the generalized energy independent nonlocal model pseudo-potential which was developed by WANG et al[18-19]. And the function is
![]() (1)
(1)
where Zeff is the effective ionic valence and F(q) is the normalized energy wave number characteristic, and both of them were defined in detail in Refs.[18] and [19]. The pair potential is cut off at
The simulation calculation is started at 1 173 K (the equilibrium melting point of Pb is 600 K). First of all, let the system run 40 000 time steps to obtain an equilibrium liquid state (the criterion of equilibrium state is the changing degree of energy in the system close to zero). Subsequently, the damped force method (also called the Gaussian thermostat) is used to control the system temperature, which is cooled down to some desired temperatures with a cooling rate of 1��1013 K/s (results for the quenching process will be presented in the section of 3.1). At each selected temperature, another 300 000 time steps were performed under isothermal and isochoric (NVT) condition to investigate the structure and dynamic characteristics. For each temperature, 30 configurations were recorded, each one for 10 000 time steps, for analyzing the microstructure evolutions during their isothermal relaxation processes.
2.2 Microstructure analysis methods
The pair distribution function g(r) is mainly used to describe the statistical distributions of the atoms in the system. Recently, it has been widely used to describe the structural changes between liquid, amorphous and crystalline structures. It is defined as follows[20]:
 (2)
(2)
where L is the cell length of the cubic box; Ni and Nj are the numbers of atoms i and j, respectively; gij(r) is the probability of finding an atom in the sphere shell ranging from r to r+��r, where ��r is the step for calculation.
The Honeycutt-Anderson (HA) bond-type index method[21] has been widely used to describe the microstructure evolution during the rapid solidification process. In this technique, a pair of atoms is taken as a bond pair, if their distance is less than the distance of the first minimum in the pair distribution function. Four integers (indices) i, j, k and l are used to describe different microstructures. The first integer i is 1 if the pair of atoms is bonded or 2 otherwise. The second integer j represents the number of the near neighbors shared by the pair of atoms. The third integer k is the number of the bonds between the shared neighbors. The fourth integer is used to distinguish the structures with the same first three integers but with different configurations. Various atomic bonds can be used to characterize different local structures. The 1551, 1541 and 1431 are the characteristic bond-types of typical liquid and amorphous states; the 1441 (6) and 1661 (8) are the characteristic bond-types of bcc crystal; the 1421 (12) is the characteristic bond-type of fcc crystal; while for the hcp crystal, the characteristic bond-types are 1421 (6) and 1422 (6) bond-types. For convenience of discussion, in this work, 1551, 1541, and 1431 are called amorphous-like bond-types; 1441 and 1661 are called bcc-like bond-types; 1421 and 1422 are called hcp-like bond-types.
As well known that different combinations of bond-types can form different cluster configurations; however, the HA bond-type indices cannot be used to describe and discern different basic clusters formed by an atom with its nearest neighbors, especially, the different nano-clusters formed by some different basic clusters. In order to overcome this difficulty, based on the work of QI and WANG[22], the cluster-type index method (CTIM)[15-17] was proposed which is widely used to describe different cluster structures[23-27].
In CTIM, four indices are adopted to describe a basic cluster. The meanings of the four indices are as follows: the first index represents the total number of surrounding atoms (i.e., the coordination number Z of the central atom), which form a basic cluster along with the central atom; the second, third and fourth integers denote, respectively, the numbers of 1441, 1551 and 1661 bond-types by which the surrounding atoms are connected with the central atom of the basic cluster.
The CTIM can be used to effectively describe the liquid, amorphous, and bcc crystal structures. However, the fcc basic cluster consisted of twelve 1421 bond-types, and the hcp basic cluster consisted of six 1421 bond-types and six 1422 bond-types could not be clearly described by CTIM. Accordingly, for clearly describing the crystal basic clusters (containing hcp and fcc basic clusters), two indices (namely, the fifth and the sixth ones, which represent the numbers of 1421 and 1422 bond-types in a basic cluster, respectively) are added to the CTIM. For short, the CTIM with six indices is called as CTIM-2[13, 24-25]. In the CTIM-2, the bcc basic cluster can be expressed as (14 6 0 8 0 0), it means that the central atom has 14 near neighbors, and six of them connected with the central atom by 1441 bond-types; and eight of them connected with the central atom by 1661 bond-types. While the fcc and hcp basic clusters can be expressed as (12 0 0 0 12 0) and (12 0 0 0 6 6) respectively. The snapshots for three typical clusters in our simulation are shown in Fig.1, in which the central atoms of the bcc, hcp and fcc basic clusters are numbered 2226, 7675 and 1061, respectively.
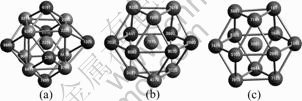
Fig.1 Snapshot of typical bcc, hcp and fcc basic clusters (for clarity, all bonds between central atoms and the neighbors are omitted): (a) A bcc basic cluster (14 6 0 8 0 0) with central atom of 2226; (b) An hcp basic cluster (12 0 0 0 6 6) with central atom of 7675; (c) An fcc basic cluster (12 0 0 0 12 0) with central atom of 1061
3 Results and discussion
3.1 Evolutions of average energy per atom and pair distribution function during quenching process
In order to detect the subsequent structure of the rapid solidification process of liquid Pb, the relations of the average energy per atom and the pair distribution function (PDF) with temperature are shown in Figs.2 and 3, respectively. From Fig.2, it can be seen that, there are twice changes in the slope of average energy curve with decreasing temperature: the first one is at about 600 K, corresponding to the melting point Tm of metal Pb, indicating the system into the supercooled liquid region; the other one is at about 253 K, corresponding to the glass transition Tg, indicating the system into the glassy region. Therefore, the final state of the quenched system is in a glassy region.
From Fig.3, it can be seen that a slight split in the second peak has been formed when the temperature decreases to 253 K, it is well known that the split of the second peak of g(r) just indicates a glass transition. Therefore, the whole quenching process of the system can be divided into three stages: the liquid (T��600 K), the supercooled liquid (600 K��T>253 K) and the glassy (T��253 K) regions. In addition, the g(r) curve obtained in this simulation is in good agreement with the experimental result obtained by WASEDA[20] at 613 K. From this, it can be considered that the effective pair potential function adopted here is successful for reflecting the objective physical nature of microstructure of this system.
Moreover, we have calculated the self-diffusion constant D, from the atomic mean square displacement by
![]() (3)
(3)
The self-diffusion constants D obtained from our simulations are also in good agreement with experimental values. For example, the calculated self-diffusion constant D (��1.79��10-
3.2 Evolutions of average energy per atom during relaxation processes at different initial temperatures
The relationships between the average energy per atom and relaxation time at different initial temperatures (in the range of 373-113 K) are shown in Fig.4. It can be seen that when the initial temperature is above 373 K, there is no phase transition because the average energy per atom is nearly constant values during the whole relaxation process. When T��353 K, two temperature regions of relaxation can be defined by the time dependence of average energy per atom as follows.
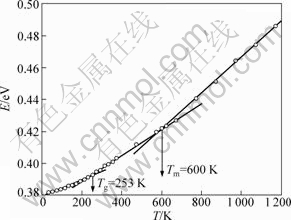
Fig.2 Relationship between average energy per atom and temperature during quenching process of liquid Pb
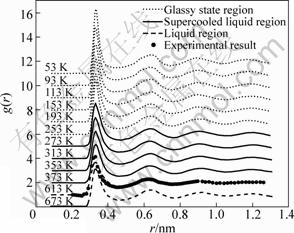
Fig.3 Changes of pair distribution function during quenching process of liquid Pb
In the range of 273 K��T��353 K, as shown in Fig.4(a) (we call it as supercooled liquid region, since the initial states of the system are in supercooled liquid state), for each initial temperature, the average energy curve has a distinct and rapid drop at first and then levels off to a itself constant value. With lowering the initial temperature, the last energy is lower, and these curves have no crossing points. However, in the range of 113 K��T��253 K, as shown in Fig.4(b) (we call it as glassy region, the initial states of the system are in glassy state), the average energy curves have a slower decrease and for a longer time, and they have some crossing points, so this is a complex region. For the lower initial temperatures, the last average atomic energies are not always in the lower level and for a longer time. However, going further, we want to know the details of the structural evolutions corresponding to the decrease of average energy per atom during the isothermal relaxation processes.
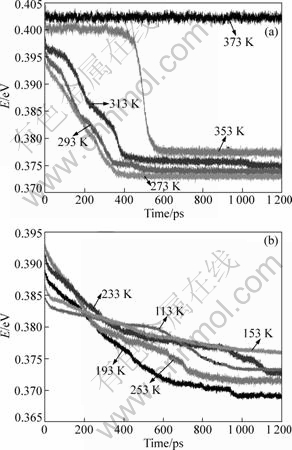
Fig.4 Relations of average energy per atom of system with relaxation time at given initial temperatures: (a) 273 K��T��373 K (supercooled liquid region); (b) 113 K��T��253 K (glassy region)
3.3 Structural evolutions during isothermal relaxation processes
The relationships between the relative numbers of main bond-types and relaxation time for different initial temperatures are shown in Fig.5. It can be clearly seen that for each initial temperature, the system is started with a great number of 1551, 1541 and 1431 bond-types related to disorder structures; however, with the increase of relaxation time, the numbers of these bond-types are decreased, and the numbers of 1441, 1661 bond-types related to bcc structure (and 1421 and 1422 bond-types related to fcc and hcp structures) have different evolution rules for different initial temperatures. Such as in the supercooled liquid region, as shown in Figs.5(a)-(c), as the numbers of amorphous-like bond-types of 1551, 1541 and 1431 decrease, the numbers of bcc-like bond-types of 1441 and 1661 increase rapidly and keep at a high proportion level; meanwhile, the numbers of fcc-like and hcp-like bond-types of 1421 and 1422 decrease to about 2%; all the bond-types remain nearly

Fig.5 Relationships between relative numbers of various bond-types and relaxation time at given initial temperatures: (a) 313 K; (b) 293 K; (c) 273 K; (d) 253 K; (e) 233 K; (f) 193 K; (g) 153 K; (h) 113 K
constant for a long time in the incubation time. These are consistent with the evolution processes of average energy per atom during the relaxations as above mentioned in Fig.4(a).
While in the glassy region, as shown in Figs.5(d)-(h), the variations of the relative numbers of those bond-types become more complex. For initial temperatures of 253 and 193 K, the numbers of 1441 and 1661 bond-types increase to a maximum at first and then decrease to a certain value, but the numbers of 1421 and 1422 bond-types increase simultaneously. As for the initial temperatures of 153 and 113 K, the bcc-like bond-types have only a slow increase in the whole relaxation process, while the fcc-like and hcp-like bond-types increase more rapidly and the amorphous-like bond-types decrease to a low proportion, indicating that the bond-types of bcc, hcp and fcc structures increase simultaneously. In the end, especially for 113 K, the number of the fcc and hcp bond-types is almost over that of the bcc bond-types in the system.
Going further, in order to directly and clearly see the microstructure evolutions during the isothermal relaxation processes, by using the CTIM-2, the relations of the numbers of bcc, hcp and fcc basic clusters with relaxation time at different initial temperatures are shown in Fig.6. From Fig.6, it can be more clearly seen that, it can be divided into three regions according to the structure evolution characteristics during the isothermal relaxation process: (I) in the supercooled liquid region, as shown in Figs.6(a)-(c), the system has rapidly crystallized into bcc phase and keeps it to the end; (II) while in the glassy region of Figs.6(d)-(f), at temperature between 193 K and 253 K, the system first crystallizes into dominate metastable bcc phase and is stable for some time, and then the hcp basic cluster increases at the expense of the bcc basic cluster, at last, the system is frozen into a bcc and hcp coexist structure; (III) and in the glassy region of Figs.6(g)-(h), as temperature decreases to 153 K and 113 K, all the three types of basic clusters of bcc, hcp and fcc increase simultaneously, especially for 113 K, the number of the hcp basic cluster has over that of the bcc basic cluster in the system.
What is the reason for these results? We think it can be easily understood with the viewpoint of free energy barrier[7-8] as follows: (I) in the supercooled liquid region, the bcc phase is the dominant one with lower free energy barrier, consequently, it can be formed at first and keeps stable in our simulation time scale; (II) as the temperature decreases to 253 and 193 K, the free energy barrier of bcc phase is only a little lower than that of the hcp or fcc phases, so that, the bcc phase can be firstly formed and keeps stable for a while; however, since the difference in free energy barrier between bcc and hcp phases is small, a little local structure fluctuation may lead to the bcc structure partially transformed into hcp structure, that is to say, the OSTAWALDS ��step rule�� is still valid in the isothermal crystallization process of glassy Pb; (III) especially, as temperature decreases to 153 K and 113 K, the difference in free energy barrier among these three phases is very small, so that all the three types of basic clusters increase simultaneously, the hcp and fcc structures have become more and more important ones and can be transformed directly from the glass structure without undergoing the metastable bcc phase.
It is well known that the thermodynamically stable phase of metal Pb is fcc structure at room temperature and room pressure, so the bcc phase Pb should be eventually transformed into the fcc phase. However, in this simulation, the complete transformation of the bcc phase into the inherent fcc phase has not been observed due to the relaxation time being so short (only 1 200 ps). Anyway, from Figs.6.(d)-(h), it can be clearly seen that the transformation trends to hcp and fcc structures have been realized at the expense of bcc structures or directly from the glassy structures.
3.4 3D views of metastable bcc phase during crystallization processes
In order to give an intuitionistic picture for the phase transitions mentioned above in glassy region, the 3D views for the configurations of bcc, hcp and fcc central atoms at different initial temperatures and different relaxation times are shown in Fig.7. From Fig.7, it can be clearly seen that for different initial temperatures and relaxation times, their structure evolution behaviors are very different from each other. For example, for initial temperature 253 K, at 760 ps, only the bcc structure is dominated in the system and then the hcp structure coexists with bcc structure and appears at 1 200 ps, as shown in Figs.7(a) and (b). But for 233 K, the hcp structure is formed after 720 ps, and coexists with bcc structure; and at 1 200 ps, the bcc structure is dominated in the system because of its rapid increase at the expense of hcp structure, as shown in Figs.7(c) and (d). While for 193 K, the structure fluctuation between bcc and hcp is more obvious (see Figs.7(e) and (f)), the previous formed hcp structure is transformed into bcc structure and the new hcp structure forms. And for 153 K and 113 K, the bcc, hcp and fcc crystal clusters are inlaid randomly in the system, and the clusters are coarsening with increasing relaxation time, as shown in Figs.7(g)-(j).
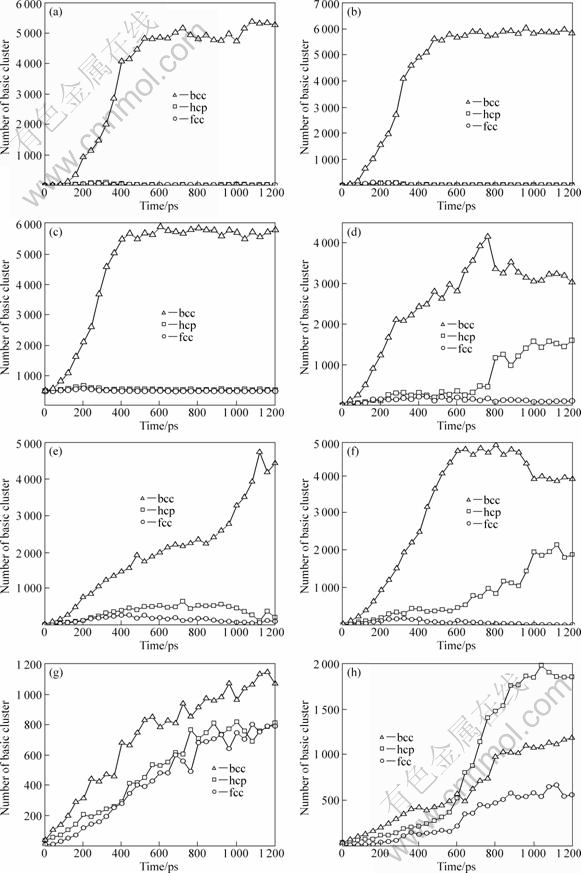
Fig.6 Relations of numbers of bcc, hcp and fcc basic clusters with relaxation time at different initial temperatures: (a) 313 K; (b) 293 K; (c) 273 K; (d) 253 K; (e) 233 K; (f) 193 K; (g) 153 K; (h) 113 K
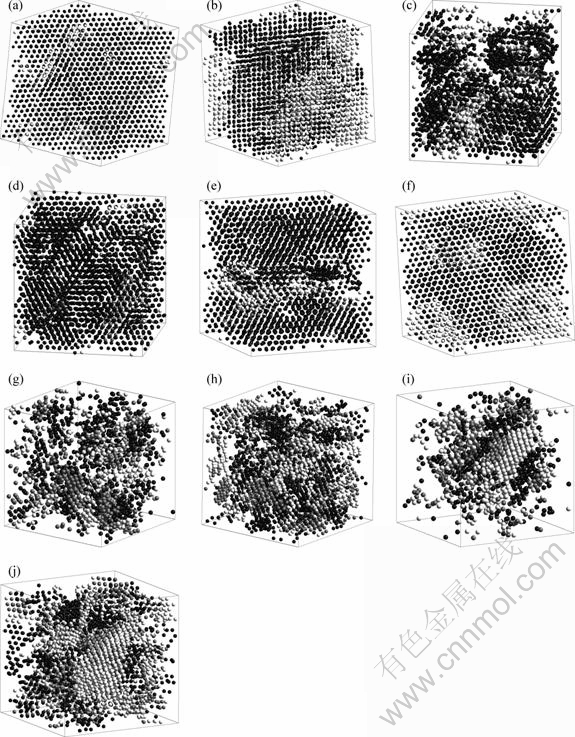
Fig.7 3D views for bcc, hcp and fcc crystal structures at given temperatures and relaxation time: (a) 253 K (760 ps); (b) 253 K(1 200 ps); (c) 233 K (720 ps); (d) 233 K(1 200 ps); (e)193 K(600 ps); (f) 193 K (1 200 ps); (g) 153 K (640 ps); (h) 153 K (1 200 ps); (i) 113 K(640 ps); (j) 113 K (1 200 ps); Black, write and gray balls denotes bcc, hcp and fcc central atoms respectively. Snapshots at the same temperature are viewed from the same visual angle (except for snapshots at 253 K)
4 Conclusions
1) During the isothermal relaxation processes of supercooled liquid and gassy Pb, the formation and evolution of bcc phase is closely dependent on the initial temperature and structure. In our simulation time scale, when the initial temperature is in the supercooled liquid region, the metastable bcc phase can be formed at first and kept for a long time; as it is in the glassy region, the bcc phase can be formed at first and then partially transformed into hcp phase; as it is in the lower region of 153 K and 113 K, the hcp and fcc phases can be transformed directly from the glass structure without undergoing the metastable bcc phase, since the free energy barrier for forming hcp and fcc phases have been decreased.
2) The above results validate that the OSTWALD��s ��step rule�� is still impactful during the isothermal relaxation process of supercooled and glassy Pb, and the metastable bcc phase plays an important role in the precursor of crystallization.
References
[1] CHEN Fang-fang, ZHANG Hai-feng, QIN Feng-xiang, HU Zhuang-qi. Molecular dynamics study of atomic transport properties in rapidly cooling liquid cooper [J]. J Chem Phys, 2004, 120: 1826-1831.
[2] PANG H, JIN Z H, LU K. Relaxation, nucleation, and glass transition in supercooled liquid Cu [J]. Phys Rev B, 2003, 67: 094113.
[3] ZHANG Yan-ning, WANG Li. WANG Wei-min. Thermodynamic, dynamic, and structural relaxation in supercooled liquid and glassy Ni below the critical temperature [J]. J Phys Condens Matter, 2007, 19: 196106.
[4] WANG Wei-hua, WU E, WANG R J. Phase transformation in a Zr41Ti14Cu12.5Ni10Be22.5 bulk amorphous alloy upon crystallization [J]. Phys Rev B, 2002, 66: 104205.
[5] HIRATA A, HIROTSU Y, AMIYA K, INOUE A. Crystallization process and glass stability of an Fe48Cr15Mo
[6] OSTWALD W. Studien uber die bildung und umwandlung fester korper [J]. Z Phys Chem. 1897, 22: 289-293.
[7] STRANSKI I N, TOTOMANOW D. Seed formation speed and Ostwald��s step rule [J]. Z Phys Chem, 1933, 163: 399-408.
[8] ALEXAMDER S, McTAGUE J P. Should all crystals be bcc? Landau theory of solidification and crystal nucleation [J]. Phys Rev Lett, 1978, 41: 702-705.
[9] KLEIN W, LEYVRAZ F. Crystalline nucleation in deeply quenched liquids [J]. Phys Rev Lett, 1986, 57: 2845-2848.
[10] CECH R E. Evidence for solidification of a metastable phase in iron-nickel alloys [J]. Trans HIME, 1956, 206: 585-589.
[11] MANDAL P, TIWARI R S, SRIVASTAVA O N. bcc metastable phase coexisting with the icosahedral phase in rapidly quenched Fe28Ti68Si4 alloys [J]. Phys Rev B, 1991, 44: 11683-11688.
[12] TEN WOLDE P R, RUIZ-MONTERO M J, FRENKEL D. Numerical calculation of the rate of crystal nucleation in a Lennard-Jones system at moderate undercooling [J]. J Chem Phys, 1996, 104(24): 9932-9947.
[13] TIAN Ze-an, LIU Rang-su, ZHENG Cai-xing, LIU Hai-rong, HOU Zhao-yang, PENG Ping. Formation and evolution of metastable bcc phase during solidification of liquid Ag: A molecular dynamics simulation study [J]. J Phys Chem A, 2008, 112: 12326-12336.
[14] ZHOU Li-li, LIU Rang-su, HOU Zhao-yang, TIAN Ze-an, LIN Yan, LIU Quan-hui. Simulation study of effects of cooling rate on evolution of micro-cluster structures during solidification of liquid Pb [J]. Acta Phys Sin, 2008, 57(6): 3653-3660. (in Chinese)
[15] LIU Rang-su, LI Ji-yong, DONG Ke-jun, ZHENG Cai-xing, LIU Hai-rong. Formation and evolution properties of clusters in a large liquid metal system during rapid cooling processes [J]. Mater Sci Eng B, 2002, 94: 141-148.
[16] LIU Rang-su, DONG Ke-jun, LI Ji-yong, YU Ai-bing, ZOU Ri-ping. Formation and description of nano-clusters formed during rapid solidification process of liquid metals [J]. J Non-Cryst Solids, 2005, 351: 612-617.
[17] YI Xue-hua, LIU Rang-su, TIAN Ze-an, HOU Zhao-yang, LI Xiao-yang, ZHOU Qun-yi. Formation and evolution properties of clusters in liquid metal copper during rapid cooling processes [J]. Transactions of Nonferrous Metals Society of China, 2008, 18(1): 33-39.
[18] WANG S, LAI S K. Structure and electrical resistivities of liquid binary alloys [J]. J Phys F Met Phys, 1980, 10(12): 2717-2737.
[19] LI D H, LI X R, WANG S. Variational calculation of Helmholz free energies with applications to the sp-type liquid metals [J]. J Phys F Met Phys, 1986, 16(3): 309-321.
[20] WASEDA Y. The structure of non-crystalline materials [M].
[21] HONEYCUTT J D, ANERSON H C. Molecular-dynamics study of melting and freezing of small Lennard-Jones clusters [J]. J Phys Chem, 1987, 91(19): 4950-4963.
[22] QI D W, WANG S. Icosahedral order and defects in metallic liquids and glasses [J]. Phys Rev B, 1991, 44(2): 884-887.
[23] HOU Zhao-yang, LIU Li-xia, LIU Rang-su, TIAN Ze-an. Simulation of evolution mechanism of microstructures during rapid solidification of Al-Mg alloy melt [J]. Acta Phys Sin, 2009, 58(7): 4817-4825. (in Chinese)
[24] TIAN Ze-an, LIU Rang-su, LIU Hai-rong, ZHENG Cai-xing, HOU Zhao-yang, PENG Ping. Molecular dynamics simulation for cooling rate dependence of solidification micstructures of silver [J]. J Non-Cryst Solids, 2008, 354: 3705-3712.
[25] LIU Hai-rong, LIU Rang-su, ZHANG Ai-long, HOU Zhao-yang, WANG Xing, TIAN Ze-an. A simulation study of microstructure evolution during solidification process of liquid metal Ni [J]. Chin Phys, 2007, 16(12): 3747-3753.
[26] ZHANG Jing-xiang, LI Hui, ZHANG Jie, SONG Xi-gui, BIAN Xiu-fang. Reverse Monte Carlo study on structural order in liquid and glassy AlFe alloys [J]. Chinese Physics B, 2009, 18(11): 4949-4954.
[27] LI Hui, BIAN Xiu-fang, WANG Guang-hou. Molecular dynamics study of the local order and defects in quenched states [J]. Phys Rev B, 2003, 67(9): 094202-7.
[28] NACHTRIEB N H. Self-diffusion in liquid metals [J]. Advances in Physics, 1967, 16(62): 309-323.
[29] TANIGAKI M, TOYOTA Y, HARADA M, EGUCHI W. Mutual diffusion coefficient in molten lead-bismuth mixtures [J]. J Chem Eng Jpn, 1983, 16: 92-98.
����Һ̬�ͷǾ�̬����Pb���³�ԥ������bcc����γɺ��ݱ�����
������1,2��������1������1��������3��������4��������1����ȫ��1
1. ���ϴ�ѧ ���������ӿ�ѧѧԺ����ɳ 410082��2. ����ҽѧԺ ��Ϣ����ѧԺ������ 341000��
3. ���ϴ�ѧ ���Ͽ�ѧ�빤��ѧԺ����ɳ 420082��4. ������ѧ Ӧ������ϵ������ 710064
ժ Ҫ�����÷��Ӷ���ѧģ�ⷽ�����Ŵ�����ָ�������Թ���Һ̬�ͷǾ�̬����Pb�ڵ��³�ԥ������bcc����γɺ��ݱ����Խ����о������������bcc����γɺ��ݱ������������³�ԥ���̵ij�ʼ�¶Ⱥͳ�ʼ�ṹ���ڹ���Һ̬����bcc��������γɲ���ģ��ʱ�䷶Χ�ڱ����ȶ������ڷǾ�̬����bcc�����γɲ����ת��Ϊhcp�࣬����ԥ�ij�ʼ�¶��ڽϵ͵�153 K��113 Kʱ��hcp��fcc���������bcc���ֱ���ڷǾ�̬�ṹ���γɣ���˵��Ostwald�ġ�����ԭ���ڹ���Һ̬�ͷǾ�̬Pb���³�ԥ����������Ч�ģ����ң�����bcc������Ҫ�ľ���ǰ�������á�
�ؼ��ʣ�����Һ̬���Ǿ�̬Pb�����³�ԥ���̣�bcc��ת�䣻���Ӷ���ѧģ��
(Edited by YANG Hua)
Foundation item: Projects (50831003, 50571037) supported by the National Natural Science Foundation of China
Corresponding author: LIU Rang-su; Tel: +86-731-88822817; E-mail: liurangsu@sina.com
DOI: 10.1016/S1003-6326(11)60755-3
