
J. Cent. South Univ. Technol. (2008) 15: 271-275
DOI: 10.1007/s11771-008-0050-7
![]()
Numerical simulation of busbar configuration in large aluminum electrolysis cell
LI Mao(�� ï), ZHOU Jie-ming(������)
(School of Energy Science and Engineering, Central South University, Changsha 410083, China)
Abstract:
Various busbar configurations were built and modeled by the custom code based on the commercial package ANSYS for the 500 kA aluminum electrolysis cell. The configuration parameters, such as side riser entry ratio, number of cathode bars connected to each riser, vertical location of side cathode busbar and short side cathode busbar, distance between rows of cells in potline, the number of neighboring cells, ratio of compensation busbar carried passing under cell and its horizontal location under cell along with large magnetohydrodynamic(MHD) computation based on the custom evaluation function were simulated and discussed. The results show that a cell with riser entry ratio of 11?9?8?9?11 and cathode busbar located at the level of aluminum solution, 50% upstream cathode current passing under cell for magnetic field compensation, the distance between rows of 50 m is more stable.
Key words:
numerical simulation; aluminum electrolysis cell; busbar configuration; magnetohydrodynamic��
1 Introduction
Busbar configuration plays one of the most significant roles in the new cell design, especially for the high amperage aluminum electrolysis cell and many advances have been made with the aid of computer software and hardware. DUPUIS et al[1-2] proposed the 500 kA aluminum electrolysis cell model based on the 300 kA prototype and discussed its coupled electro- magnetic, heat fields and magnetohy drodynamic(MHD) application. EL-DEMERDASH et al[3] employed the MHD stability rules for stable 203 kA cell design and busbar configuration modification. GUSEV et al[4] presented their mathematical models by modeling nonlinear dynamics of the metal-bath interface for MHD analysis and made their bubar optimization. At present, many MHD stability criteria have been proposed and applied to cell analysis and optimization[5-9]. It is an effective approach to combine MHD with busbar design for cell design optimization. The research on busbar configuration of real cell up to 500 kA or higher amperage has not been reported yet.
In this work, the busbar configuration of the virtual (soft) 500 kA cell was proposed and modeled based on the 300 kA cell and 500 kA cell presented in Refs.[1-2], various busbar configurations were simulated and assessed with available stability theories.
2 Calculation method
The magnetic field plays a primary role in the performance of aluminum electrolysis cell, and small variation of busbar configuration will greatly affect the multiple physical fields. In order to find the optimal magnetic fields under stable MHD data, the physic field components inside the cell, their space distributions and sources should be known before real cell construction. In this work, the custom computer code of 3D magnetic fields computation and stability computation based on commercial soft ANSYS was developed to determine the weight of parameters or segment of the busbar configuration.
2.1 Computation of magnetic fields
The computation of the electromagnetic fields is upon the assumption that the interface between metal-bath is flat and does not involve the complicated coupled interaction among the multiple physical fields in the cell such as thermal and fluid flow effect. The general magnetic scalar potential approach[10-11] was applied to calculating the magnetostatic field value according to Eqns.(1-2) and the current loads in the busbar were given before each computation.
![]() ?(��
?(��![]() ��g)-
��g)-![]() (��Hg)=0 (1)
(��Hg)=0 (1)
H=Hg-![]() ��g (2)
��g (2)
where H is the intensity of magnetic field, Hg is the initial intensity of magnetic fields and ��g is the generalized magnetic scalar potential. Hg can be calculated from the Biot-Savart law.
The configuration parameters and their combinations in the busbar configuration were modelled and computed to study their contribution to the fields value in detail via APDL (ANSYS parametric design language). It is advantageous to use the parametric design language to have the code integrated to carry out the preprocess and postprocess of the simulation.
2.2 MHD stability criteria
An overview of the MHD stability criteria in the Hall-Heroult process was reported in Ref.[12], in which certain MHD theories and mechanisms were reviewed. DESCLOUX et al[5] showed that the effects of stationary velocity fields and induced current on the cell stability are rather week to solve the linearized MHD equations with iterative method. The following rules were considered in the analysis except the above criteria:
1) SELE[6] considered that the vertical magnetic component interacting with horizontal current in the metal was the source of instability, that is, the averaged Bz should be as small as possible, and magnetic field should be symmetric.
2) URATA[7] pointed out that the horizontal gradient of vertical magnetic component should keep lower when interacting with horizontal current. The Bz and its spatial gradient were also regarded as the causes of MHD instability with shallow-water approximation[13].
3) MOREAU and ZIEGLER[8] also studied the horizontal current with disturbed horizontal magnetic fields and reached the conclusion of lowering the horizontal currents.
4) SEGATZ and DROSTE[14] did linear stability analysis of the cell, including the effect of both steady and transient magnetic fields and current distribution. The metal height, anode cathode distance(ACD), bath density and current disturbances have strong influences on the formation of instability. They found that it is beneficial to have kinetic energy transferred to cell distributed evenly in space.
The objective of MHD study is to create a busbar design that can have the interface waves in the metal pad damped at most. In present work, the combination of the above rules was taken as stability criteria to evaluate the MHD stability of different busbar configurations, but it is not easy to lower the horizontal current for the cell with increasing current up to 500 kA and enlarged size. A custom evaluation function is set as
![]() (3)
(3)
where L is the unit length. The function is a linear combination of the three magnetic field components and horizontal gradient in the metal pad, while each coefficient is set by considering the weight in the MHD stability criteria above and can be adjusted or include more factors according to the requirement, and the function value is the objective to be minimized for feasible and optimal busbar configuration parameters.
3 Calculation results and discussion
The overview of the busbar configuration of the cell is shown in Fig.1, where the current conductor is modeled as line element using SOURC36 element, and it is convenient and no need to mesh the whole cell and great cost can be reduced when running the solution iteratively. The followings are the computation results and analyses under different configuration parameters.
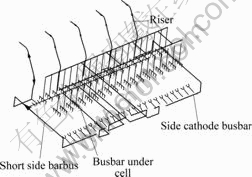
Fig.1 Schematic diagram of busbar configuration
3.1 Side riser entry ratio
The 500 kA side by side electrolysis cell was modeled and calculated with five side entry risers connected with different numbers of cathode bars and equally spaced with symmetry to determine which combination of the entry ratio can lower the vertical magnetic component and the evaluation function value. The cathode busbars were all set at the same level. It is shown in Fig.2 that at the five riser entry ratio of 11?9?8?9?11 the lower value of either Bz or function f can be obtained, the unequally delivered riser current may show better performance of magnetic field and the central riser should carry current not more than 25%. It should be noted that the data in all figures are absolute values without sign for simplicity.
3.2 Vertical location of cathode busbar
The side cathode busbar that carries current from the cathode bar ends and extends round the cell ends plays significant effect on the magnetic field[15]. In this analysis, the vertical location of the side cathode busbar was limited to the interval from 1.6 to 2.7 m once the side riser ratio is fixed, the location was elevated 0.1 m higher than the last one in each run to find the optimum. It can be seen from Fig.3 that a location interval with good stability is higher than 2.3 m; the function f will
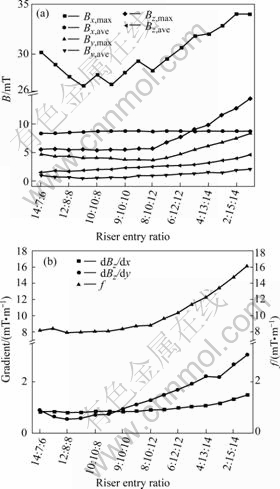
Fig.2 Magnetic induction vs riser entry ratio: (a) Magnetic induction; (b) Horizontal gradient and f
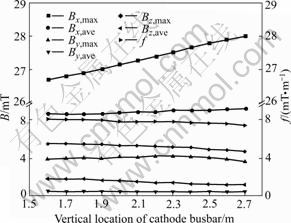
Fig.3 Magnetic induction vs cathode busbar location
become smaller when the side busbar is located at the level of metal pad among these computations.
The value of short side busbar location in Fig.4 is the vertical deviation to the location of side cathode busbar that extends round the ends of the cell (adjacent the short sides). From Fig.4 it is clear that once the side cathode busbar is fixed, the higher the short side busbar location is, the lower the value of Bz is. While the function f will be smaller at location of 0.9 m deviated to the side cathode busbar.
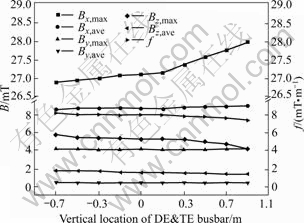
Fig.4 Magnetic induction vs short side busbar location (DE is dust end, TE is tap end)
3.3 Busbar under cell
Because the adjacent row of cells usually takes negative effect on the neighboring cell, it is not practicable to space rows sufficiently far apart or to magnetically screen rows from one another. To tackle this problem, certain measures should be taken, one of these is to connect segment of busbar with certain numbers of cathode bars extending underneath the cell to make compensation for the vertical component. The schematic plot is shown in Fig.5.
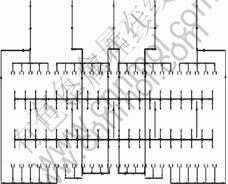
Fig.5 Schematic diagram of busbar under compensation
In Fig.6, the numbers of conductors passing current transversely underneath the cell to the downstream side show their effect on the magnetic field, where each conductor carries current flowing out from two cathode bars ends. The absolute value of the mean of Bz (Bz, mean, shown in right Y axis) in the metal will reach the minimum if there is only eight cathode conductors passing underneath the cell (half cell). But according to the stability rule, it is preferable to have six busbars that amount to 50% upstream side cathode current extending under the cell other than eight busbars considering the evaluation function value that is plotted in Fig.6.
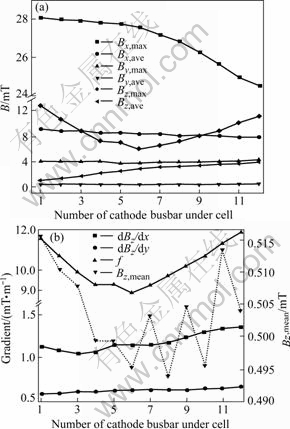
Fig.6 Magnetic induction vs busbar number under cell
3.4 Horizontal location of busbar under cell
The horizontal location of the busbar under cell is the distance to the short axis (transverse axis). When the number of conductors passing underneath the cell is fixed as six, it is shown from Fig.7 that the Bz, ave and function f decrease when the busbar is displaced farther from the transverse axis, two horizontal axes are displayed at the top and the bottom of the figure to show different distances of the two groups of busbars under cell to the short axis. It seems to be advantageous to locate the busbar under cell near the short side ends for stability.
3.5 Number of neighboring cells
The number of cells neighboring the target cell also plays distinct effect on the magnetic field, as is shown in Fig.8. It is shown that the difference of Bz value among these computation will become little when the number of
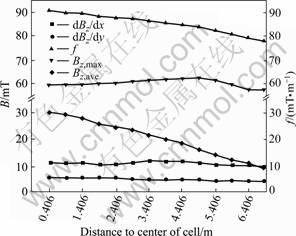
Fig.7 Magnetic induction vs horizontal location of busbar under cell
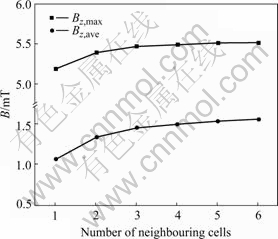
Fig.8 Bz vs number of neighboring cells in row
neighboring cells goes up to four and larger. It is clear that to get reasonable and accurate results, at least four cells should be chosen in a row neighboring the target cell on either downstream or upstream.
3.6 Distance between rows of cells
The distance between rows of cells is critical for busbar configuration when two rows are built adjacently in opposite current direction, for the adjacent row of cells usually takes negative effect on the rows of cells nearby. It is shown in Fig.9 that either Bz, max or Bz, ave in the metal pad declines when the distance increases, and Bz,mean tends to approximate zero and shows more stable. The distance should be much larger to lower the detrimental magnetic fields compared with that of 300 kA or 350 kA cell. It is reasonable and economical to choose 50 m as the distance between the rows with only about 0.5 mT to be compensated for considering the space and cost available.
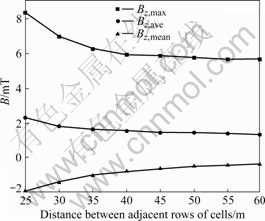
Fig.9 Magnetic induction vs distance between rows of cell
4 Conclusions
1) For two side by side rows of cell with five risers, the riser entry ratio of 11?9?8?9?11 is determined and side cathode busbar should be located at level of metal.
2) Distance between two rows of cells should be larger than 50 m. At least four neighboring cells on one side of the target cell should be chosen for accurate computation.
3) 50% upstream cathode current under cell should be got for magnetic field compensation and the busbar under cell should locate near the short ends with the given riser entry ratio.
4) The evaluation function can help to determine the optimal busbar arrangement parameters by combining the available field values with MHD stability criteria. Asymmetrical busbar arrangement may be advantageous to find the optimum of stable smelter, this is the next to be worked on.
References
[1] Dupuis M, Bojarevics V, Freibergs J. Demonstration thermo-electric and MHD mathematical models of a 500 kA aluminum electrolysis cell (Part 2) [C]// Light Metals. Carlotte: TMS, 2004: 453-459.
[2] Dupuis M, Bojarevics V. Weakly coupled thermo-electric and MHD mathematical models of an aluminium electrolysis cell [C]// Light Metals. San Francisco: TMS, 2005: 449-454.
[3] El-Demerdash M F, Adly A A, Abu-Shady S E, ISMAIL W. Towards a more stable aluminum cell via busbar configuration optimization [C]// Light Metals. Nashville: TMS, 2000: 291-295.
[4] Gusev A, Kriuokovsky V, Krylov L, PLATONOV V. Busbar optimization of high-current reduction cells [C]// Light Metals. Carlotte: TMS, 2004: 467-472.
[5] Descloux J, Flueck M, Romerio M V. Stability in aluminum reduction cells: A spectral problem solved by an iterative procedure [C]// Light Metals. San Francisco: TMS, 1994: 275-281.
[6] Sele T. Instabilities of the metal surfaces in electrolytic aluminum reduction cells[J]. Met Trans B, 1977, 8B: 613.
[7] Urata N. Magnetics and metal pad instability [C]// Light Metals. New York: TMS, 1985: 581-591.
[8] Moreau R J, Ziegler D. Stability of aluminum cells��A new approach [C]// Light Metals. New Orleans: TMS, 1986: 359-364.
[9] Sun H, Zikanov O, Ziegler D P. Non-linear two-dimensional model of melt flows and interface instability in aluminum reduction cells[J]. Fluid Dynamics Research, 2004, 35(4): 255-274.
[10] Severe D S, Schneider A F, Pinto E C, GUSBERTI V. Modeling magnetohydrodynamics of aluminum electrolysis cells with ANSYS and CFX [C]// Light Metals. San Francisco: TMS, 2005: 475-480.
[11] Zhou Ping, Mei Chi, Zhou Nai-jun, JIANG Chang-wei. Effect of electromagnetic force on turbulent flow of molten metal in aluminum electrolysis cells[J]. Journal of Central South University of Technology, 2004, 11(3): 265-269.
[12] Lacamera A F, Ziegler D P, Kozarek R L. Magneto- hydrodynamics in the Hall-Heroult process, an overview [C]// Light Metals. Seattle: TMS, 1992: 1179-1186.
[13] Droste C, Segatz M, Vogelsang D. Improved 2-dimensional model for magnetohydrodynamic stability analysis in reduction cells [C]// Light Metals. San Antonio: TMS, 1998: 419-428.
[14] Segatz M, Droste C. Analysis of magnetohydrodynamic instabilities in aluminum reduction cells [C]// Light Metals. San Francisco: TMS, 1994: 313-322.
[15] Grjotheim K, Kvande H. Understanding the Hall-Heroult process for production of aluminum[M]. Dusseldorf: Aluminum- Verlag, 1986.
(Edited by CHEN Wei-ping)
Foundation item: Project(20010533009) supported by the Specialized Research Fund for the Doctoral Program of Higher Education of China
Received date: 2007-06-18; Accepted date: 2007-07-30
Corresponding author: LI Mao, Doctoral candidate; Tel: +86-731-8830897; E-mail: limao89@163.com
