
J. Cent. South Univ. Technol. (2008) 15(s1): 357-361
DOI: 10.1007/s11771-008-380-5
![]()
Coupled model of consolidation and creep for consolidation test
MEI Guo-xiong(÷����)1, YIN Jian-hua(��)2
(1. College of Civil Engineering, Nanjing University of Technology, Nanjing 210009, China;
2. Department of Civil & Structural Engineering, The Hong Kong Polytechnic University,Hong Kong, China)
Abstract:
For most soft soil, the consolidation process and the creep process were coupled and the character of settlement time curve was obtained by the consolidation test at the same time. A simple and continuous function was presented to express the whole process of consolidation including immediate settlement stage, the primary consolidation stage and the secondary consolidation stage. And the features of the continuous function were analyzed. The results of the long-term (duration to 18 months) consolidation test on clays from the Chek Lap Kok formation proved the rightness of the method. In the end, the parameter meanings of the continuous function were discussed.
Key words:
coupled model; consolidation; creep; soft soil��
1 Introduction
Consolidation and creep problems are important themes for soft soil engineering[1]. Based on the uncoupling assumption that the primary consolidation and the secondary consolidation are segregated artificially, piecewise analytic functions are used to express the primary consolidation stage and the secondary consolidation stage respectively[2]. However, for most soft soil, the consolidation process and the creep process are coupled and the character of settlement time curve is obtained by the consolidation test at the same time[3]. In this work a simple and continuous function is presented to express the whole process of consolidation including immediate settlement stage, the primary consolidation stage and the secondary consolidation stage. And the features of the continuous function are analyzed. Then the results of the long-term (duration to 18 months) consolidation test on clays from the Chek Lap Kok formation prove the rightness of the method. In the end, the parameter meanings of the continuous function were discussed.
2 Basic understanding of oedometer test
As we all know, some basic understandings of oedometer test are as follows[4].
1) The total settlement Sf usually consists of three parts��the immediate or elastic compression settlement Sim, the primary consolidation settlement Sco, and the secondary compression or creep settlement Scr, that is
Sf=Sim+Sco+Scr (1)
Specially, for sand, Sim=Sf and Sco=Scr=0[5].
2) The settlement St of the soil with t or lg t in time is monotonely increasing, that is
for clay,
![]() (2)
(2)
![]() (3)
(3)
for sand, ![]() and
and ![]() [5].
[5].
3) The rate of settlement ![]() with t in time is monotonely decreasing, that is
with t in time is monotonely decreasing, that is
![]() ��0 (4)
��0 (4)
for sand, ![]() =0[5].
=0[5].
4) For clay, there is an inflection point in the curve of the settlement St vs lg t in time, which is considered the demarcation point of the primary consolidation and secondary compression, and the corresponding time is considered the time of the end of primary consolidation Teop[6], that is
 (5)
(5)
3 Establishment of math expression for oedometer test
Based on the above section��s understanding for the results of oedometer test, we can establish a simple and continuous expression for forecasting the experiment results, that is
 (6)
(6)
where a, b, c, Teop and Sf are non-negative parameters of expression; Teop is the time of end of primary consolidation and Sf is the final settlement. Using more than four group data (ti, Sti) (i=1, 2, 3, 4, ��n)(n��4), we can determine the parameters of expression by optimization methods, such as least squares techniques. Actually, the span of the parameters a, b and c are very narrow due to the following analysis.
The expression for oedometer test has the following features.
1) The expression can convey the composition of the final settlement, that is
 (7)
(7)
So the immediate or elastic compression settlement Sim, the primary consolidation settlement Sco, and the secondary compression or creep settlement Scr are
 (8)
(8)
Especially, for sand, a=0, so Sim=Sf and Sco=Scr=0.
2) The settlement St of the soil with t or lg t in time is monotonely increasing, that is
![]() (9)
(9)
 (10)
(10)
Because a, b, c, Teop and Sf are non-negative,![]() ��0 and
��0 and ![]() ��0.
��0.
3) The rate of settlement ![]() with t in time is monotonely decreasing, that is
with t in time is monotonely decreasing, that is
 (11)
(11)
In order to keep ![]() non-positive constantly, we have to make b��1.
non-positive constantly, we have to make b��1.
4) There exists a demarcation point in the curve of the settlement St vs lg t in time, when t= Teop, that is
![]() =
=![]() (12)
(12)
 (13)
(13)
So there exists a demarcation point at t=Teop(a+c)1/b.
In reality, the distinction between the primary consolidation and the secondary compression is not clear because secondary compression occurs as part of the primary consolidation phase especially in soft clays. The mechanics of consolidation is still not fully understood, and to make estimates of settlement, it is convenient to separate primary consolidation and secondary compression and the demarcation point exists at the end of primary consolidation Teop, that is
![]() and
and ![]() (14)
(14)
For the soil with no clear distinction between the primary consolidation and the secondary compression, we consider a+c��1.
5) There are narrow spans for the parameters a, b, and c, that is
0��b��1; a+c=1 or a+c��1 and a��0, c��0 (15)
4 Verification of math expression
The results of long-term (duration to 18 months) consolidation tests on clays from the Chek Lap Kok formation[7] were used to verify the rationality of the math expression. The clays were firm to stiff, light to dark grey silty clay with occasional organic inclusions. The clays had a clay content varying from 24% to 51%, a silt content of 49% to 73% and a sand content of 0 to 3%. The clays had a liquid limit of 39% to 68%, plastic limit of 18% to 33%, natural moisture content of 21% to 56% and a bulk density of 1.67 Mg/m3 to 2.06 Mg/m3. The experiment curves and best fitting curves by the presented math expression are shown in Figs.1-4. The reasonable agreement shows the rightness of the math expression.
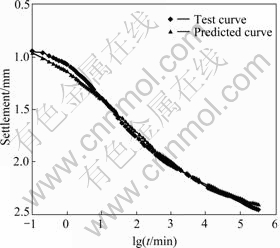
Fig.1 S��lgt curve of sample 532B32(10)
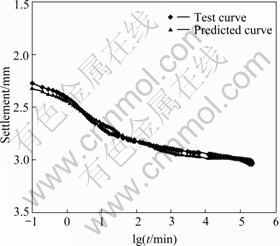
Fig.2 S��lgt curve of sample 520ME211
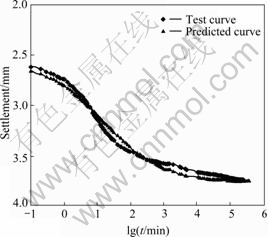
Fig.3 S��lgt curve of sample 520ME214
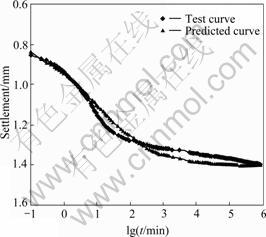
Fig.4 S��lgt curve of sample 519B08
5 Evaluation of expression parameters
The parameters of the presented math expression including a, b, c, Teop, and Sf were discussed and analyzed for the influence on calculation results. To simplify the analysis, only one parameter was changed at one time in the following section. Unless otherwise stated, all calculation parameters hereinafter were considered Sf=100, Teop=10, a=0.5, b=0.5 and c=0.5.
5.1 Influence of Sf
Obviously from Eqn.(7), Sf is the final settlement. Its value reflects directly the magnitude of the final settlement. When the void of soil is compressed into zero by external force, this is the upper limit of the final settlement Sf, that is Sf��[1/(1+e)]H[8], where e is the initial void ratio and H is the initial height of soil.
5.2 Influence of a
The influence of the parameter a was analyzed by defining the parameter a as a=0.3, 0.5, 0.7, 1.0 and 1.5. The curves of the logarithm of time lg t vs the settlement are plotted in Fig.5. As shown in Fig.5, the larger the parameter a, the smaller the immediate settlement, the larger the secondary compression, and the consolidation settlement is growing at the beginning and is falling at the end.
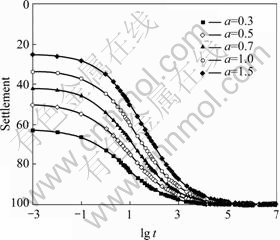
Fig.5 Influence of parameter a
5.3 Influence of b
The influence of the parameter b was analyzed by defining the parameter b as b=0.1, 0.2, 0.3, 0.5 and 1.0. The curves of the logarithm of time lgt vs the settlement are plotted in Fig.6. As shown in Fig.6, the larger the parameter b, the flatter the slope of the curve of the logarithm of time lg t vs the settlement in the stage of the primary consolidation. It is pointed out that the parameter b does not influence the proportion of the immediate settlement, the consolidation settlement and the secondary compression from Eqn.(8).
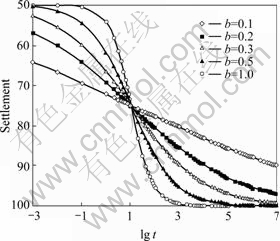
Fig.6 Influence of parameter b
5.4 Influence of c
The influence of the parameter c was analyzed by defining the parameter c as c=0.2, 0.4, 0.5, 0.6 and 0.8. The curves of the logarithm of time lg t vs the settlement are plotted in Fig.7. As shown in Fig.7, the larger the parameter c, the larger the immediate settlement, the smaller the secondary compression and the consolidation settlement, and the flatter the slope of the curve of the logarithm of time lgt vs the settlement in the stage of the primary consolidation.
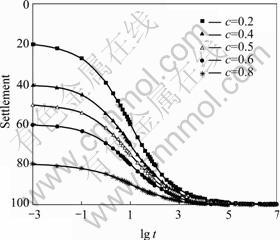
Fig.7 Influence of parameter c
5.5 Influence of Teop
The influence of the parameter Teop was analyzed by defining the parameter Teop as Teop=1, 10, 100, and 1 000. The curves of the logarithm of time lgt vs the settlement are plotted in Fig.8. As shown in Fig.8, the larger the parameter Teop, the slower the primary consolidation and the secondary compression. It is pointed out that the parameter Teop does not influence the shape of the curve and the proportions of the immediate settlement, the consolidation settlement and the secondary compression from Eqn.(8).
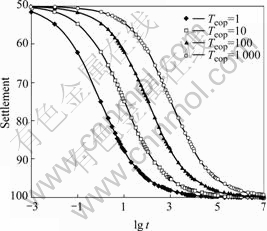
Fig.8 Influence of parameter Teop
6 Conclusions
Based on the characters of curve of logarithm of time versus displacement in the typical one-dimensional consolidation test (the odometer test), a simple and continuous math expression for odometer test coupled the primary consolidation settlement and the secondary compression settlement is established. The reasonable agreement of the forecast results and the experiment results of the long term (duration to 18 months) consolidation test on clays from the Chek Lap Kok formation proves the rightness of the expression. In the end, the parameters of expression are discussed and analyzed.
References
[1] YIN Jian-hua, ZHU Jun-gao, GRAHAM J. A new elastic viscoplastic model for time-dependent behaviour of normally and over- consolidated clays: Theory and verification [J]. Canadian Geotechnical Journal, 2002, 39(1): 157-173.
[2] CRAIG R F. Craig��s soil mechanics [M]. London: E&FN Spon Press, 2004.
[3] DAS B M. Advanced soil mechanics [M]. Washington, DC: Taylor & Francis, 1997.
[4] MEI Guo-xiong, ZAI Jin-min, ZHAO Wei-bing, YIN Jian-hua. Settlement prediction methods considering creep [J]. Chinese Journal of Geotechnical Engineering, 2004, 26(3): 416-418. (in Chinese)
[5] KARL T, RALPH B P, GHOLAMREZA M. Soil mechanics in engineering practice [M]. New York: Wiley, 1996.
[6] YIN J H, GRAHAM J. Elastic viscoplastic modelling of the time-dependent stress-strain behaviour of soils [J]. Canadian Geotechnical Journal, 1999, 36(4): 736-745.
[7] DOK L, PERMCHITT J. Long-term consolidation tests on clays from the Chek Lap Kok formation [R]. Geo Report No.72, Geotechnical Engineering Office Civil Engineering Department, Hong Kong, 2000.
[8] ZHU Jun-gao, YIN Jian-hua, LUK S T. Time-dependent stress-strain behavior of soft Hong Kong marine deposits [J]. Geotechnical Testing Journal, 1999, 22(2): 118-126.
(Edited by YUAN Sai-qian)
Foundation item: Project(50608038) supported by the National Natural Science Foundation of China
Received date: 2008-06-25; Accepted date: 2008-08-05
Corresponding author: MEI Guo-xiong, Professor, PhD; Tel: +86-25-83587715; E-mail: meiguox@163.com
