
J. Cent. South Univ. Technol. (2008) 15(s1): 149-154
DOI: 10.1007/s11771-008-335-x
![]()
Application of particle trajectory model in 1D planar ejection
LIU Kun(�� ��), BAI Jing-song(�ؾ���), LI Ping(�� ƽ)
(Institute of Fluid Physics, Chinese Academy of Engineering Physics, Mianyang 621900, China)
Abstract:
A simple one-dimensional planar model for ejection was set up based on experiments. And numerical simulation was performed on this model with particle trajectory model method. An Eulerian finite volume method was conducted to resolve gas field. And Lagrangian method was imposed to track each particle. The interaction between gas and particles was responded as source terms in governing equations which were induced by forces. The effects of total spraying mass, particle size and other factors on the mixture of particles and gas were investigated. The spatial distributions of particle mass and velocity at different time were presented. The result shows that the numerical results are qualitatively consistent to those of experiments.
Key words:
1 IntroductionIt is well known that the reflection of strong shock waves from surfaces may cause spray of material from surfaces[1-3], which is so-called tiny ejection. The generation of ejection and its mixing with gas are the two primary problems in implosion process of weapon. For issue of ejection formation, the physical mechanisms are of main research content. But till to now it hasn��t been very clear. Generally, tiny jetting, surface fragmentation, impulsion melting, unloading melting etc may induce spray were considered. As mixture of particles and gas is concerned, the revealment of effect on gas induced by particles is the primary mission. But because the process is companied with high velocity, high temperature, high pressure and microsize scale, it is rather difficult in experimental measurements. As a result, little and coarse information about mixture from present experiments can be obtained. The numerical simulation is endowed with expectation to achieve the details of mixture.
By eliminating material changes in atomic level, the mass, momentum and energy transportation behaviors of particle mixture accord with general hydrodynamics principles. On the basis of this precondition, a simple gas-particle two-phase method, particle trajectory model[4] was used to manipulate numerical simulation. This method is widely used in coal powder combustion, chemical reaction, semiconductor industry, atmosphere climate and many other realms, and gains significant success. The gas flow field is obtained by resorting to solve Euler equations and the particles are determined by solving the second Newton��s law[5-8]. The interaction primarily induced by the difference of velocities of phases is responded to several forces, including drag force, added mass force, Basset force, etc[9-11]. For the gas field dominated by governing equations, the forces are contained in source terms, and they are actually the mean effect acted on gas by particles. Fortunately, the introduction of source terms does not change the nature of the equations. All numerical technique solving general Euler equations can be utilized to solve these equations with source terms. Thus, it is unnecessary to modify the existing codes except adding capabilities of disposing source term for Euler equations and solving particles synchronously.
Since the most important task at present is to study the force forms and accurately evaluate their values according to the states of phases, and model the collision, coagulation and breaking of particles. So far the main forces, including drag force, added mass force and Basset force in gas-particle two-phase fluid have been extensively considered[9-13]. And the force forms and the calculation method are of maturity. The drag force exerts effect so far as the velocities of particles and gas are different, which always attempts to achieve a equilibrium state. The added mass force accounts for the resistance of the fluid mass that is moving at the same acceleration as the particle, which can be neglected if the density of particles is far larger than that of gas[9-11, 13]. And the Basset force accounts for the effect of past acceleration, whose quantity is related to the course of particle movement[12-13]. Comparing with the calculation of drag force, the calculations of the added mass force and the Basset force are more complex. In general cases, these two force are little in total force and can be ignored. In Refs.[6] and [14], particle collision models were expatiated to obtain the velocities of the particles after collision. There was also report about the coagulation and breaking of particles[15].
In this paper, a simple one-dimensional planar model for ejection was introduced based on experiments and then numerical simulation was performed on this model with particle trajectory model method. The effect of particle spray mass, particle size etc on the gas field were investigated.
2 Physical model
According to the experiment presented by ASAY et al[3] and the photos taken by LLNL, a one-dimensional planar ejection model is projected as shown in Fig.1. In the sketch, Mp(t), Vpe(t) and Vt(t) denotes the total mass of spray particles, the ejection velocity of particles, the velocity of target at time t, respectively; ��, v and p denotes density, velocity, and pressure, respectively. And the subscripts p, 1 and 2 denote particles, gas in front of shock and after shock, respectively. To simplify the issue, several assumptions were established as follows:
1) All variables and parameters vary only in x-coordinate in spatial.
2) All particles are of the same size of spheres. There is no collision between the particles. The effect of particles volume on the gas and the interaction among particles are neglected.
3) The cavity right to the surface is filled with ideal gas. Phase change of gas does not happen when temperature is high. And the corresponding state equation keeps unchanged.

Fig.1 One-dimensional planar model for ejection
3 Computational method
3.1 Governing equations
For one-dimensional problem, the governing equation for inviscid compressible gas in Cartesian coordinates are
![]() (1)
(1)
where
 ;
;  ;
;  ;
; ![]()
![]() ; ��, u and �� are the density, velocity and total energy of gas, respectively; fx denotes the mass force per
; ��, u and �� are the density, velocity and total energy of gas, respectively; fx denotes the mass force per
unit that particles operate on gas. For convenient purpose, the subscript g that accounts for gas is omitted. Here, Clapeyron equation, p=��RT, is used implicitly.
For each particle, it follows Newton��s second law:
![]() (2)
(2)
where mp is the mass of a particle; Fp is the force a particle bares. In this paper, only drag force was considered. The relation is
![]() (3)
(3)
where S=��rp2 is the exposed frontal area of the particle to the direction of the incoming flow; rp is the radius of a particle; CD is the drag coefficient. For rigid spherical particles, considering the effects of turbulence, compressible, rareness, etc, CD can be estimated by the following equation:

where Re=2urp/v, is the particle Reynolds number; Mr=|u-up|/a is the Mach number; a is the sound speed of gas.
Let n(t, x) represent the number density of particles at time t and location x. Then the mass distribution density of particle is
![]() (4)
(4)
And the particles number density at left boundary and time t is
![]()
According to Newton��s third law, the force acting on unit mass gas is
![]() (5)
(5)
Whether the mass force exists or not is directly related to the local particle number. So, Eqn.(5) is appropriate to everywhere of the computational domain.
The states of gas after various waves reflect are determined by characteristic line relations and consistency conditions at boundaries[16-17]. For instance, a perturbation wave at left moving wall boundary turns into a right traveling wave. The sound speed, density and pressure of gas after reflection are
![]()


where subscripts 1 and 2 denote the gas states before and after reflection. Analogous relations are exerted for perturbation waves reflecting at right boundary.
3.2 Numerical method
The calculation of each time step is decomposed into three approaches: 1) calculating the forces the particles endure at the nth time step; 2) determining the displacement and velocity of each particle at the (n+1)st time step; 3) transforming the drag force to mass force the gas endues and substitute it to governing equations of the gas and obtain all physical quantities of gas at the (n+1)th time step.
Above all, the computational domain can be divided into N elements Ii=[xi-1/2, xi+1/2], 1��i��N. The nodes satisfy xl=x1/2��x3/2������xN+1/2=xr and are the center points of each element. By solving Eqn.(3), approach 1) can be accomplished. To save computation time and memory space, the particles ejected in a single time step are accumulated to a group. Each particle in the group has the same force and moving principle. According to Eqns.(2) and (3), the velocity and displacement of the accumulated particles are
 (6)
(6)
In order to simulate the evolution of gas, a flux fragmentation method was implemented. In element Ii, the second order semidiscretized scheme in spatial is
![]() (7)
(7)
where E- and E+ denote right and left limitations of the approximation of E at cell boundaries, respectively. The hat ��^�� denotes the numerical flux of F. Here, the Osher- Solomon flux is chosen to compute the flux[18-20]:
![]() (8)
(8)
Finally, the time advance is conducted with the second order Runge-Kutta method:
![]()
![]() (9)
(9)
3.3 Validation
The most effective parameters in the particle mixing issue consist of the total spray mass M, the surface moving rule Vt and the size distribution of particles rp. In fact, if M=0, it is equivalent to the problem of a piston accelerating in a shock tube. The computational domain is x��[-5, 8]. And the initial condition of gas is (��, u, p)=(1, 0, 5). The velocity of the piston is
![]()
where W is acceleration. The numerical results and the analytic solution with W=1 are compared in Fig.2. They are almost entirely coincident. This shows that the numerical method adopted in this paper is appropriate and the results are of credibility.
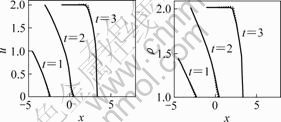
Fig.2 Results comparison between numerical simulation (solid line) and analytical solution (dash line) for gas accelerated by a piston
4 Results and discussion
To simulate the non-uniform accelerating case, the velocity of the surface is supposed to be satisfied the following equation:

where ![]() ;
; ![]() ; r is the
; r is the
distance of left surface to right boundary. The left surface originally locates at position with distance r1 to right boundary and with velocity u1. And when it moves to position with distance r2 to right boundary, its velocity accelerates to u2. According to experimental quantity, in this paper the parameters were chosen as follows: u1=1 km/s, u2=2 km/s, r1=0.1 m, r2=0.05 m. And the transmission shock wave located at x=0 at starting time. The computational domain is set to [-0.05, 0.05]. The gas in front of the shock was stagnant with p=1��105 Pa. The material of the surface is of Al2024. And the velocity difference between particles and the surface holds the constant value of 1 km/s.
Figs.3-4 show spatial distribution of gas and particles quantities at different time for rp=2 ��m. There is evident distinguish between non-zero and zero spray mass cases. The particles apply significant effects on gas fields. During initial stage, particles ejecting from the surface drive the surrounding gas accelerate away from the surface. As a result, the density and pressure of gas near surface become very small. On the other hand, because of the accelerating movement of the surface and the decelerating action from gas, the particles ejecting later move faster than those ejecting former. The particles accumulate forward as shown in Fig.4. The spatial density monotone increases, on the contrary, the velocity monotone decreases. At the same time, the perturbation wave in gas propagates downstream and causes quantities of gas where the wave reaches larger than those of no spray case. As ejection finishes, the surface also stops to accelerate. Particles group separates from the surface. And the velocity of all particles approaches equilibrium state with gas. However, the velocity of gas in gap of particle group and the surface is larger than the equilibrium velocity. With the surface moving downstream, the gas begins to accelerate particles. Therefore, the spatial density of particle decreases and the velocity increase as shown in the last two lines in Fig.4.
In order to understand the temporal revolution of particles spatial distribution clearly, variations of the distance D between spray tip and the left surface and the width of spray L with respect to time t are given in Fig.5(a). Both quantities increase at the beginning and then decrease. At t=36.6 ��s, at which the surface stops to accelerate and no particle spraying from the surface, two quantities begin to detach to each other. L decreases steeper than D. This also means the spray separates from

Fig.3 Spatial distribution comparison between total spraying mass rate 1 mg?cm-3?s-1 (solid line) and no spray (dashed line) for gas density, velocity and pressure at different time (Time between two close lines is ?t=1��10-5 s, starting time is t0=1��10-5 s)
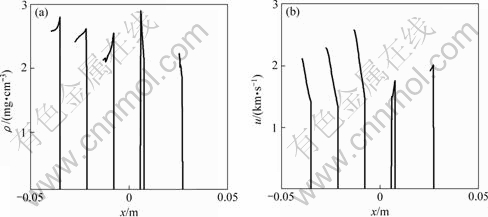
Fig.4 Spatial density and velocity distribution of particles at different time (Time between two neighbor lines is t=1��10-5 s, starting time is t0=1��10-5 s)
the surface and the band particles occupy gets narrower. Not long later, they superpose again, which means the surface catches up with particles. Then, both decrease slowly. In Fig.5(b), the curve of total mass of particle in cavity versus time was presented. It shows a linear increase with time due to the constant spray rate. As spray finishes, the total mass in gas domain keeps invariant. And with particles returning to the surface, the total mass decreases correspondingly.
The effects of different particle radius are also illustrated in Fig.5 for dM/dt=1 mg/(cm2?s). In fact, the physical quantities of gas for large particle radii are similar to small radii case as shown in Figs.3-4 but with different intensities. Here, only the particle group characteristic lengths were discussed. According to Eqns.(2)-(3), the acceleration of a particle moving in gas is proportional to rp-1, which directly implies larger particles have smaller acceleration or deceleration. That means for same initial conditions to achieve same velocity or pass the same distance, the larger particles will take more time. Fig.5(a) confirms this result. It
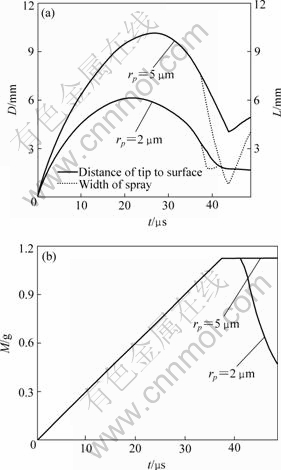
Fig.5 Variation of characteristic parameters for particles versus time at different particle radii: (a) Length of spray tip to surface and width of spray; (b) Total spray mass. dM/dt=1 mg/(cm2?s)
shows that the larger the particles are, the larger distance from the surface the particles can reach. As spray finishes, the larger particles spend more time to return to the surface and accumulate to a narrower band.
The effect of mass spray rate, which is the total spray mass per unit area and unit time, was investigated for the same radii of particles as well. Fig.6 shows that the more the material is ejected, the larger the characteristic distances are. Actually, for the same particle size, more particles will induce larger mass force acting on gas. And the equilibrium velocity is higher. It is more difficult for the surface to catch up with particles. In other words, the particles can reach deeper distance in gas.
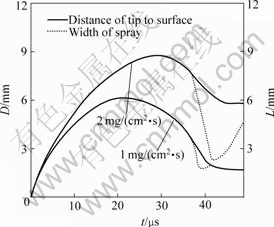
Fig.6 Variation of characteristic parameters for particles versus time at different mass spray rates (rp=2 ��m)
5 Conclusions
1) The effect on gas induced by non-zero spray is significant and can not be neglected.
2) The distance of particle group tip to the surface increases at beginning and then decreases. Particle group will leave away from surface after spray being over for a certain period and finally, be caught up by the surface.
3) Larger the particle is, smaller the acceleration. Since larger particles can reach further distance from the surface.
4) Similarly, the particles of larger spray mass case can achieve deeper in gas.
No careful comparison is performed between the calculation and the experiment. Still, the above conclusions are qualitatively consistent with experimental results. It declares that the gas-particle two-phase method is appropriate to analysis particle mixture in spray issue.
References
[1] WALSH J M, SHREFFLER R G, WILLING F J, et al. Limiting conditions for jet formation in high velocity collisions[J]. J Appl Phys, 1953, 24: 349-359.
[2] THOMPSON B J. Holographic measurement of eject from shocked metal surface[J]. J Appl Phys, 1965, 14: 302-308.
[3] ASAY J R, MIX L P, PERRY F C. Ejection of material from shocked surfaces[J]. Applied Physics Letters, 1976, 29(5): 284-287.
[4] XU Guang-wen, GE Wei, LI Jing-hai. Prospects of modeling particle-fluid two-phase flow[J]. Journal of Basic Science and Engineering, 1994, 2(2/3): 139-146. (in Chinese)
[5] YUAN Ya-xiong, YANG Jun-yun. The interior ballistic particle trajectory model and ita numerical calculation[J]. Journal of Ballistics, 1995, 7(4): 7-12. (in Chinese)
[6] TIAN Z F, TU J Y, YEOH G H. Numerical modeling and validation of gas-particle flow in an in-line tube bank[J]. Computers and Chemical Engineering, 2007, 31: 1064-1072.
[7] CHEN Xiang-hui, MCLAURY B S, SHIRAZI S A. Numerical and experimental investigation of the relative erosion severity between plugged and elbows in dilute gas/solid two-phase flow[J]. Wear, 2006, 261: 715-729.
[8] ZHOU Hao, CEN Ke-fa, FAN Jian-ren. Detached eddy simulation of particle dispersion in a gas-solid two-phase fuel rich/lean burner flow[J]. Fuel, 2005, 85: 723-731.
[9] CHUANG M S, LEE S J, CHANG K S. Effect of interfacial pressure jump and virtual mass terms on sound wave propagation in the two-phase flow[J]. Journal of Sound and Vibration, 2001, 244(4): 717-728
[10] HUANG She-hua, LI Wei. On added mass force acting on a small particle moving unsteadily in viscous flow[J]. Engineering Journal of Wuhan University, 2002, 35(4): 13-17. (in Chinese)
[11] WAKABA L, BALACHANDAR S. On the added mass force at finite Reynolds and acceleration numbers[J]. Theor Comput Fluid Dyn, 2007, 21: 147-153.
[12] YOU Chang-fu, QI Hai-ying, XU Xu-chang. Progress and application of Basset force[J]. Chinese Journal of Applied Mechanics, 2002, 19(2): 31-35. (in Chinese)
[13] HUANG She-hua, LI Wei, CHENG Liang-jun. On numerical method of resolving discrete solid particles motion equation and its applications[J]. Journal of Hydrodynamics: Ser A, 1999, 14(1): 51-61. (in Chinese)
[14] ZHANG Jian-ping, LI Yong, FAN L S. Numerical studies of bubble and particle dynamics in a three-phase fluidized bed at elevated pressures[J]. Powder Technology, 2000, 112: 46-56.
[15] DOLGONOSOV B M. Numerical simulation of the formation of a dispersed phase with particle coagulation and breaking[J]. Theoretical Foundations of Chemical Engineering, 2002, 36(6): 539-545.
[16] GUO Lie-jing. Two-phase and multi-phase fluid dynamics[M]. Xi��an: Xi��an Jiaotong University Press, 2002. (in Chinese)
[17] TONG Bing-gang, KONG Xiang-yan, DENG Guo-hua. Aerodynamics[M]. Beijing: High Education Press, 1989. (in Chinese)
[18] ENGQUIST B, OSHER S. One sided difference approximation for nonlinear conservation laws[J]. Math Comp, 1981, 36: 321-351.
[19] OSHER S, SOLOMON F. Upwind difference schemes for hyperbolic conservation laws[J]. Math Comp, 1982, 38: 339-374.
[20] QIU Jian-xian, KHOO B C, SHU S W. A numerical study for the performance of the Runge-Kutta discontinuous Galerkin method based on different numerical fluxes[J]. Journal of Computational Physics, 2006, 212: 540-565.
Foundation item: Project(10672151) supported by the National Natural Science Foundation of China
Received date: 2008-06-25; Accepted date: 2008-08-05
Corresponding author: LIU Kun, Assistant researcher; Tel: +86-816-2485148; E-mail: lkm@ustc.edu
