
J. Cent. South Univ. Technol. (2011) 18: 1910-1916
DOI: 10.1007/s11771-011-0922-0![]()
A novel quantificational assessment method of frothers effect on
bubble characteristics
HU Yue-hua(������), MENG Xiang-li(������), SUN Wei(��ΰ)
School of Mineral Processing and Bioengineering, Central South University, Changsha 410083, China
? Central South University Press and Springer-Verlag Berlin Heidelberg 2011
Abstract:
A new visual method for quantitative measurement of frothers effect and flotation efficiency was presented. A self-designed electrolytic cell was chosen as the reaction environment with sodium chloride (NaCl) as the electrolyte. Constant current, supplied by a self-designed power supplier and fixed cathode and anode equipment, guaranteed the constant bubble volume per unit time. Even aperture of the cathode material guaranteed the original bubbles size to be uniform. Bubble generating equipment was connected with a microscopical camera. Statistic data collected by high speed charge-coupled device (CCD) and processed by software Sigmascan and Matlab could reflect bubble characteristics. The efficiency of dipropylene glycol monomethyl ether (DPM) and tripropylene glycol n-butyl ethel (TPnB) were measured at the same condition, and 2��10-4 mol/L and 5��10-2 mol/L were found to be the inflexions of bubble size changes.
Key words:
frother; bubble; image processing; data screening; flotation efficiency��
1 Introduction
Flotation technique is widely applied in mineral processing industry, waste water treatment, paper recycle and scrap iron and copper separation [1]. As a significant reagent, frother is used to improve the characteristic of pulp in flotation. The frother effect on bubble size distribution in flotation process has been studied by GRAU et al [2-4] and AZGOMI et al [5-6], which proved that flotation efficiency can be improved through bubble size reducing caused by frothers. Until now, there is a few researches on frother effect which are all qualitative assessment methods. Previous researches [7-12] observed frother effect in flotation, and proved that frothers make bubble size smaller, narrow the bubble distribution area, and benefit fine particle flotation [13]. Frothers prevented fine bubbles from coalescing and reduced the final size of bubbles consequently [14-18].
However, the main instrument used by previous researchers is flotation cell, inducing incessant mechanical agitation which requires consequent stable power and airflow input, online temperature control, radiator and huge cooling water system to eliminate the temperature increment made by mechanical friction. Therefore, the experimental equipment is huge and the operation is complex.
In the work, a simple, convenient and effective instrument for measuring frother effect was designed, and a strategy for data process was proposed. Image processing method and relative algorithm were depicited in detail.
2 Experimental instrument
2.1 Bubble producing equipment
Electrolyzing water was chosen as the main advice to generate bubbles. Graphite was used as the anode and stainless steel net as the cathode (48 ��m, and the aperture diameter is 49 ��m). The test was carried out under room temperature (298 K) in an electrolytic cell with volume of 40 cm3. Frother DPM with a set of particular concentrations was applied to the aqueous solution using 1% NaCl as the electrolyte. Water was electrolyzed into hydrogen and oxygen on the cathode and anode, respectively. Due to the different sizes of hydrogen and oxygen bubbles generated in liquid environment under the same condition, a polytetrafluoroethene (PTFE) film was used between the cathode and anode areas to separate the hydrogen and oxygen in the experiment. Then, the oxygen was removed by a peristaltic pump, thus only the hydrogen rose from the electroanalysis area to the observing chamber.
The observing chamber was a rectangular block, which was made of quartz glass with high eminent hardness and light transmittance performance. It could maintain the clearness of viewing horizon instead of being blurred by nicks.
Due to the direct relationship between the current and the aeration rate, it accounts a vital parameter for the whole process. Over large current will generate many bubbles, causing low power intensity and wide bubble size distribution [19]. Otherwise, it will generate few bubbles, causing high volatility and lower representitiveness. The current was generated by a self-designed electrical source which could eliminate resistance change of the experimental instrument and supply constant current instead of constant voltage in this work. After comparing with the different currents of previous experimental results, the optimum current was fixed at 50 mA.
2.2 Image capturing system
GBX camera Y was chosen as the image capture apparatus. The camera was fitted with an AF Micro Nikkor 60 mm f/2.8 D macro lens. A light emitting diode (LED) was applied as the illumination system, which was fixed at the opposite side of the viewing chamber, as shown in Fig.1. Images were captured as grayscale images (8 bit) with a size of 512 pixel ��384 pixel. With the maximum magnification, standard grid paper was used to calibrate the measurement.
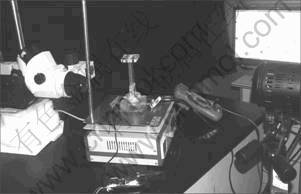
Fig.1 Image capturing system
3 Image processing software and data screening
3.1 Image processing software and algorithm
The images obtained from experiments were processed by software Sigmascan to change all the image information into bubble parameters data. Watershed algorithm and shape factor were used to eliminate improper data. These unorderly data were further processed by Matlab to get ordered statistical data and the distribution discipline of bubble parameters. The detailed image processing procedure is shown in Fig.2.
Figure 2(a) shows a typical original gray scale image with intensity range from 0 to 255. In order to protect camera lens, back lighting system was fixed at the opposite side of the lens from a slightly oblique direction, which led to uneven exposure. This uneven lighting over the image was corrected by using a pseudo-clearfield operation. Figure 2(b) shows the produced pseudo- clearfield which was used to correct uneven illumination of the image. It is noteworthy that this step is necessary, yet some of the pseudo-clearfields are almost not obvious. Figure 2(c) shows the corrected image performed by clearfield equalization. To eliminate influence of noises of the image, the contrast was increased between bubbles and the surrounding regions to identify the bubbles, as shown in Fig.2(d). To identify the targeted bubbles, limiting intensity threshold was used to select the targeted objects. During the measurement of the parameters of bubbles, choosing threshold intensity is quite important because exobitant threshold intensity make the boundary of bubbles blur, thus some adjacent bubbles may be recognized as one bubble. While less threshold intensity results in over-segmenting a bubble into fragments. In this work, intensity threshold is fixed between 0 and 200, and results are obtained by using the global thresholding algorithm [20] (Fig.2(e)). Because of surface reflection, the observed bubbles in the images are mostly hollow. It should be filled up to make sure that whole bubbles can be analyzed accurately. The morphological reconstruction operation was used to remove errors in filling procedure [21] (Fig.2(f)). Figure 2(g) shows the picture obtained by removing the bubbles touching edges. Watershed algorithm can separate bubbles through the blob analysis module recognizing and separating touching bubbles [22-23] (Fig.2(h)).
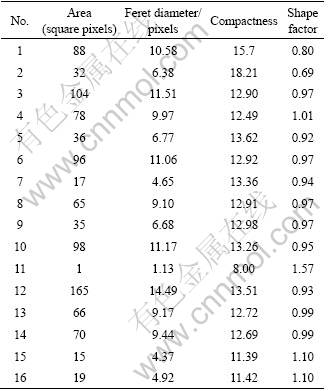
Area, feret diameter, compactness and shape factor are the parameters needed to be collected. Area is specified as bubble ichnographic area, a quantum to describe the size of a bubble. Feret diameter is a statistical diameter, which refers to the distance between two tangents on opposite side of the particle profile, which is parallel to some fixed direction. Compactness is used to measure the elongation of an object. A clearly perfect sphere has the compactness value equal to 1. The closer the compactness value is to 1, the nearer the object approaches to a perfect rotundity. Shape factor is used as the criterion for identifying clusters of bubbles that could not be separated into single object using the processing operations. After choosing these measurement factors, targeted bubbles were numbered and measured automatically, as shown in Fig.2(i). The required parameters of the bubbles were automatically listed in a worksheet by the software, and are given in Table 1.
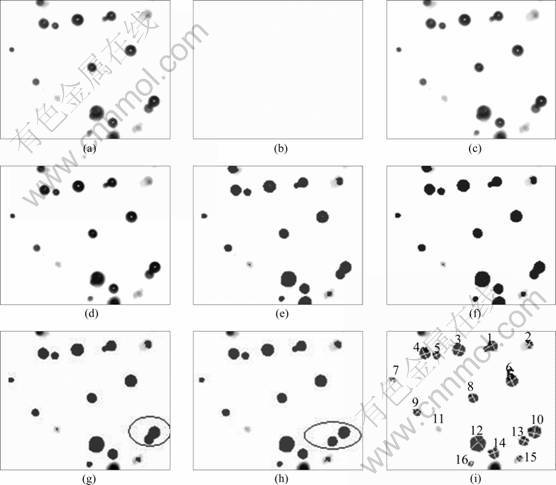
Fig.2 Image processing progress with Sigmascan and relative algorithm
Table 1 Data of bubble parameters obtained by Sigmascan software
3.2 Data screening
Although watershed algorithm was used to separate touching bubbles, some of the tiny touching bubbles might be ignored (as the object 1 shown in Fig.3). To exclude the bubbles that could not be separated by above process, compactness and shape factor as another way deal with the touching bubbles. An object with shape factor over 1.15 or less than 0.85 (or compactness over 15.2 or less than 10.7) was identified as a possible cluster instead of a bubble, thus should be removed from the analysis as shown by circling in Fig.3. Objects 2 and 11 are blurry clusters which are in another vertical layer, and object 1 is a group which is made up of a big bubble and a small bubble on the layer behind. Consequently, data of objects 1, 2, 11 should be removed from Table 1.
4 Results discussion
4.1 Experiments and results
A certain quantity of frother DPM was put into a small beaker, and diluted by NaCl with mass content of 1%. The beaker was put into an ultrasonic cleaner to make the frother dispersed completely. Then, the solution was translated into the self-designed electrolytic cell instantly. At the same time, timing was triggered. Pictures were taken when the time was 1 min by high speed charge-coupled device (CCD). All the experiments were done under room temperature.
Under the same experimental condition, different concentrations of frothers were applied in experiments. Bubble images were captured respectively. Figure 4 demonstrates the differences among bubbles with different frother concentrations. From Fig.4(a) to Fig.4(f), frother concentration increases from 2��10-5 mol/L to 1 mol/L, respectively.
After image processing and data screanning, the results are illustrated in Fig.5. It demonstrates that with the increment of frother concentration, bubbles become smaller, and its distribution becomes narrower; meanwhile, the bubble population becomes bigger. This is highly accordant with the conclusion of previous work [24].
In this work, d90 is defined as the bubble diameter larger than 90% bubbles diameter. According to previous research [2], d90 is chosen as the best criterion of the change of bubbles. Figure 6 shows a relationship between frother concentration and d90. The right Y-axis denotes d90, and the left Y-axis denotes number of d90 ![]() given by Eq.(1), where Ntotal refers to the total number of the bubbles in a certain picture after above process:
given by Eq.(1), where Ntotal refers to the total number of the bubbles in a certain picture after above process:
![]() (1)
(1)
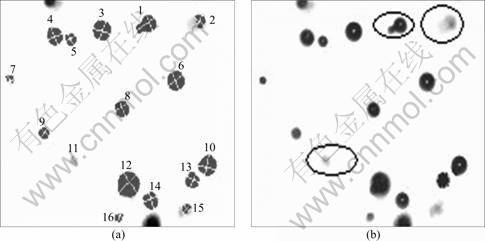
Fig.3 Excluded groups of objects from an image based on their compactness and shape factor values: (a) Output image; (b) Source image
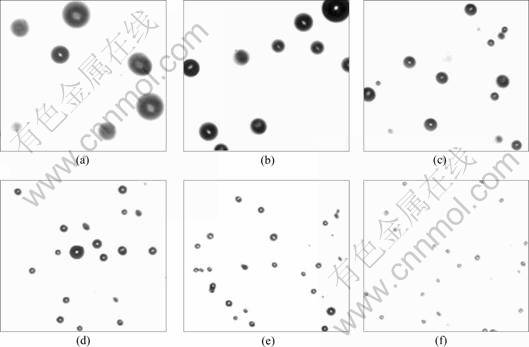
Fig.4 Effect of increment of frother concentration on bubble diameters: (a) 2��10-5 mol/L; (b) 2��10-4 mol/L; (c) 2��10-3 mol/L; (d) 2��10-2 mol/L; (e) 2��10-1 mol/L; (f) 1 mol/L
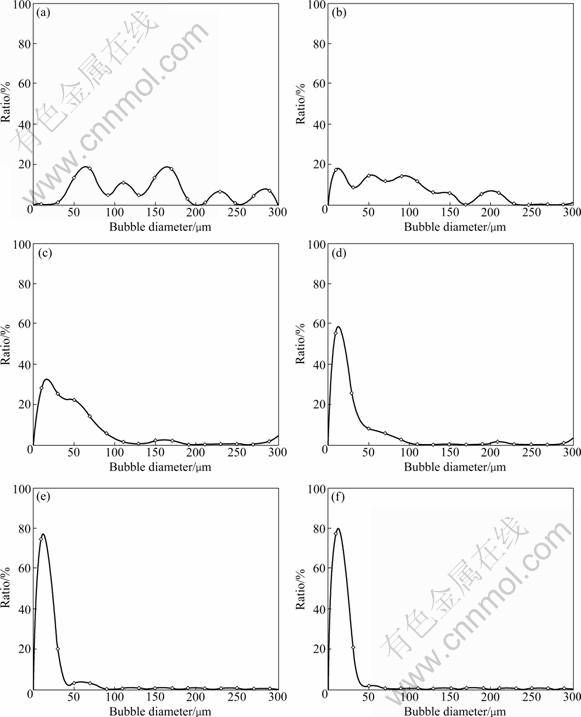
Fig.5 Bubble parameter statistic graphs obtained from resulting images by Matlab software: (a) 2��10-5 mol/L; (b) 2��10-4 mol/L; (c) 2��10-3 mol/L; (e) 2��10-2 mol/L; (f) 2��10-1 mol/L; (g) 1 mol/L
For example, the total number of the eligible bubbles in Fig.2(a) is 13 after process. According to Eq.(1), the number of d90 is 11.7 (approximates to 12), so d90 is found out to be 11.507 255. The 13 bubble diameters sorted by Feret Diameter with ascending order are listed in Table 2.
It is indicated that d90 declines sharply with the increment of the frother concentration when the concentration is lower than 0.02 mol/L. Then, the trend becomes weaker (Fig.6).
4.2 Analysis and discussion
So as to illustrate the compatibility and repeatability of the experiment, TPnB as another frother was processed by the same procedure. The result is presented in Fig.7.
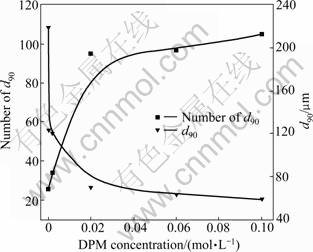
Fig.6 Effect of increments of DPM concentration on bubble amount and d90
Table 2 Bubble parameters sorted by Feret Diameter
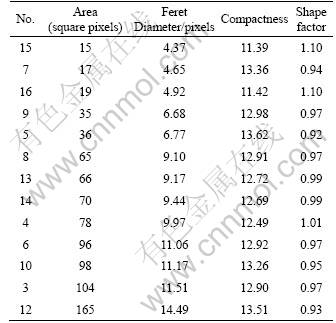
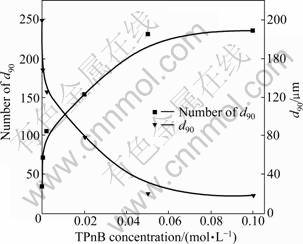
Fig.7 Effect of increments of TPnB concentration on bubble amount and d90
Surface tension of frothers with different concentrations were measured with surface tension apparatus to investigate the mechanism of frother roles in flotation process. The results are shown in Fig.8.
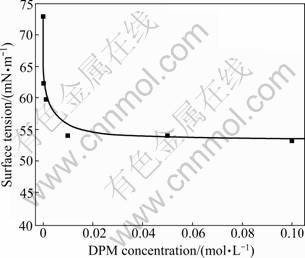
Fig.8 Effect of DPM frother concentration on solution surface tension
The change of bubble size is because frothers reduce the surface tension of solution. Figure 8 indicates that surface tension of DPM solution declines rapidly as the concentration of frothers increases from 0 to 2��10-4 mol/L. Then, from 2��10-4 mol/L, the effect of frother concentration becomes imperceptible just like trend in Fig.6. In Fig.9, surface tension of TPnB solution also has a inflexion at concentration of 5��10-2 mol/L, which is higher than that of DPM and implies that DPM is more active than TPnB. This might be caused by the difference of their solubility. The research finds that the effect of electrolyte solution on the size of bubbles (d) has direct relationship with ionic strength (I) [25]. The relationship between bubble size and ionic strength is
d=443.7+773.8e-3I (2)
As is shown above, the larger the ionic strength is, the smaller the bubble size becomes. This is in agreement with the results of our experiment.
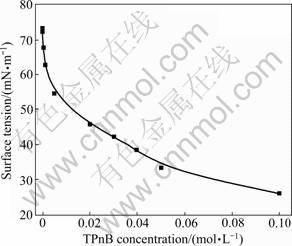
Fig.9 Effect of TPnB frother concentration on solution surface tension
5 Conclusions
1) Compared with other frother measurement instruments, the equipment designed in this work is smaller and more convenient to operate. For the same tension, the cost is cheaper.
2) By applying Sigmascan, Matlab and thresholding algorithm and measuring the frothers of DPM and TPnB, the results are proved to be accurate, which are testified by the solution surface tension results of these frothers solution.
References
[1] LI Xiao-bing, GUO Jie, ZHOU Xiao-hua, LIU Jiong-tian. Development of bubble generation technology for flotation process [J]. Coal Preparation Technology, 2003(6): 60-64. (in Chinese)
[2] GRAU R A, LASKOWSKI J S, HEISKANEN K. Effect of frothers on bubble size [J]. International Journal of Mineral Processing, 2005, 76(4): 225-233.
[3] GRAU R A, LASKOWSKI J S. Role of frothers in bubble generation and coalescence in a mechanical flotation cell [J]. Canadian Journal of Chemical Engineering, 2006, 84(2): 170-182.
[4] GRAU R A, HEISKANEN K. Bubble size distribution in laboratory scale flotation cells [J]. Minerals Engineering, 2005, 18(12): 1164-1172.
[5] AZGOMI F, GOMEZ C O, FINCH J A. Correspondence of gas holdup and bubble size in presence of different frothers [J]. International Journal of Mineral Processing, 2007, 83(1/2): 1-11.
[6] AZGOMI F, GOMEZ C O, FINCH J A. Frother persistence: A measure using gas holdup [J]. Minerals Engineering, 2009, 22(9/10): 874-878.
[7] CHO Y S, LASKOWSKI J S. Effect of flotation frothers on bubble size and foam stability [J]. International Journal of Mineral Processing, 2002, 64(2/3): 69-80.
[8] CHO Y S, LASKOWSKI J S. Bubble coalescence and its effect on dynamic foam stability [J]. Canadian Journal of Chemical Engineering, 2002, 80(2): 299-305.
[9] LASKOWSKI J S. Fundamental properties of the polyoxypropylene alkyl ether flotation frothers [J]. International Journal of Mineral Processing, 2003, 72(1/2/3/4): 289-299.
[10] LASKOWSKI J S, CHO Y S, DING K. Effect of frothers on bubble size and foam stability in potash ore flotation systems [J]. Canadian Journal of Chemical Engineering, 2003, 81(1): 63-69.
[11] EI-SHALL H, ABDEL-KHALEK N A, EI-MOFTY S. Role of frothers in column flotation of coarse phosphates [J]. Minerals and Metallurgical Processing, 2003, 20(4): 199-205.
[12] EI-SHALL H, ABDEL-KHALEK N A, SVORONOS S. Collector- frother interaction in column flotation of Florida phosphate [J]. International Journal of Mineral Processing, 2000, 58(1/2/3/4): 187- 199.
[13] HERNANDEZ-AGUILAR J R, CUNNINGHAM R, FINCH J A. A test of the Tate equation to predict bubble size at an orifice in the presence of frother [J]. International Journal of Mineral Processing, 2006, 79(2): 89-97.
[14] GUPTA A K, BANERJEE P K, MISHRA A. Effect of frothers on foamability, foam stability, and bubble size [J]. International Journal of Coal Preparation and Utilization, 2007, 27(1/2/3): 107-125.
[15] GUPTA A K, BANERJEE P K, MISHRA A. Effect of frothers on foamability, foam stability, and bubble size [J]. Coal Preparation, 2008, 27(1/2/3): 116-134.
[16] GUPTA A K. Effect of alcohol and polyglycol ether frothers on foam stability, bubble size and coal flotation [J]. International Journal of Mineral Processing, 2007, 82(3): 126-137.
[17] GUPTA A K. Hybrid first-principles/neural networks model for column flotation [J]. AIChE Journal, 1999, 45(3): 557-566.
[18] SUN Wei, HU Yue-hua and LIU Run-qing, Bubble size measurement in three-phase system using photograph technology [J]. Journal of Central South University of Technology, 2005, 12(6): 677-681.
[19] NESSET J E, FINCH J A, GOMEZ C O. Operating variables affecting the bubble size in forced-air mechanical flotation machines [C]// 9th Mill Operators�� Conference 2007. Fremantle, WA, Australia: Australasian Institute of Mining and Metallurgy, 2007: 55-65
[20] OTSU N. A threshold selection method from gray-level histograms [J]. IEEE Transactions on Systems, Man and Cybernetics, 1979, SMC-9(1): 62-67.
[21] LEON E B. Image processing to generate a virtual scene [C]// 2006 3rd International Conference on Electrical and Electronics Engineering. Veracruz, Mexico: Institute of Electricity and Electrical Engineering Computer Society, 2006: 6-8.
[22] SALDANA-GONZALEZ G. 2D image reconstruction with a FPGA-based architecture in a gamma camera application [C] // 20th International Conference on Electronics Communications and Computers. Cholula Puebla, Mexico: IEEE Computer Society, 2010: 102-105.
[23] GONZA-HIDALGO M, TORRES A M, SASTRE J T. Noisy image edge detection using an uniform fuzzy morphological gradient [C]// 9th International Conference on Intelligent Systems Design and Applications. Pisa, Italy: IEEE Computer Society, 2009: 1335-1340.
[24] GRAU R A. Forther effect on bubble size [J]. Metallic Ore Dressing Abroad, 2006(3): 33-46
[25] DAI Jing-long, XIE Guang-yuan, LIU Shan-shan, WANG Guang-xin. Analysis on factors affecting on size of flotation bubble [J]. Coal Preparation Technology, 2007(5): 7-10. (in Chinese)
(Edited by DENG L��-xiang)
Foundation item: Project(50834006) supported by National Natural of Science Foundation of China
Received date: 2010-10-27; Accepted date: 2011-03-29
Corresponding author: SUN Wei, Professor, PhD; Tel: +86-731-88830623; E-mail: sunmenghu@126.com
Abstract: A new visual method for quantitative measurement of frothers effect and flotation efficiency was presented. A self-designed electrolytic cell was chosen as the reaction environment with sodium chloride (NaCl) as the electrolyte. Constant current, supplied by a self-designed power supplier and fixed cathode and anode equipment, guaranteed the constant bubble volume per unit time. Even aperture of the cathode material guaranteed the original bubbles size to be uniform. Bubble generating equipment was connected with a microscopical camera. Statistic data collected by high speed charge-coupled device (CCD) and processed by software Sigmascan and Matlab could reflect bubble characteristics. The efficiency of dipropylene glycol monomethyl ether (DPM) and tripropylene glycol n-butyl ethel (TPnB) were measured at the same condition, and 2��10-4 mol/L and 5��10-2 mol/L were found to be the inflexions of bubble size changes.
