
Trans. Nonferrous Met. Soc. China 28(2018) 1200-1215
Finite element analysis of stress-strain localization and distribution in Al-4.5Cu-2Mg alloy
Rahul BHANDARI1, Prosanta BISWAS2, Manas Kumar MONDAL2, Durbadal MANDAL2
1. Department of Mechanical Engineering, Birbhum Institute of Engineering and Technology, Suri-731101, India;
2. Department of Metallurgical and Materials Engineering, National Institute of Technology, Durgapur-713209, India
Received 23 June 2017; accepted 12 December 2017
Abstract:
Finite element analysis has been carried out to understand the effect of various processing routes and condition on the microscale deformation behavior of Al�C4.5Cu�C2Mg alloy. The alloy has been developed through four different routes and condition, i.e. conventional gravity casting with and without refiner, rheocasting and SIMA process. The optical microstructures of the alloy have been used to develop representative volume elements (RVEs). Two different boundary conditions have been employed to simulate the deformation behavior of the alloy under uniaxial loading. Finally, the simulated stress-strain behavior of the alloy is compared with the experimental result. It is found that the microstructural morphology has a significant impact on stress and strain distribution and load carrying capacity. The eutectic phase always carries a higher load than the ��(Al) phase. The globular ��(Al) grains with thinner and uniformly distributed eutectic network provide a better stress and strain distribution. Owing to this, SIMA processed alloy has better stress and strain distribution than other processes. Finally, the simulated yield strength of the alloy is verified by experiment and they have great agreement.
Key words:
Al-4.5Cu-2Mg alloy; microstructure; ��(Al) phase; eutectic phase; finite element analysis; micromechanical response;
1 Introduction
The micromechanics based study is gaining lots of research interest for in-depth analysis of various engineering aspects and applications. The micro- mechanical approach is an important technique to understand the microscale deformation behavior of materials using an analytical and numerical method. In general, analytical methods are capable of providing the simpler reasonable predictions of microstructural features. These predictions are not enough to evaluate the actual morphology of a microstructure. This limitation has been overcome through the numerical methods. This approach includes computer numerical modelling that increases the realm of predictions through simplifying assumptions about size, shape and spatial distribution of grains/particles. Thus, the computational modelling and simulation flamed up the micromechanics based studies.
The micromechanics based studies of a dual phase material are terribly a robust job to assess the non-uniformities of the phases of a microstructure. However, this approach tends to be a powerful tool to get a fruitful prediction of the deformation and fatigue behavior of alloys [1]. Recently, SUN et al [2] vectorized the micrograph utilizing ArcMap and Photoshop and studied the failure mode of dual phase steel using the ABAQUS software. Furthermore, GANESH and CHAWLA [3] simulated the tensile behavior in the Abaqus environment by vectorizing the digital image of microstructure through an image processing software Raster-Vect. PAUL [1] developed the real microstructure based model using SEM images and simulated the microscale deformation behavior and failure initiation of dual phase steel using HyperMesh and ABAQUS software. In a recent work, SUI et al [4] studied the influence of microstructure features on deformation behavior and strain distribution of a cylindrical section using ANSYS/LS-DYNA software. In another study, ZHANG et al [5] developed a microstructure based on 3D cellular automaton (CA) algorithm and investigated the deformation behavior of polycrystalline ferritic stainless steel under tensile loading by finite element modeling. It was reported that the local stress and strain fields show non-uniformity at mesoscale. It was concluded that the deformation behavior of grains is related to the orientation of the individual grains and the interactions with adjacent grains. Furthermore, JI et al [6] simulated the strain localization in ��+�� titanium alloy to understand the effect of microstructural features on the mechanical response. It was reported that there are two types of strain localization bands (SLBs) namely short and long-continuous SLBs and short SLBs mainly appear in ��t and long-continuous SLBs appear in ��p. The strength of the alloy decreased with increase in ��p in SLBs, whereas ductility increases. In another recent study, LI et al [7] developed a multiscale 3D CACPFEM model to study the heterogeneous deformation with crystal plasticity, the mechanical response and microstructure evolution of titanium (TA15) alloy. It was found that the model is capable of the integrated prediction of the macroscale forming, mesoscale deformation mechanism and microscale microstructural evolution of materials. GHAVAM et al [8] also established a constitutive model to predict the hot tensile flow behavior of IMI834 titanium alloy (��+�� region) and it was found that the activation energy for the hot tensile deformation of the alloy is in the range from 519 to 557 kJ/mol at different strain values.
Nowadays, there are numerous processes to increase the mechanical properties of material. The semisolid metal (SSM) processing offers numerous advantage such as the reduction of macro segregations, porosity and low forming efforts over conventional methods like forging and traditional casting [9-17]. The prime objective of the semisolid processing is to obtain the non-dendritic microstructural morphology [9,18]. Consequently, a significant effort has been made to achieve globular microstructural structural morphology from any semi-solid process [17-22]. The semi-solid slurry prepared by stirring process known as rheocasting [23], is used directly for forming products. This process also ensures the near-spherical grain structure, but magnesium alloys have a problem of oxidation and combustion. It can be effectively reduced by strain-induced melt activation SIMA process [24] as this process combines both the casting and rolling process. It has several commercial advantages such as simplicity, low equipment cost and is applied to most engineering alloy systems, including aluminum, magnesium, copper and ferrous alloys [25-27].
The Al-Cu-Mg alloy is used in aircraft and automobile industries due to their light weight, improved tensile and fatigue strength and high hardness [28,29]. The properties of dual phase alloys are dependent on the volume fraction of phases, microstructural morphology and the presence of voids and microcracks.
In this work, Al-4.5Cu-2Mg alloy is synthesized by a traditional gravity casting process with and without refiner, rheocasting process and SIMA process. The Al-5Ti-1B master alloy is used as refining element. The developed alloy mainly consists of an Al rich primary phase (��(Al)) and Cu rich eutectic phase. The optical microstructures of the above-mentioned processes are simulated by finite element based ABAQUS CAE software to understand the impact of processing conditions and routes on microstructural morphology such as ��(Al) grain size and shape and the volume fraction of ��(Al) and eutectic phase regarding micromechanical response during uniaxial loading. Variation of stress and strain distribution in ��(Al) phase and binary eutectic phase are evaluated using Ramberg-Osgood model. The previous studies are mainly restricted to zonal result or a single node output, which is not adequate to understand the actual response of the material. Therefore, in the present work, each and every nodal response has been analyzed to understand the influence of ��(Al) grain size and shape and the volume fraction of ��(Al) and eutectic phase on mechanical properties of this alloy in terms of stress and strain distribution, stress localization, load carrying capacity and deformation of phases during uniaxial tensile loading.
2 Experimental
In this work, the commercially pure aluminum ingot (99.7%), magnesium (99.95%) and copper (99.95%) are used to develop an Al-4.5Cu-2Mg alloy. The small ingots of aluminum are kept in 3 kg capacity clay graphite crucible and melted at 720 ��C in a heat resistance furnace in a controlled inert gas (argon) atmosphere. The aluminum foil wrapped small pieces of commercially pure copper and magnesium are added to the completely melting aluminum. Then, the melt is stirred gently 2-3 times to ensure proper dissolution of all materials. After that, Al-5Ti-1B master alloy small pieces are added to the melt and hold for 10 min for complete dissolution. Then, a degasser, hexachloroethane (0.1%, mass fraction) is added to remove the dissolved gases from the melt. Afterward, the molten alloy is immediately poured into a preheated (��250 ��C) permanent cast iron mold.
In the rheocasting process, slag removed melt is stirred at 300 r/min with the help of a mechanical stirrer for about 10 min in a controlled isothermal condition. Then, the semi-solid mixture is poured into a preheated cast iron mold. Finally, mold with liquid metal is allowed to cool in the atmosphere. After air cooling, the samples are kept at 280 ��C for 1 h to preheat. Afterward, the samples are warm rolled in a four high rolling mill (250 mm in roll diameter and 300 mm in barrel length) to get 50% deformation at the recrystallisation temperature of the alloy.
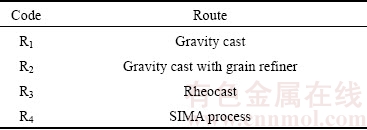
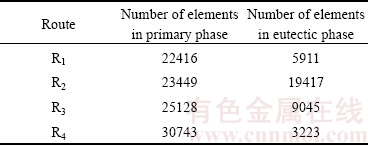
Standard procedures are followed to prepare the mirror finish metallography samples. The polished and etched samples are investigated under the optical microscope (Leica DM 2500) to observe microstructure and Vickers microhardness tester (Model-UH3, Reicherter and Stiefelmayer) is used to ascertain the microhardness of individual phases at 0.5 N load. Further, 50T Instron (Instron-8501) is used to test the tensile specimen made as per ASTM E8M standard at a strain rate of 10-3 s-1. Ultimate tensile strength (UTS), yield strength (YS) and elongation are estimated from recorded data. Different processing routes and conditions and their abbreviation used in this work are given in Table 1.
Table 1 Abbreviations used for different processing conditions and routes
3 Constitutive description
In this work, Ramberg-Osgood model [30] is employed to evaluate elasto-plastic behavior in terms of stress and strain distribution of Al-4.5Cu-2Mg alloy. The equation is as follows:
 (1)
(1)
where �� is the nominal stress, �� is the strain, E is the elastic modulus, and �� is the yield offset and n (>1) is the hardening exponent (non-linear term) for plastic deformation.
In the present constitutive law, Eq. (2) is used to calculate the strain energy density:
 (2)
(2)
The Newton��s method has been used to solve Eq. (1) for getting stress solution of the developed alloy by considering q=���� with an initial guess of ��=E|��| if E|��|�ܦ�0 and  if E|��|>��0, and c�� is modified to ��. The Newton equations for Eq. (1) can be written as follows:
 (3)
(3)
��=��-c�� (4)
The material stiffness in the present case is as follows:
 (5)
(5)
The plastic flow stresses of ��(Al) and eutectic phase are expressed by Eqs. (6) and (7) showing isotropic hardening behavior under loading:
 (6)
(6)
 (7)
(7)
where the initial yield strengths are represented by ��y,Al and ��y,Eu, hardening coefficients are represented by KAl and KEu and the hardening exponents are represented by nAl and nCu for the primary ��(Al) and eutectic phases, respectively.
4 Pre-modelling
The optical microstructure (Fig. 1) of the alloy has been vectorized using Vextractor image analysis software and a replica with dimensions of 0.45 mm �� 0.45 mm has been developed through AutoCAD software (Fig. 2). Then, the CAD model has been imported in a 2D ABAQUS planar modeling for simulation. Furthermore, the 2D RVEs size (0.45 mm �� 0.45 mm) has been selected in such a manner that it is able to represent the bulk microstructure structure of the alloy as well as it can simulate in less computational time.
The material property has been specified considering Ramberg-Osgood model. Quad-dominated linear plane strain elements with 0.03 mm global seed size have been used for meshing.
��Rule of mixture�� is used to calculate bulk hardness (H) of the present alloy:
H=VPHP+VE+HE (8)
where VP and HP are the volume fraction and micro-hardness of the primary ��(Al) phase, and VE and HE are the volume fraction and micro-hardness of the Cu rich eutectic phase, respectively.
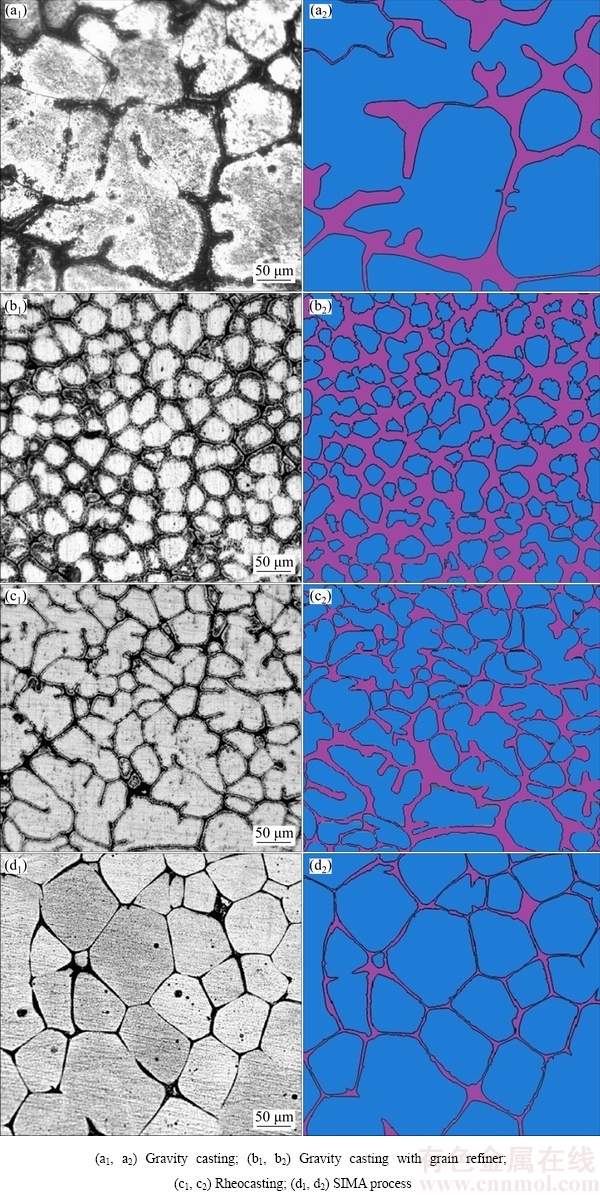
Fig. 1 Optical microstructures and vectorized RVEs
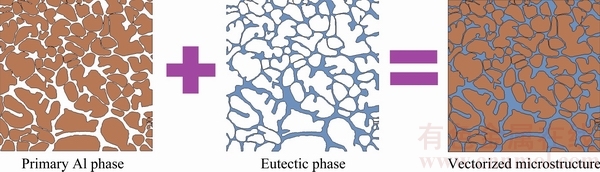
Fig. 2 Two-dimensional representative volume elements (RVEs) based on optical microstructure
Table 2 Calculated bulk hardness and phases volume fractions of Al-4.5Cu-2Mg alloy at different process routes and conditions
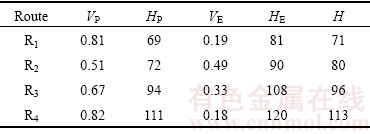
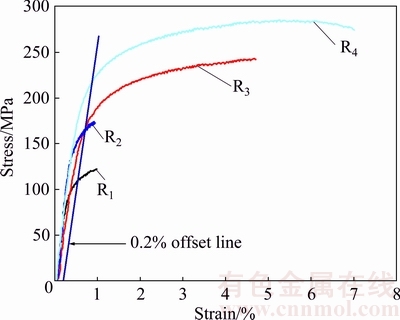
Fig. 3 Stress-strain diagram of alloy with 0.2% offset
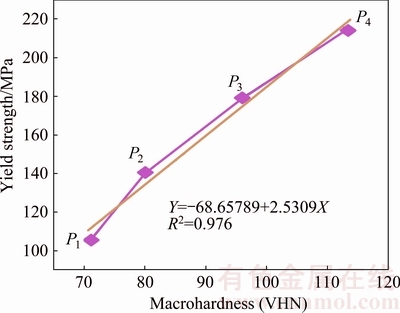
Fig. 4 Curve fitting for predicting yield strength of different phases
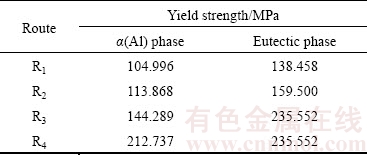
The volume fraction was measured by ImageJ image analysis software by considering 10 image frames and the micro hardness is obtained through the Vickers micro-hardness test. The volume fraction and micro-hardness of individual phases and bulk hardness are given in Table 2. The yield strength of the alloy is calculated by 0.2% offset of the linear range slope of the stress-strain curve (Fig. 3) and the yield strength of individual phases is calculated from the curve fitting equation between bulk hardness and yield strength (as shown in Fig. 4) and the curve fitting equation is expressed by Eq. (9). The phases yield strengths are summarized in Table 3.
Y=-68.65789+2.53509X (9)
where Y and X are the yield strength and the macro- hardness of the individual phase.
Table 3 Estimated yield strength of a(Al) and eutectic phase with different process routes and conditions
In this work, the boundary conditions are assumed on the basis of tensile testing. The Al-4Cu-2Mg alloy is ductile in nature. Therefore, cup and cone type of fracture will occur during failure. Two different types of boundary conditions have been considered for the simulation of uniaxial tensile testing. The similar boundary conditions have been previously used by KIM et al [31]. The Case-I boundary condition (Fig. 5(a)) is considered for the simulation of the necking behavior of the material. The left edge is completely fixed and at the right edge known displacement is given in X-direction laterally. The Y-direction is kept free so that it can move easily in the transverse direction of the loading. The top and bottom edges are left free from any boundary condition, whereas rotational motions are restricted. Case-II boundary condition (Fig. 5(b)) is used to simulate the uniaxial displacement behavior. The left edge is restricted to move in X (lateral) direction, but it can move in Y (transverse) direction and at the right edge the known displacement is given. The top edge is allowed to move in X-direction but not in Y-direction and all rotational movements are restricted.
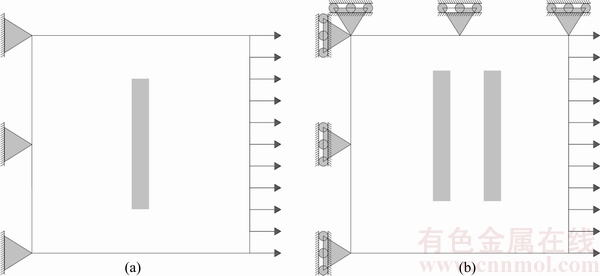
Fig. 5 Schematic representation of Case-I (a) and Case-II (b) boundary conditions
However, considering displacement control method, deformation is specified. The experimental values of the tensile results have been applied to predict the displacement values. In the present simulation, the equation required to calculate the displacement values is represented by
d=0.45��l/l (10)
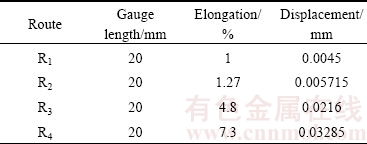
where d, l, and ��l are the displacement, gauge length and elongation of the tensile sample, respectively. The displacement values used for different processing routes and conditions used are listed in Table 4.
Table 4 Gauge length, elongation and calculated displacement values used to simulate RVEs
5 Result and discussion
5.1 Microstructural evaluation
The optical microstructure of the Al-4.5Cu-2Mg alloy consists of two phases: primary ��(Al) and Cu-rich eutectic phases (Fig. 1). The volume fraction of ��(Al) and eutectic phase is measured using ImageJ image analysis software by considering ten image frames and the results are present in Table 2.
The optical microstructure of gravity cast Al-4.5Cu-2Mg alloy without grain refiner exhibits the presence of coarse dendritic ��(Al) phase (Fig. 1(a)) whereas the gravity cast alloy with grain refiner reveals the presence of fine and nearly spherical primary ��(Al) grains (Fig. 1(b)). It is also observed that the distribution of the eutectic phase becomes uniform and its volume fraction is increased, but volume fraction of primary ��(Al) phase is decreased. Further, the rheocast alloy consists of both dendritic and non-dendritic primary ��(Al) phase (Fig. 1(c)) with a relatively high volume fraction of eutectic phase with regard to gravity cast alloy without grain refiner. The primary ��(Al) phase of the SIMA processed alloy is relatively non-dendritic, globular than the rheocast alloy (Fig. 1(d)). The SIMA processed alloy has less amount of uniformly distributed eutectic phase network than other processes. Therefore, it is clear that each processing condition has a different microstructural morphology and volume fraction of phases. It is well established that the mechanical properties of metals or alloys depend on the microstructural morphology and the volume fraction of constituent phases. The SIMA processed alloy exhibit superior mechanical properties to other processes. The hardness, yield strength and elongations of the developed alloy are given in Tables 2, 3 and 4, respectively.
5.2 Effect of microstructural features on stress-strain distribution
The von Mises stress distributions in different RVEs (R1, R2, R3 and R4) are shown in Fig. 6. The RVEs are simulated employing Case-1 boundary condition. Figure 6(a) shows the simulated RVE of gravity cast alloy without grain refiner. It is observed that the stresses are localized (red bands) at the narrow eutectic phase region and irregular stress distribution is also observed in ��(Al) phase and eutectic phase due to non-uniform distribution of phases. This stress, localized region (red bands) will act as a failure initiation point. Further, the simulated RVE of grain-refined alloy (Fig. 6(b)) has uniformly distributed high-stress area (orange and red bands) in the eutectic region and a range of the low-stress green band in ��(Al) grains. It is also very interesting to note that the grain refined alloy has a more uniform distribution of stress as compared to normal gravity cast alloy due to the presence of fine and equiaxed ��(Al) grains with a uniformly distributed eutectic network. On the other hand, the refined grain alloy contains more volume fraction of the thicker eutectic phase, which carries the maximum applied load, and as a result, there is a huge difference in induced stress between primary ��(Al) phase and eutectic phase. This difference in stress distribution may cause an unexpected failure from the interface of phases. Although the mixture of red and orange bands will act as failure initiation sites, failure may occur fewer spaces away than that of an unrefined alloy. Moreover, the stress distribution in the rheocast alloy (Fig. 6(c)) shows that it has more low-stress regions (green and yellow bands). Therefore, the alloy processed through R3 route is more admirable than the alloy processed through R2 route because the failure occurs a few steps away from R2. This improvement can be observed as a result of uniformly distributed thinner eutectic phase network within a higher volume of ��(Al) phase. Finally, RVE of R4 is compared with other processes (R1, R2 and R3) and it has a uniform stress distribution (green and yellow stress bands with a bit combination of orange bands) due to the presence of least eutectic network with more globular ��(Al) grains.
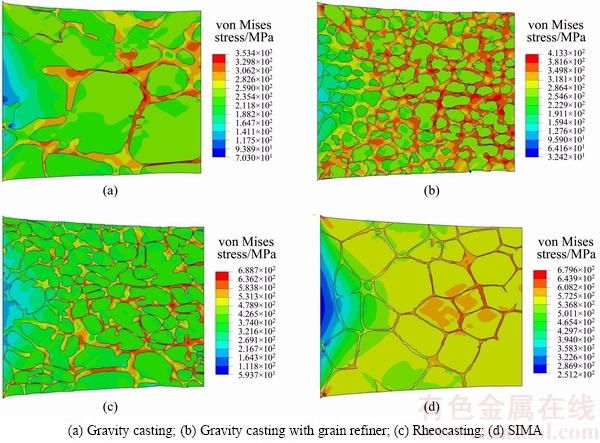
Fig. 6 von Mises stress distribution in different RVEs using Case-I boundary condition
Figure 7 displays the von Mises stress distribution in different RVEs (R1, R2, R3 and R4) employing Case-II boundary condition. The stress distributions are akin to Case-I boundary condition.
The equivalent plastic strain distribution of different RVEs under Case-I boundary condition is shown in Fig. 8. The initiation of strain bands occurs from corners of the stationary edge of RVEs and subsequently spreads transversely (Fig. 8). The strain induction is observed in a few locations of the simulated gravity cast alloy (Fig. 8(a)), and as a result, certain failure may happen due to void initiation in those regions during uniaxial loading. Further, in Fig. 8(b), the induced strain spreads diagonally from the top and bottom corner of the fixed end and nearly uniform distribution is found (greenish strain bands) due to the presence of finer, non-dendritic and regular shaped primary ��(Al) phase in the refined grain alloy. Moreover, Fig. 8(c) shows that the rheocast alloy has more uniform strain distribution containing greenish and green bands. Furthermore, the SIMA processed RVE (Fig. 8(d)) has more uniform strain distribution compared to the rheocast RVE.
The equivalent plastic strain of different RVEs (R1, R2, R3 and R4) using Case-II boundary condition is shown in Fig. 9. The simulated result (Fig. 9) clearly indicates that the mechanical properties improve incrementally from R1 to R2, R2 to R3 and R3 to R4 as the strain localized region and induced strain difference between ��(Al) phase and eutectic phase are reduced and the overall uniformity of strain distribution is increased. The uniformity in strain distribution is found, and therefore, the modification of non-uniform dendritic primary ��(Al) grains to uniform globular primary ��(Al) grains results in the advancement of mechanical properties. Thus, R4 sample developed through SIMA process excels from the others.
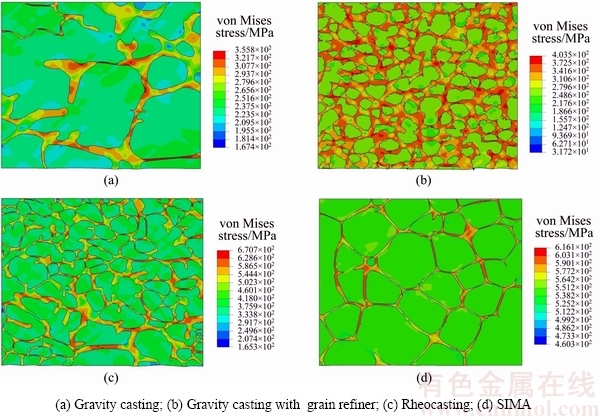
Fig. 7 von Mises stress distribution in different RVEs using Case-II boundary condition
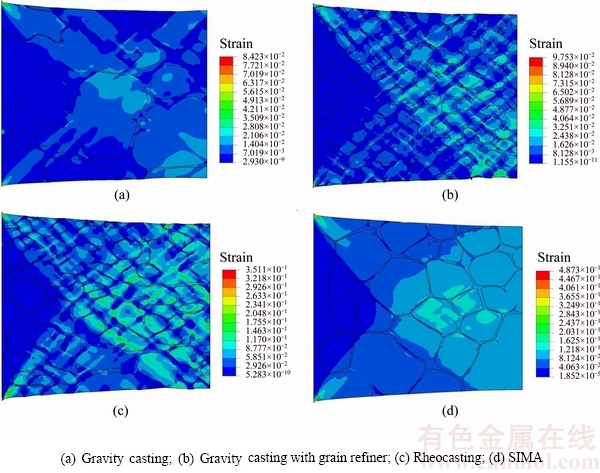
Fig. 8 Equivalent plastic strain distribution of different RVEs using Case-I boundary condition
The frequency plot of the stress distribution in various RVEs considering Case-I boundary condition is shown in Figs. 10-13. Elemental details of the primary ��(Al) and eutectic phase are summarized in Table 5.
Figure 10 shows the elemental stress distribution in primary ��(Al) and eutectic phase of alloy without refiner. It is found that there is a significant difference in stress distribution between primary ��(Al) and eutectic phase.
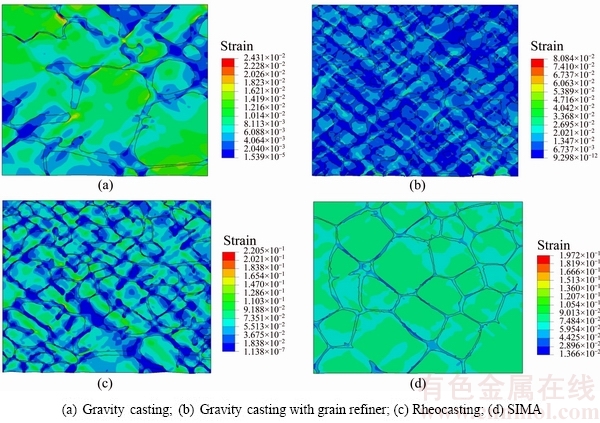
Fig. 9 Equivalent plastic strain distribution of different RVEs using Case-II boundary condition
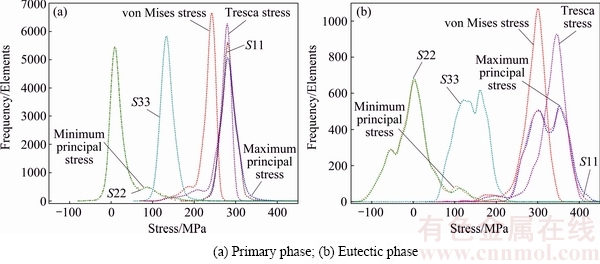
Fig. 10 Elemental stress distribution in different phases of gravity cast alloy

Fig. 11 Elemental stress distribution in different phases of grain refined alloy

Fig. 12 Elemental stress distribution in different phases of rheocast alloy
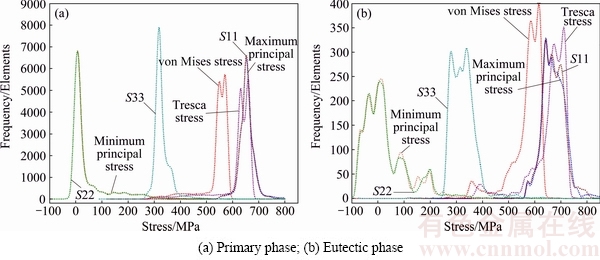
Fig. 13 Elemental stress distribution in different phases of SIMA processed alloy
Table 5 Elemental details of primary ��(Al) and eutectic phase in simulated RVEs
The primary ��(Al) phase carries a minimum stress (von Mises stress) of 70 MPa but the elements are concentrated in a stress range of 125-260 MPa. The minimum stress carried by eutectic phase is 60 MPa but most elements are in stress range of 130-355 MPa. Figure 10(b) clearly shows that 80% of a total number of elements of the eutectic phase is in the high-stress zone and range of stress is large with respect to ��(Al) phase. It is concluded that the eutectic phase has less uniformities in stress distribution. So, eutectic phase is more prone to failure compared to primary ��(Al) phase. Also, other stresses have more or less similar types of behavior with different stress values. Figure 11 reveals that the refining alloy has higher induced stress (von Mises stress) in both the phases. The ��(Al) phase carries a minimum stress of 120 MPa but the maximum number of elements lies between 200 and 320 MPa. And the eutectic phase has a minimum induced stress of 140 MPa but elements are concentrated between 230 and 425 MPa. It is very interesting that the stress is decreased in grain refined alloy, which signifies that the grain refined alloy has a uniform distribution of stress, and as a result, the possibility of failure is reduced. This improvement is caused by an effect of microstructure modification by the refiner. The rheocast alloy also has higher induced stress (von Mises stress) with improved distribution compared with the grain refined alloy (Fig. 12). The ��(Al) phase carries a minimum stress of 180 MPa but the number of elements is much large in the range of 330-430 MPa. The eutectic phase has a minimum stress of 200 MPa and most elements carry a stress between 400 and 700 MPa. Further, the SIMA alloy has a more uniform stress (von Mises stress) distribution throughout both phases. The ��(Al) phase and eutectic phase carry approximately the same amount of minimum stress (340 MPa) and the range of maximum elements carrying stress is also in a similar range: 515-595 MPa for ��(Al) phase and 520-655 MPa for eutectic phase. This reduces the chance of failure at the interface of the ��(Al) phase and eutectic phase and also removes the stress localization in ��(Al) and eutectic phase because this SIMA processed alloy has higher mechanical properties. Furthermore, some elements (minimum principal stress and S22) are seen experiencing the compressive stress in both phases due to the lateral contraction accompanying a longitudinal extension (i.e. basically the Poisson effect) and irregular stress distribution. In primary ��(Al) phase, the stress distribution of minimum principal and S22 stresses are approximately similar in the ranges from -20 to 180 MPa whereas stress distribution in eutectic phase is in the range from -120 to 220 MPa. Moreover, stress in the z-z direction (S33) is observed from the simulated results due to plane strain condition and this indicates the existence of stress but no strain.
Figures 14-17 show the various elemental strains in simulated RVEs (R1, R2, R3 and R4) using Case-I boundary condition. It is also revealed that the eutectic phase elements experience lower values of strain with respect to ��(Al) phase in every RVE. This signifies that the eutectic phase has a higher load carrying capacity and higher induced stress under tensile loading. It is also found that the elemental strain value is increased when the RVEs shift incrementally from R1 to R4 and also the distribution of elemental strain becomes uniform. The ��(Al) and eutectic phase elemental strain values are more or less similar in R3 and R4 processed alloy. So, the distribution of elemental strain is uniform throughout the RVEs. This reduces the chance of failure because strain localization is not present in the interface of ��(Al) and eutectic phase. Due to this, the SIMA processed alloy has higher mechanical properties experimentally. Furthermore, minimum principal strain and E22 account negative strain, which indicates that during the experimental tensile test, some portions (elements) experience compressive load due to the poison��s effect. The E33 (strain in z-z direction) is absent due to the plain strain condition which is clearly observed in simulated RVEs (Figs. 14-17). The analysis shows that though there are high stress and strain levels in SIMA process, the failure will occur few steps away from other processed alloys. It is also claimed that the failure probability of R1 and R2 is the highest, that of R3 is lower and that of R4 is the lowest. This leads to the conclusion that SIMA process is better than the other processes.

Fig. 14 Elemental strain distribution in different phases of gravity cast alloy
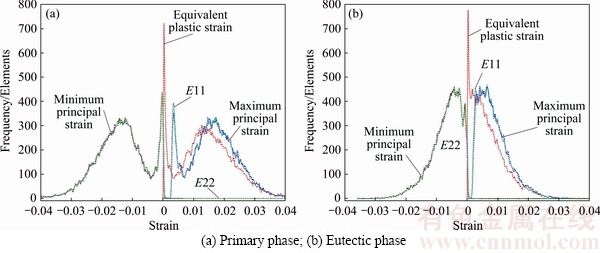
Fig. 15 Elemental strain distribution in different phases of grain refined alloy
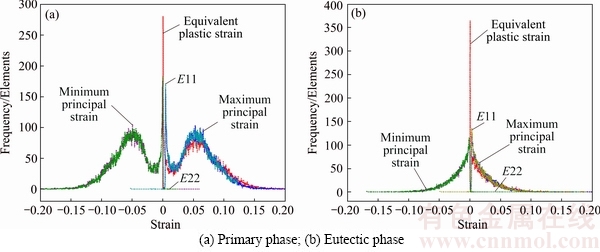
Fig. 16 Elemental strain distribution in different phases of rheocast alloy
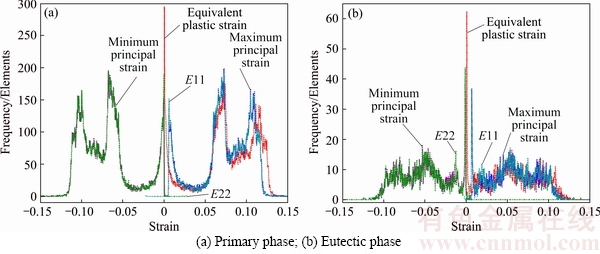
Fig. 17 Elemental stress distribution in different phases of SIMA alloy
5.3 Load carrying behavior of phases
The von Mises stress and the equivalent strain distribution of SIMA processed alloy with different strain levels employing Case-I boundary condition are shown in Fig. 18. At the beginning of loading (1.829% strain), nearly equal stress is developed in primary ��(Al) phase and eutectic phase (Fig. 18(a1)) whereas the equivalent strain distribution (Fig. 18(a2)) is similar throughout the whole domain. Further, with increase in loading (3.6498% strain), the stress is initiated from all four corners of the domain and gradually the stress is transferred diagonally from the right corner of the RVEs (Fig. 18(b1)). At this time, stress development in the eutectic phase is more than that in the primary phase and the equivalent strain development (Fig. 18(b2)) is similar to the stress (Fig. 18(b1)) but it is also observed that some of the grains are not affected at 3.6498% strain level. At 5.4747% strain level (Figs. 18(c1) and (c2)), the stress and strain development in different phases is increased and more load is carried by the eutectic phase than the primary ��(Al) phase (Fig. 18(c1)). At the highest strain level (7.3% strain) (Figs. 18(d1) and (d2)), stress and strain development is nearly similar to Figs. 18(c1) and (c2), respectively. Figures 18(d1) and (d2) reveal similar predictions as those of Figs. 18(c1) and (c2), respectively.
Figure 19 shows the von Mises stress and the equivalent plastic strain distribution of SIMA processed alloy using Case-II boundary condition at various strain levels. It is found that at the initial stage of loading (1.8249% strain), the induced stress (Fig. 19(a1)) is more or less similar in the primary ��(Al) phase and the eutectic phase and the induced plastic strain (Fig. 19(a2)) is perfectly same in both the phases. Further, with increase in strain level (3.6498%) (Fig. 19(b1)), induced stress is increased in both phases and the eutectic phase has higher induced stress (orange band) compared with the primary ��(Al) phase (yellowish-green band). Moreover, the deformation responses of eutectic phase and nearby primary phase do not have any significant change because the stress is not enough to deform the eutectic phase (Fig. 19(b2)). At 5.4747% and 7.3% strain level, the stress in the eutectic phase is maximized as the load is transmitted from primary ��(Al) phase to the eutectic phase at the onset of failure (Figs. 19(c1) and (d1)). At these strain levels, deformation in eutectic phase is clearly visible (Figs. 19(c2)) and (d2)) and these results are very similar to the actual experimental result of any dual phase alloy at uniaxial tensile testing. Furthermore, the simulated results have been compared with experimental results (Fig. 20). It is found that there is a good agreement between experimental and simulated data.
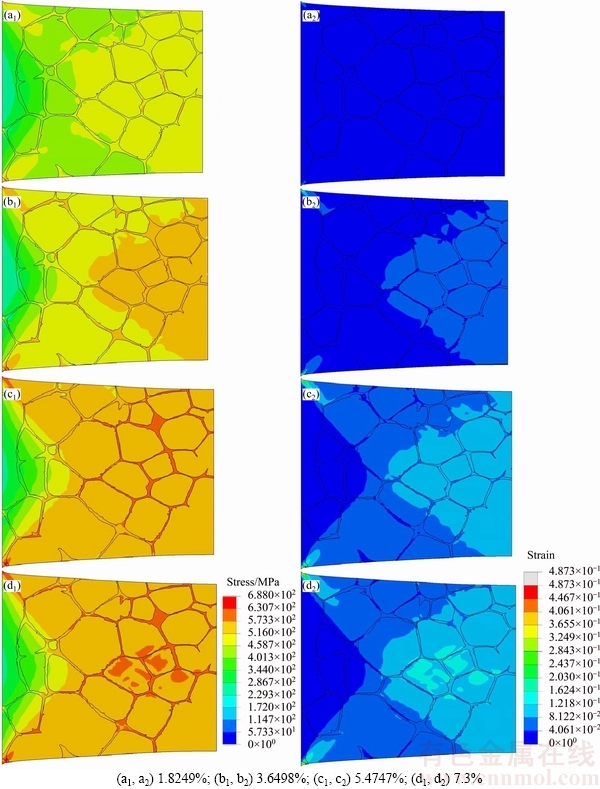
Fig. 18 von Mises stress (a1-d1) and equivalent strain distribution (a2-d2) of SIMA processed alloy employing Case-I boundary conditions at different strains
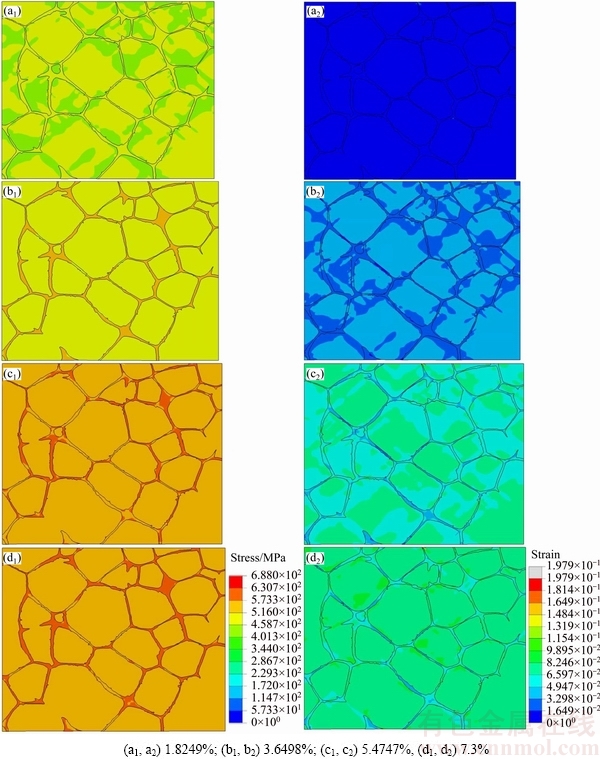
Fig. 19 von Mises stress (a1-d1) and equivalent strain distribution (a2-d2) of SIMA processed alloy employing Case-II boundary conditions at different strains

Fig. 20 Comparison of simulated and experimental yield strength as function of processing route
6 Conclusions
The presence of inhomogeneous microstructural features results in the stress concentration and plastic strain localization. These strain-localized zone or element causes local shear failure, which develops microvoids that are responsible for the final failure. As a result, the gravity cast alloys have comparatively poor mechanical properties with respect to rheocast and SIMA processed alloy as the gravity cast alloy has a dendritic ��(Al) phase with a nonuniform eutectic phase network. The eutectic phase carries a higher load and it has high induced stress with non-uniform distribution of stress. Moreover, the negative stress and strain are observed because during tensile testing some portions/elements of the specimen experience compressive load. At the initial stage of loading, stress and strain distributions are uniform and both the phases mutually carry the applied load. With further increase in load, the stress-strain distribution becomes non-uniform, giving rise to strain localization zone.
References
[1] PAUL S K. Real microstructure based micromechanical model to simulate microstructure level deformation behavior and failure initiation in DP 590 steel [J]. Materials & Design, 2013, 44: 397-406.
[2] SUN X, CHOI K S, LIU W N. Predicting failure modes and ductility of dual phase steels using plastic strain localization [J]. International Journal of Plasticity, 2009, 25: 1888-1909.
[3] GANESH V V, CHAWLA N. Effect of particle orientation anisotropy on the tensile behavior of metal matrix composites experiments [J]. Materials Science and Engineering A, 2005, 391: 342-353.
[4] SUI F, ZUO Y, ZHAO J, MA B. Determination of the observation area for metallographic microstructure of gh4033 superalloy in a uniaxially thermo-mechanical compression experiment [J]. Acta Metallurgica Sinica (English Letters), 2014, 27: 494-500.
[5] ZHANG C, ZHANG L W, SHEN W F, XIA Y N, YAN Y T. 3D crystal plasticity finite element modeling of the tensile deformation of polycrystalline ferritic stainless steel [J]. Acta Metallurgica Sinica (English Letters), 2017, 30: 79-88.
[6] JI Z, YANG H, LI H. Predicting the effects of microstructural features on strain localization of a two-phase titanium alloy [J]. Materials & Design, 2015, 87: 171-180.
[7] HONGWEI L, XINXIN S, HE S. A three-dimensional cellular automata-crystal plasticity finite element model for predicting the multiscale interaction among heterogeneous deformation, DRX microstructural evolution and mechanical responses in titanium alloys [J]. International Journal of Plasticity, 2016, 87: 154-180.
[8] GHAVAM M H, MORAKABATI M, ABBASI S M, BADRI H. Flow behavior modeling of IMI834 titanium alloy during hot tensile deformation [J]. Transactions of Nonferrous Metals Society of China, 2015, 25: 748-758.
[9] CHEN S D, LIU X H, LIU L Z. Grain statistics effect on deformation behavior in asymmetric rolling of pure copper foil by crystal plasticity finite element model [J]. Transactions of Nonferrous Metals Society of China, 2015, 25: 3370-3380.
[10] WANG J G, LU P, WANG H Y, JIANG Q C. Effect of predeformation on the semisolid microstructure of Mg-9Al-0.6Zn alloy [J]. Materials Letters, 2004, 58: 3852-3856.
[11] WANG Z Y, JI Z S, SUN L X, XU H Y. Microstructure of semi-solid ADC12 aluminum alloy adopting new SIMA method [J]. Transactions of Nonferrous Metals Society of China, 2010, 20: 744-748.
[12] WANG L P, JIANG W Y, CHEN T, FENG Y C, ZHOU H Y, ZHAO S C, LIANG Z Q, ZHU Y. Spheroidal microstructure formation and thixoforming of AM60B magnesium alloy prepared by SIMA process [J]. Transactions of Nonferrous Metals Society of China, 2012, 22: 435-444.
[13] JIANG J F, WANG Y, LIU J, QU J J, DU Z M, LUO S J. Microstructure and mechanical properties of AZ61 magnesium alloy parts achieved by thixo-extruding semisolid billets prepared by new SIMA [J]. Transactions of Nonferrous Metals Society of China, 2013, 23: 576-585.
[14] WANG J G, LU P, WANG H Y, LU J F, JIANG Q C. Semisolid microstructure evolution of the predeformed AZ91D alloy during heat treatment [J]. Journal of Alloys and Compounds, 2005, 395: 108-112.
[15] CHEN T J, HAO Y, SUN J. Microstructural evolution of previously deformed ZA27 alloy during partial remelting [J]. Materials Science and Engineering A, 2002, 337: 73-81.
[16] CZERWINSKI F, ZIELINSKA-LIPIEC A, PINET P J, OVERBEEKE J. Correlating the microstructure and tensile properties of a thixomolded AZ91D magnesium alloy [J]. Acta Materialia, 2003, 51: 1225-1235.
[17] JIANG Q C, WANG H Y, WANG J G, LU P, WANG Y, MA B X. Effect of TiB2particulate on partial remelting behavior of Mg-11Al-0.5Zn matrix composite [J]. Materials Science and Engineering A, 2004, 381: 223-229.
[18] TZIMAS E, ZAVALIANGOS A. Evolution of near-equiaxed in the semisolid state [J]. Materials Science and Engineering A, 2000, 289: 228-240.
[19] CHEN C P, TSAO C Y A. Semisolid deformation of nondendritic structures-1. Phenomenological behavior [J]. Acta Materialia, 1997, 45: 1955-1968.
[20] WANG J L, SU Y H, TSAO C Y A. Structural evolution of conventional cast dendritic and spray-cast nondendritic structures during isothermal holding in the semisolid state [J]. Scripta Mater, 1997, 37: 2003-2007.
[21] CZERWINSKI F,ZIELINSKA-LIPIECA. The melting behaviour of extruded Mg-8Al-2Zn alloy [J]. Acta Materialia, 2003,51: 3319-3332.
[22] CZERWINSKI F. Semisolid extrusion molding of Mg-9%Al-1%Zn alloys [J]. Journal of Materials Science,2004,39:463-468.
[23] BOLOURI A, SHAHMIRI M, CHESHMEH E N H. Microstructural evolution during semi-solid state strain induced melt activation process of aluminium [J]. Transactions of Nonferrous Metals Society of China, 2010, 20: 1663-1671.
[24] XIA M X, ZHENG H X, YUAN S, LI J G. Recrystallization of preformed AZ91D magnesium alloys in the semisolid state [J]. Materials & Design, 2005, 26: 343-349.
[25] FLEMINGS M C. Behavior ofmetalalloys in the semisolid state [J]. Metallurgical Transactions A, 1991, 22: 957-981.
[26] KIRKWOOD D H. Semisolid metal processing [J]. International Material Review, 1994, 39: 173-189.
[27] JIANG H, LU Y, HUANG W, LI X, LI M. Microstructural evolution and mechanical properties of the semisolid Al-4Cu-Mg alloy [J]. Materials Characterization, 2003, 51: 1-10.
[28] NAFSIN N, RASHED H M M A. Effects of copper and magnesium on microstructure and hardness of Al-Cu-Mg alloys [J]. International Journal of Engineering and Advanced Technology, 2013, 2: 2249-8958.
[29] XIAO D H, WANG J N, DING D Y, CHEN S P. Effect of Cu content on the mechanical properties of an Al-Cu-Mg-Ag alloy [J]. Journal of Alloys and Compounds, 2002, 343: 77-81.
[30] Deformation plasticity, abaqus analysis user's manual 6.10 [M]. Section 20.2.13. Dassault Systems, 2010.
[31] KIM J H, LEE M, KIM D, WAGONER R H. Micromechanics-based strain hardening model in consideration of dislocation-precipitate interactions [J]. Metals and Materials International, 2011, 17: 291-300.
Al-4.5Cu-2Mg�Ͻ�Ӧ��-Ӧ�䶨λ���ֲ�������Ԫ����
Rahul BHANDARI1, Prosanta BISWAS2, Manas Kumar MONDAL2, Durbadal MANDAL2
1. Department of Mechanical Engineering, Birbhum Institute of Engineering and Technology, Suri-731101, India;
2. Department of Metallurgical and Materials Engineering, National Institute of Technology, Durgapur-713209, India
ժ Ҫ��ͨ������Ԫ����������ͬ�ӹ�·�ߺ�������Al-4.5Cu-2Mg�Ͻ����α���Ϊ��Ӱ�졣�Ͻ����4�ֲ�ͬ�ļӹ������������Ʊ����ֱ�Ϊ�л���ϸ�����ij����������졢���������SIMA���ա��ԺϽ�Ĺ�ѧ���ṹ��Ϊ���������Ԫ(RVEs)���������ֲ�ͬ�ı߽�����ģ��Ͻ��ڵ����غ������µı�����Ϊ�����ģ���Ӧ��-Ӧ����Ϊ��ʵ�������бȽϡ�����������۽ṹ��̬��Ӧ����Ӧ��ֲ�������������������Ӱ�죬������Ȧ�(Al)���ܳ��ܸ��ߵ��غɣ����нϱ��Ҿ��ȷֲ��Ĺ�������ṹ����״��(Al)�����ṩ���õ�Ӧ����Ӧ��ֲ�����ˣ�SIMA �ӹ��Ͻ�����������ӹ��Ͻ�ӵ�и��õ�Ӧ����Ӧ��ֲ�������úϽ��ģ������ǿ����ʵ�������֤��������нϺõ�һ���ԡ�
�ؼ��ʣ�Al-4.5Cu-2Mg�Ͻ�����֯����(Al)�ࣻ�����ࣻ����Ԫ����������ѧ��Ӧ
(Edited by Bing YANG)
Corresponding author: Manas Kumar MONDAL; Tel: +91-343-2754736; Fax: +91-343-2547375; E-mail: manas.nitdgp@gmail.com
DOI: 10.1016/S1003-6326(18)64758-2
Abstract: Finite element analysis has been carried out to understand the effect of various processing routes and condition on the microscale deformation behavior of Al�C4.5Cu�C2Mg alloy. The alloy has been developed through four different routes and condition, i.e. conventional gravity casting with and without refiner, rheocasting and SIMA process. The optical microstructures of the alloy have been used to develop representative volume elements (RVEs). Two different boundary conditions have been employed to simulate the deformation behavior of the alloy under uniaxial loading. Finally, the simulated stress-strain behavior of the alloy is compared with the experimental result. It is found that the microstructural morphology has a significant impact on stress and strain distribution and load carrying capacity. The eutectic phase always carries a higher load than the ��(Al) phase. The globular ��(Al) grains with thinner and uniformly distributed eutectic network provide a better stress and strain distribution. Owing to this, SIMA processed alloy has better stress and strain distribution than other processes. Finally, the simulated yield strength of the alloy is verified by experiment and they have great agreement.
