

In-situ loading neutron-diffraction studies of a cobalt-based superalloy
M. L. BENSON1, P. K LIAW1, H. CHOO1,2, T. A. SALEH1,3, D. W. BROWN3, M. R. DAYMOND4,
X. L. WANG5, A. D. STOICA5, E. C. OLIVER6, D. L. KLARSTROM7
1. Department of Materials Science and Engineering, University of Tennessee, Knoxville, TN 37996, USA;
2. Metals and Ceramics Division, Oak Ridge National Laboratory, Oak Ridge, TN 37831, USA;
3. Los Alamos Neutron Science Center, Los Alamos National Laboratory, Los Alamos, NM 87545, USA;
4. Department of Mechanical and Materials Engineering, Queen��s University, Kingston, ON K7L3N6, Canada;
5. Spallation Neutron Source, Oak Ridge National Laboratory, Oak Ridge, TN 37831, USA;
6. ISIS Pulsed Neutron and Muon Source, Rutherford-Appleton Laboratory, Chilton, Didcot OX11 0QX, UK;
7. Haynes International Inc, Kokomo, IN 46904, USA
Received 20 April 2006; accepted 30 June 2006
Abstract:
ULTIMET? alloy is a cobalt-based superalloy that undergoes a deformation-induced phase transformation from a face-centered-cubic (fcc) phase to a hexagonal-close-packed (hcp) phase. The transformation was studied during monotonic loading, stress-controlled high-cycle fatigue (HCF) and strain-controlled low-cycle fatigue (LCF). The HCF was performed at a maximum stress of ��max =840 MPa and a minimum stress of ��min =84 MPa, while the tensile experiment was terminated after reaching ��max =890 MPa. The LCF was performed at a maximum strain of ��max=1.25 % and a minimum strain of ��min=-1.25 %. The monotonic-loading experiment results reveal that the hcp phase forms after reaching the yield stress. During HCF, the hexagonal phase forms immediately upon the first fatigue cycle, with no further change in structure upon subsequent deformation. In contrast to HCF, the hcp phase forms gradually during LCF. In fact, fatigue cycle 12 is reached before the hcp phase is resolved by neutron diffraction. Diffraction patterns from subsequent fatigue cycles reveal that the hcp phase continues to accumulate as LCF progresses. These observations can be related to the input of mechanical energy during different loading modes.
Key words:
cobalt-based superalloy; fcc phase; in-situ loading; neutron-diffraction; hcp phase;
1 Introduction
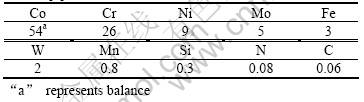
ULTIMET? alloy, a cobalt-based superalloy with a nominal composition given in Table 1[1], offers a unique system for the study of deformation behavior because it undergoes a deformation-induced phase transformation from the face-centered-cubic (fcc) structure to the hexagonal-close-packed (hcp) structure[2]. The fatigue properties of the alloy have already been extensively characterized by JIANG et al[3-7]. The material was tested in both high-cycle fatigue (HCF) and low-cycle fatigue (LCF) conditions. In this context HCF refers to cyclic loading applied under stress-controlled mode, while LCF refers to cyclic loading applied under strain-controlled mode. The material exhibits a fatigue- endurance limit of approximately 500 MPa during HCF. In addition, JIANG et al developed a statistical model that described the effects of maximum stress, environment(i.e. air or vacuum), and Rstress(Rstress=��min/��max, where ��min and ��max are the applied minimum and maximum stress, respectively) on the fatigue life for this loading mode[4]. Strain-life curves were developed for the alloy during LCF at three different temperatures: 298, 873 and 1 173 K. The fatigue life increases from 298 K to 873 K, but it decreases from 873 K to 1 173 K[7].
The previous work on ULTIMET? alloy raised one main issue. Namely, the abnormal fatigue-life trend as a function of temperature, which was found under LCF conditions, has yet to be explained. In order to address this issue, a regiment of in-situ loading neutron-diffraction experiments on ULTIMET? alloy were designed. Here the results of in- situ tension, HCF, and LCF experiments were described at room temperature.
Table 1 Nominal composition of ULTIMET? alloy in mass fraction[1] %
2 Experimental
The in-situ tensile and HCF experiments were performed on the spectrometer for materials research aunder some temperature and stress(SMARTS) at Los Alamos Neutron Science Center of Los Alamos National Laboratory in the United States, while the in-situ LCF was performed on ENGIN-X at the ISIS Pulsed Neutron and Muon Source of Rutherford-Appleton Laboratory in the United Kingdom. The two instruments employ a similar scattering geometry. The tensile specimen is oriented 45o to the incident neutron beam with the scattering angle fixed at 2�� = ��90o for two detector banks[8,9]. The scattering vector is oriented parallel to the loading direction of the specimen (i.e., the axial data) and perpendicular to the loading direction of the specimen (i.e., the transverse data) for the two detector banks. For each experiment, diffraction patterns were measured on the specimens before any mechanical load was applied.
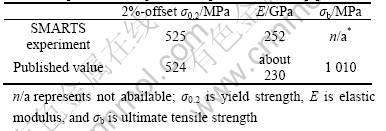
The macroscopic stress��strain curve from the in-situ tensile experiment is shown in Fig.1. The mechanical properties obtained from this experiment, along with previously published values, are shown in Table 2[1]. Neutron-diffraction patterns were measured at 25 points along the engineering stress��strain curve: 14 points in the elastic regime, 8 points in the plastic regime, and 3
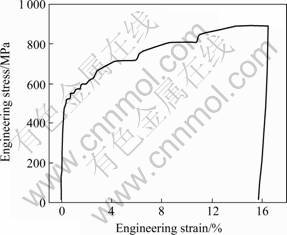
Fig.1 Macroscopic stress��strain curve obtained during an in-situ neutron-diffraction monotonic-loading experiment
Table 2 Room temperature tensile properties obtained during tensile experiment compared with published values[1]
points upon unloading the specimen.
The in-situ HCF experiment was performed with Rstress = 0.1 and ��max = 840 MPa. The macroscopic stress��strain data for this experiment is unavailable. Fig.2 can be used to demonstrate the features of the stress��strain curve of this alloy during HCF. Diffraction patterns were obtained at 840 MPa and 84 MPa (i.e., ��max and ��min, respectively) for several numbers of fatigue cycles: 1, 5, 14, 55, 105, 505, 1 005,
10 007, 11 008, 12 008, 13 009, 14 009, 15 009, 16 009, and 18 009.
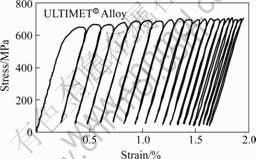
Fig.2 Macroscopic stress��strain curves obtained on ULTIMET? alloy during an experiment performed by Jiang [4]
The in-situ LCF experiment was performed with Rstrain=-1 (Rstrain=��min/��max, where ��min and ��max are the applied minimum and maximum strains, respectively) and ��max=1.25%. The macroscopic stress��strain hysteresis loops obtained during this experiment are shown in Fig.3. Diffraction patterns were obtained at several different numbers of fatigue cycles: 1, 4, 8, 12, 30, 50, 75, 100, 250 and 500[2]. For each fatigue cycle diffraction patterns were measured at six points along the stress��strain hysteresis loop, as labeled in Fig.3. These points correspond to the maximum tensile and compressive strain (i.e., points 1 and 4), the two zero-stress points (i.e., points 2 and 5), and the two zero-strain points (i.e., points 3 and 6).
The diffraction data was analyzed using least-
squares fitting of isolated diffraction peaks with the general structure analysis system(GSAS)[10]. The peak-
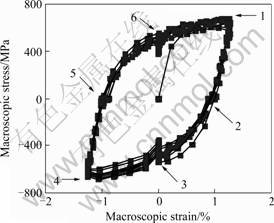
Fig.3 Stress��strain hysteresis loops obtained during in-situ neutron-diffraction LCF experiment
fitting parameters include the peak position in time of flight, the background intensity (denoted Ibkg), the peak integrated intensity (denoted I(hkl) or I(hkil)), and the peak-width parameter. The fitting routine uses a profile function in order to describe the shape of the diffraction peak [11]. The peak-width parameter that was refined in this study was the profile coefficient, ��2, which is the Gaussian contribution to the peak-shape variance [11]. All intensity data reported herein are normalized with respect to the background.
3 Results
An overlay of axial diffraction patterns obtained during the tensile experiment is presented in Fig.4. The typical fcc diffraction peaks are clearly observed in the elastic regime: (111), (200), and (311). The ![]()
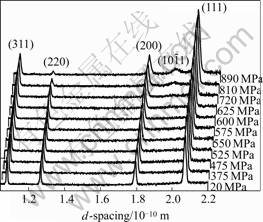
Fig.4 Overlay of axial-data diffraction patterns obtained during the in-situ neutron-diffraction tensile experiment at SMARTS
hcp diffraction peak is firstry detected at 810 MPa, which is beyond the yield stress of 525 MPa. Upon increasing the stress to 890 MPa, the intensity of the hcp peak increases. Quantitative information for the hcp diffraction-peak intensity evolution during monotonic loading was omitted here, since the statistics of this peak were insufficient for a reasonable discussion of the data.
An overlay of axial diffraction patterns obtained at the maximum tensile stress during HCF is presented in Fig.5. As before, the typical fcc diffraction peaks are evident throughout the experiment. The ![]() hcp diffraction peak is firstly detected at the first fatigue cycle. Fig.6 shows that the integrated intensity of the hcp diffraction peak increases immediately and remains constant as the number of fatigue cycles increases, with some noise presented in the data due to insufficient statistics.
hcp diffraction peak is firstly detected at the first fatigue cycle. Fig.6 shows that the integrated intensity of the hcp diffraction peak increases immediately and remains constant as the number of fatigue cycles increases, with some noise presented in the data due to insufficient statistics.
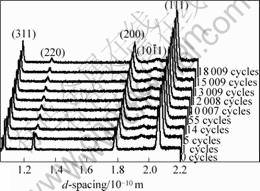
Fig.5 Overlay of axial diffraction patterns obtained during HCF
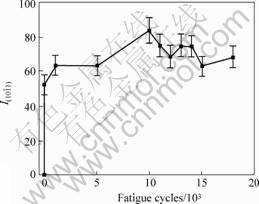
Fig.6 Intensity of hcp diffraction peak during monotonic loading
An overlay of axial diffraction patterns obtained during the LCF experiment is presented in Fig.7. The typical fcc diffraction peaks are observed. The ![]() hcp diffraction peak, however, is not evident until fatigue cycle 12. The
hcp diffraction peak, however, is not evident until fatigue cycle 12. The ![]() and
and ![]() hcp peaks are also observed at 500 cycles. Fig.8 shows that, after first appearance, the integrated intensity of the hcp diffraction peak increases linearly as the number of LCF cycles increases.
hcp peaks are also observed at 500 cycles. Fig.8 shows that, after first appearance, the integrated intensity of the hcp diffraction peak increases linearly as the number of LCF cycles increases.
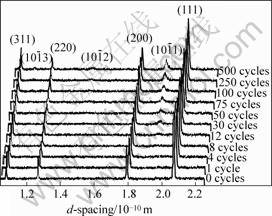
Fig.7 Overlay of axial diffraction patterns obtained at maximum tensile strain during LCF
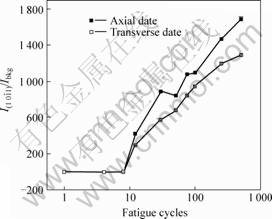
Fig.8 Intensity evolution of ![]() hcp diffraction peak during LCF
hcp diffraction peak during LCF
4.1 Energy input during monotonic and cyclic loading
The results presented here point to the input of mechanical energy into the system as a way of causing the phase transformation. Before that is considered in detail, however, some preliminary discussion regarding how mechanical energy is supplied to a system during different loading conditions is warranted. During monotonic loading, the specimen per unit volume of material, u, can be expressed as follows[12]:
![]() (1)
(1)
where �� and �� represent stress and strain, respectively. This quantity can be easily determined by finding the area under the stress��strain curve. In the case of cyclic loading, however, the amount of energy per unit volume that is absorbed by the specimen during a fatigue cycle is determined by the area of the stress��strain hysteresis loop, and is defined by the following equation:
![]() (2)
(2)
where ��? and ��2 are the minimum and maximum strains, respectively; ��u and ��l are the stresses in the upper and lower parts of the hysteresis loop, respectively.
4.2 Phase development during monotonic loading
The creation and accumulation of stacking faults in the fcc matrix is a likely mechanism of the fcc to hcp stress-induced phase transformation in cobalt alloys[13]. Therefore, the period following yielding but before the transformation takes place is likely characterized by the creation of deformation stacking faults. The hcp ![]() peak intensity (only qualitative data was presented here) increases with the increase of strain level, which indicates that the phase transformation requires mechanical energy in order to occur, since an increase of strain is paramount to the increase of area under the stress��strain curve.
peak intensity (only qualitative data was presented here) increases with the increase of strain level, which indicates that the phase transformation requires mechanical energy in order to occur, since an increase of strain is paramount to the increase of area under the stress��strain curve.
4.3 Phase development during HCF
Since the first fatigue cycle exceeds the yield stress considerably, enough mechanical energy is supplied to the system to initially form the hcp phase. Fig.2 shows that the macroscopic strain saturates during the later cycles of fatigue, which means that little work is done on the system. Since only a small amount of work was done after the first fatigue cycle, the hcp phase could not accumulate as a function of fatigue cycles, as shown by the diffraction data (Fig.5).
4.4 Phase Development during LCF
The maximum tensile stress attained during this experiment is 680 MPa, which is much lower than 840 MPa for HCF and 890 MPa for the tensile experiment. Even though the maximum stress is much lower in LCF, the hcp phase still accumulates with the increase of fatigue cycles. The area of the stress-strain hysteresis loop is roughly constant for each fatigue cycle and work is continuously done on the specimen during LCF. This continued input of mechanical energy into the system allows for the slow accumulation of the hcp phase.
5 Conclusions1) During monotonic loading, the hcp phase forms with the increase of stress (or strain) level.
2) During stress-controlled fatigue, the hcp phase forms during the first fatigue cycle with no subsequent accumulation of the second phase.
3) During strain-controlled fatigue, the hcp phase is not detected until fatigue cycle is 12, but it accumulates with the increase of fatigue cycles.
4) The deformation-induced phase transformation is considered to occur as the result of the input of mechanical energy into the system, as this hypothesis consistently explains the observations from the three experiments.
AcknowledgmentsThis work has benefited from the use of 1) Los Alamos Neutron Science Facility at Los Alamos National Laboratory and 2) ISIS Pulsed Neutron and Muon Source at Rutherford-Appleton Laboratory. The financial support of the National Science Foundation��s 1) International Materials Institutes (IMI) under DMR-0231320, 2) Integrative Graduate Education and Research Training (IGERT) under DGE-9987548, 3) Combined Research and Curriculum Development (CRCD) under EEC-9527527 and EEC-0203415, and 4) Major Research Instrumentation (MRI) under DMR-0231320 at the University of Tennessee; with Dr HUBER C, Dr Van HARTESVELDT C J, Dr DUTTA D, Dr JENNINGS W, Dr GOLDBERG L, Ms POATS M, and Dr BOULDIN C R as the Program Directors, is greatly appreciated. Additional funding for this project was gratefully received from the Tennessee Advanced Materials Laboratory, with Prof. PLUMMER E W as the Director.
References[1] www.haynesintl.com
[2] BENSON M L, SALEH T A, LIAW P K, CHOO H, BROWN D W, DAYMOND M R, WANG X L, STOICA A D, BUCHANAN R A, KLARSTROM D L. Fatigue-induced phase formation and its deformation behavior in a cobalt-based superalloy[J]. Powder Diff, 2005, 20: 121.
[3] JIANG L, BROOKS C R, LIAW P K, WANG H, RAWN C J, KLARSTROM D L. High-frequency metal fatigue: the high-cycle fatigue behavior of ULTIMET? alloy[J]. Mat Sci Eng A, 2001, 314: 162-175.
[4] JIANG L, BROOKS C R, LIAW P K, KLARSTROM D L, RAWN C J, MUENCHEN B. Phenomenological aspects of the high-cycle fatigue of ULTIMET? alloy[J]. Mat Sci Eng A, 2001, 316: 66-79.
[5] JIANG L, WANG H, LIAW P K, BROOKS C R, KLARSTROM D L. Temperature evolution during low-cycle fatigue of ULTIMET? alloy: experiment and modeling[J]. Mechanics of Materials, 2004, 36: 73-84.
[6] JIANG L, WANG H, LIAW P K, BROOKS C R, KLARSTROM D L. Characterization of the temperature evolution during high-cycle fatigue of the ULTIMET? superalloy: experiment and modeling[J]. Met Trans A, 2001, 32: 2279-2296.
[7] JIANG L, BROOKS C R, LIAW P K, DUNLAP J, RAWN C J, PEASOE R A, KLARSTROM D L. Low-cycle fatigue behavior of ULTIMET? alloy[J]. Met Trans A, 2004, 35: 785-796.
[8] BOURKE M A M, DUNAND D C, USTANDAG E. SMARTS��a spectrometer for strain measurement in engineering materials[J]. Appl Phys A, 2002, 75: S1707.
[9] JOHNSON M W, DAYMOND M R. An optimum design for a time-of-flight neutron diffractometer for measuring engineering stresses[J]. J Appl Cryst, 2002, 35: 49-57.
[10] Von DREEL R B, JORGENSEN J D, WINDSOR C G. Rietveld refinement with spallation neutron powder diffraction data[J]. J Appl Cryst, 1982, 15: 581.
[11] LARSON A C, von DREELE R B. General structure analysis system (GSAS)[R]. Los Alamos National Laboratory Report LAUR, 2004: 147-158.
[12] DOWLING N E. Mechanical behavior of materials[A]. 2nd Edition, NJ : Prentice Hall [C]. 117, 118, 1999: 757-759.
[13] TAWANCY H M, ISHWAR V R, LEWIS B E. On the fcc to hcp transformation in a cobalt-base superalloy(Haynes alloy No. 25)[J]. J Mat Sci Let, 1986, 5: 337-340.
Corresponding author: Benson M L
