
Trans. Nonferrous Met. Soc. China 23(2013) 1993-2001
Wear and corrosion resistance and electroplating characteristics of electrodeposited Cr-SiC nano-composite coatings
M. Arab JUNEGHANI, M. FARZAM, H. ZOHDIRAD
Abadan Faculty of Petroleum Engineering, Petroleum University of Technology, Abadan, Iran
Received 29 August 2012; accepted 19 May 2013
Abstract:
Cr-SiC nanocomposite coatings with various contents of SiC nanoparticles were prepared by electrodeposition in optimized Cr plating bath containing different concentrations of SiC nanoparticles. Direct current electrocodeposition technique was used to deposit chromium layers with and without SiC nanoparticles on mild carbon steel. The effects of current density, stirring rate and concentration of nanoparticles in the plating bath were investigated. Scanning electron microscopy was used to study surface morphology. Energy dispersive analysis technique was used to verify the presence of SiC nanoparticles in the coated layers. The corrosion behaviors of coatings were investigated by potentiodynamic polarization and electrochemical impedance spectroscopy methods in 0.05 mol/L HCl, 1 mol/L NaOH and 3.5% NaCl (mass fraction), respectively. Microhardness measurements and pin-on- disc tribometer technique were used to investigate the wear behavior of the coatings.
Key words:
Cr-SiC nano-composite coatings; electrocodeposition; corrosion resistance; wear behavior;
1 Introduction
Erosion and corrosion of engineering materials are important factors potent to cause failures or reduce fitness for service of engineering components. A way to prevent these problems is to use a proper coating system on the surface to protect the material against erosion and corrosion. Several techniques have been applied to producing protective coatings, such as electrodeposition, plasma thermal spray or physical vapor deposition methods [1]. Nowadays, nanoparticles are used to reinforce the composite materials used for coating systems, to gain a greater wear and corrosion properties. Electrocodeposition of inert ceramic nanoparticles such as SiC in a metal matrix is a good way to produce a hard plated layer on a metallic surface. A pore-free metallic coating with the lowest number of micro cracks can easily isolate the metals surfaces in even very highly corrosive mediums. Such coating may be utilized for a lower friction coefficient but higher micro-hardness. BENEA et al [2] investigated the behavior of Ni-SiC nanocomposite coatings and observed the improved wear properties. Electrodeposition parameters such as operating pH, temperature, plating bath composition, bath solution stirring rate, current densities, current type and nanoparticles concentration can significantly affect the quality of such coatings [3-5]. Addition of nanoparticles to deposited layers can mainly improve surface microhardness if they are distributed uniformly. The aim of this work is to uniformly deposit SiC nanoparticles with Cr metallic matrix to produce hard, crack free Cr-SiC layers using conventional direct current electrocodeposition, to improve the wear and corrosion properties because of the good corrosion and erosion properties of SiC nanoparticles.
2 Experimental
2.1 Materials
Pure Cr and Cr-SiC nanocomposite layers were deposited on mild carbon steel AISI 1020. The samples were in cylindrical shape with diameter of 16 mm. The effect of electrodeposition parameters, such as current, concentration, stirring rate, were investigated by using polarization and electrochemical impedance spectrometry, micro-hardness measurements and pin-on- disc tests. All the samples were ground by emery papers (400, 600, 800, 1000 and 1200). The substrates were ultrasonically cleaned in acetone for 10 min and continued with immersion in 10% NaOH solution for at least 30 s, dipped in 10% HCl for 5 s and finally washed with distilled water before electrodeposition. The composition of the plating bath and operating parameters for electrodeposition are shown in Table 1 and Table 2. Distilled water was used to prepare all the electroplating solutions. The SiC nanoparticles with mean diameter of 50 nm (��-SiC) with concentration of 0-25 g/L were used. All the chemicals were standard Merck chemicals.
Table 1 Electroplating bath composition
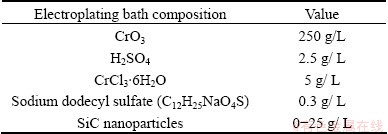
Table 2 Operating parameters for electrodeposition
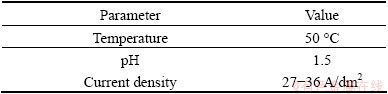
Nanoparticles were dispersed in the electroplating bath solution by ultrasonic assisted process using HYLER UIP 1000 W/L disperser. During the co-deposition process the bath was stirred by a magnetic stirrer in order to keep the particles dispersed and prevent sedimentation in the electrolyte suspension. The bath temperature was kept at 50 ��C by an automatic controller. The anode was a platinum plate with dimensions of 20 mm �� 20 mm. The surface morphology was characterized using scanning electron microscopy (SEM) accompanied with energy dispersive analysis system (EDX) using a Philips model MV2300 operated at 25 kV.
2.2 Micro-hardness measurements
The Vickers micro-hardness measurements were carried out with loads of 0.49 N and indention time of 30 s. The corresponding final values were determined as the average of 10 measurements. The micro-hardness of pure Cr coating and Cr-SiC nanocomposite coatings with different contents of SiC nanoparticles were measured and compared. All of the micro-hardness tests were done using Micrometer (USA) micro-hardness measurement set-up.
2.3 Wear test
The wear tests were performed on a pin-on-disc tribometer with a constant rotation speed of 80 r/min at a constant radius of 1 cm and normal load (Fn) of 50 N at room temperature under non-lubricated condition with the total distance of 50 m. The friction loads (Ff) versus time were measured automatically by a load cell during the test with 5 measurements per second. The load cell was connected to the computer and the measured data were automatically transferred to the wear software. Wear software was used to evaluate the experimental data. The software normalized the experimental data. Friction coefficient (��f) was calculated from Eq. (1), and finally the software exhibited the friction coefficient versus sliding distance diagram.
��f=Ff /Fn (1)
The pin was a bearing steel (AISI 52100) with a radius of 2.5 mm and a pin tip air radius of 10 mm. The hardness of pin was HRC 64. The disc was the mild carbon steel coated with a nanocomposite film. The diameter and thickness of disc were 30 mm and 5 mm, respectively.
The samples were ultrasonically cleaned in acetone before and after each test. The mass loss of each sample, to an accuracy of 0.1 mg, was measured and its final value was reported. The wear tests were performed on pure Cr coating and Cr-SiC nanocomposite coatings. The wear loss, friction coefficient and worn surface of coatings were compared.
2.4 Potentiodynamic polarization test
Potentiodynamic polarization measurements were carried out in an open-to-air conventional three-electrode cell. The cell contained 100 mL of electrolyte. Measurements were performed in 0.05 mol/L HCl, 1 mol/L NaOH and 3.5% NaCl solutions at room temperature, respectively. The coated specimens were used as the working electrode. Platinum electrode and Ag/AgCl electrode were used as counter and the reference electrodes, respectively. Polarization studies were conducted using a computer controlled Autolab PGSTAT 302N. Autolab GPES (general purpose electrochemical system) software was used for evaluating the experimental data. The open circuit potential (OCP) was measured after immersion and when OCP reached an stable condition, the polarization measurements were done. Potentiodynamic measure- ments were performed at a potential scanning rate of 0.5 mV/s. The corrosion potential (��corr) and corrosion current density (Jcorr) were calculated from the intersection of the cathodic and anodic Tafel curves using the Tafel extrapolation method. The polarization resistance (Rp) was determined using Stren�CGeary equation [6]:
 (2)
(2)
where ��a and ��c are the anodic and cathodic Tafel slopes, respectively. The corrosion rate, ��, was calculated through the following equation [7]:
 (3)
(3)
where M, n, and d are molar mass, valence number, and density of the sample, respectively.
2.5 Electrochemical impedance spectroscopy (EIS) test
The electrochemical impedance spectroscopy (EIS) measurements were performed from 100 kHz to 10 mHz using a computer controlled Autolab PGSTAT 302N at room temperature. Autolab FRA (frequency reference analyzer) software was used for evaluating the experimental data and calculation of polarization resistance (Rp). The peak-to-peak amplitude of the sinusoidal voltage signal was 10 mV. All EIS were recorded at the open circuit potential, i.e. at the corrosion potential (��corr). Measurements were performed after 25 min immersion in the electrolyte to reach steady state condition. To avoid noise effects on results, the experiment apparatus was placed in a faraday cage and any noise was kept away from the apparatus.
3 Results and discussion
SEM images of the pure Cr and Cr-SiC nanocomposite coating are shown in Fig. 1(a) and indicate that the pure Cr coating demonstrated a regular surface. The Cr-SiC nano-composite coatings show an smoother, more uniform and compact surface than the pure Cr coating, which indicates that the co-deposited SiC nanoparticles were uniformly distributed in the Cr matrix of nanocomposite coating.
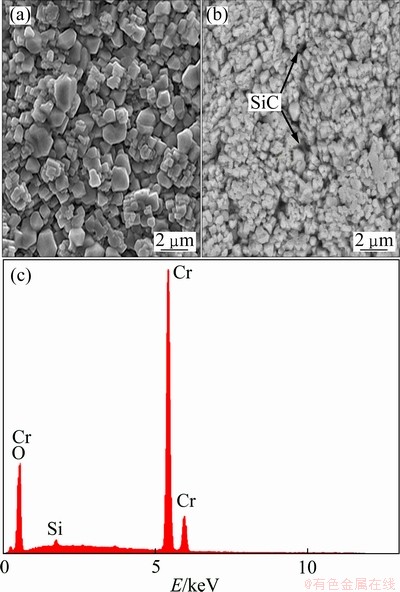
Fig. 1 SEM images of pure Cr coating (a), Cr-1.13% SiC nanocomposite coating (b) and EDX spectrum of Cr-1.13% SiC coating (c)
3.1 Electrodeposition factors affecting composition of coating
3.1.1 Nano-particles concentration in electroplating bath
SiC nanoparticles become positively charged by adsorption of chromium ions and can be codeposited within chromium (during electroplating). Hence, the number of adsorbed Cr3+ ions on the surface of SiC nanoparticles increases with increase in the SiC concentration. Electric field causes SiC nanoparticles to move towards the cathode surface where the adsorbed Cr3+ ions discharge and deposit on the cathode surface encapsulating and incorporating the SiC nanoparticles. In other words, a higher concentration of SiC nanoparticles in the electrolyte enhances the adsorption rate, resulting in higher mass fraction of the co-deposited SiC nanoparticles. The decrease of SiC mass fraction in the coating may be attributed to agglomeration of SiC nanoparticles in the electrolyte owing to their poor wettability [8]. Figure 2 shows the relationship between SiC content in the coating and its content in electrodeposition bath.

Fig. 2 Mass fraction of SiC in coating vs SiC content in plating bath
3.1.2 Current density
Figure 3 shows the relationship between the current density and the content of co-deposited SiC nanoparticles. The mass fraction of SiC nanoparticles in the coating was enhanced by increasing current density up to 32 A/dm2. Beyond this current density, the SiC nanoparticles content in the coating decreased. The increase of SiC at current density less than 32 A/dm2 is due to the increase in adsorbed nanoparticles tendency to arrive at the (cathode) surface. The process is controlled by the adsorption of nanoparticles to the cathode surface and the nanoparticles deposition is dominant. At current densities higher than 32 A/dm2, the rate of metal ions moving to the cathode surface is faster compared with the adsorbed nanoparticles. On the other hand, more rapid reduction of metal ions (to metal matrix atoms on the cathode surface) leads to a fewer nanoparticles (embedded) in the coating. This is the reasons why SiC nanoparticles content in coating decreases at current density higher than 32 A/dm2.
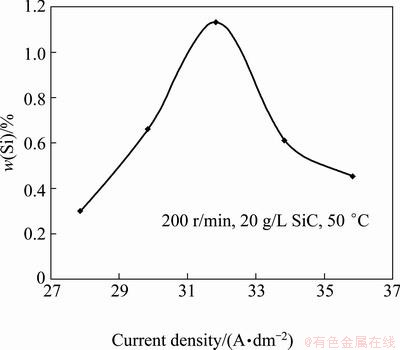
Fig. 3 Mass fraction of SiC in coating vs current density
3.1.3 Stirring rate
The relationship between the stirring rate and the content of co-deposited SiC nanoparticles in coating is shown in Fig. 4. The stirring rate strongly influences the mass fraction of SiC nanoparticles transported to the cathode surface. SiC nanoparticles content in the coating increased with the stirring rate and reached a maximum value at 200 r/min, then decreased with increasing stirring rate. At stirring rates lower than 200 r/min, the fluid flow is not capable of transporting all the nanoparticles to the cathode surface and thus co-deposition behavior of SiC nanoparticles is apparently controlled by nanoparticles transfer. When the stirring rate is too high, the decreasing trend of the mass fraction of SiC nanoparticles is principally caused by the collision factor. The increasing streaming velocity of the suspension may also sweep away the loosely adsorbed SiC nanoparticles (on the cathode surface), and makes the rate of particle removal faster than particle attachment, resulting in a decreased mass fraction of the codeposited SiC nanoparticles in the composite coating.
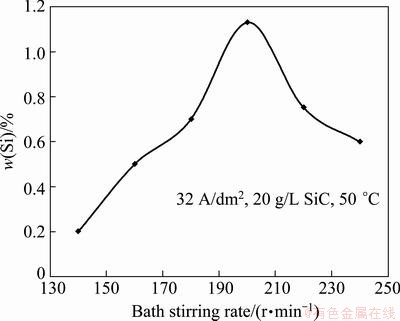
Fig. 4 Mass fraction of SiC in coating vs plating bath stirring rate
3.2 Potentiodynamic polarization
The potentiodynamic polarization curves of pure Cr and Cr-SiC nanocomposite coatings, with different contents of SiC nanoparticles, in 3.5 % NaCl, 0.05 mol/L HCl and 1 mol/L NaOH solutions, respectively are shown in Figs. 5-7. Corrosion characteristics such as corrosion potential (��corr), corrosion current density (Jcorr) and anodic/cathodic Tafel slopes (��a and ��c) were obtained from the intersection of cathodic and anodic Tafel curves using the Tafel extrapolation method. Also, the corrosion rate and polarization resistance (Rp) calculated from these data are presented in Tables 3-5. It could be seen that by increasing SiC nanoparticles content in the plating bath, the corrosion potential of the coatings shifted to a more positive value, and also polarization resistance (Rp) increased (reduction of corrosion rate). The coatings with higher number of SiC nanoparticles have better corrosion resistance compared with the lower amount ones.
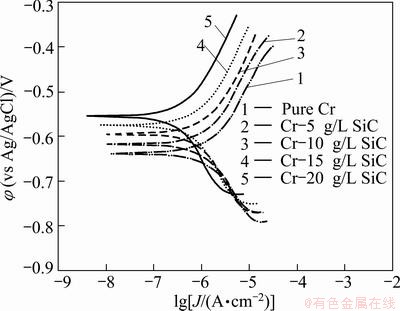
Fig. 5 Potentiodynamic polarization measurements for pure Cr coating and Cr-SiC nano-composite coatings in 3.5%NaCl solution
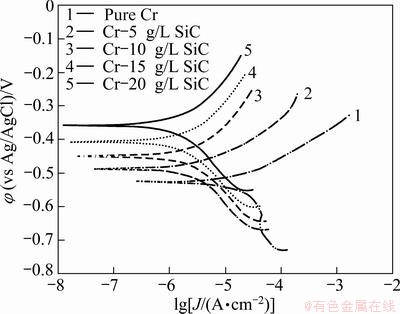
Fig. 6 Potentiodynamic polarization measurements for pure Cr coating and Cr-SiC nano-composite coatings in 0.05 mol/L HCl solution
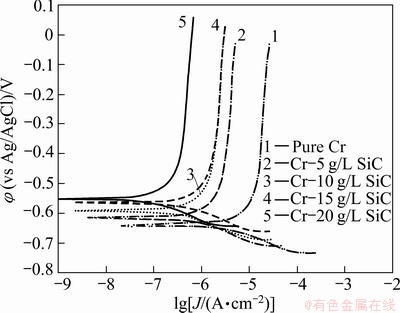
Fig. 7 Potentiodynamic polarization measurements for pure Cr coating and Cr-SiC nano-composite coatings in 1 mol/L NaOH solution
Table 3 Corrosion characteristics obtained from potentio- dynamic polarization measurement for pure Cr coating and Cr-SiC nano-composite coatings in 3.5% NaCl solution
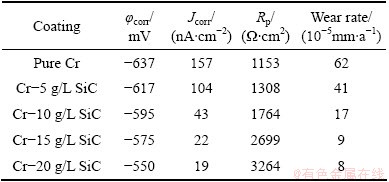
Table 4 Corrosion characteristics obtained from potentio- dynamic polarization measurement for pure Cr coating and Cr-SiC nano-composite coatings in 1 mol/L NaOH solution
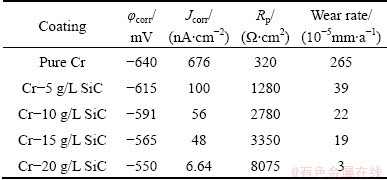
Table 5 Corrosion characteristics obtained from potentio- dynamic polarization measurement for pure Cr coating and Cr-SiC nano-composite coatings in 0.05 mol/L HCl solution
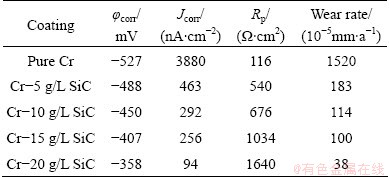
The data clearly reveal the improvement of corrosion protection by SiC nanoparticles. Polarization resistance (Rp) increased with increasing SiC nanoparticles content. It can be concluded that the co-deposited SiC nanoparticles in Cr matrix increase the corrosion resistance in salty, acidic and alkaline solutions. Obviously, the SiC nanoparticles play a major role in improving the corrosion protection by two mechanisms. Firstly, these SiC nanoparticles act as inert physical barriers to the initiation and development of defects, modifying the microstructure of the chromium layer and hence improving the corrosion resistance of the coating. Secondly, the dispersion of SiC nanoparticles in the chromium layer results in the formation of many corrosion micro cells in which the SiC nanoparticles act as cathode and chromium as anode (standard potential of SiC is more positive than that of chromium). Such corrosion micro cells facilitate the anodic polarization. Therefore, in the presence of SiC, localized corrosion is inhibited, and mainly homogeneous uniform corrosion occurs [9-11].
3.3 Electrochemical impedance spectroscopy (EIS)
3.3.1 EIS tests in 3.5 % NaCl solution
The Nyquist diagrams in 3.5% NaCl solution are shown in Fig. 8. The impedance spectra for Nyquist and Bode diagrams were analyzed by fitting the experimental data to the equivalent circuit model (Fig. 9). A good fit with this model was obtained using F.R.A. software with an average error of about 3.5% (Rs represents the solution resistance). The capacitive loop, Rct and CPE (constant phase element) can be attributed to the charge transfer reaction. CPE is introduced to the circuit instead of a pure double layer capacitor to give a more accurate fitting [12]. Rct represents the charge transfer resistance whose value is a measure of electron transfer across the surface and is inversely proportional to the corrosion rate [13]. Charge transfer resistances in NaCl solution are listed in Table 3. Rct increases with the increasing of SiC nanoparticles content in the coating.
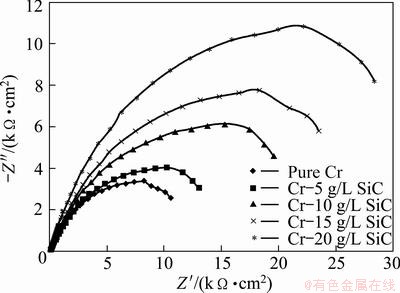
Fig. 8 Nyquist plot for pure Cr coating and Cr-SiC nano-composite coatings in 3.5% NaCl solution

Fig. 9 Equivalent circuits used for numerical fitting of impedance plots for NaCl solution
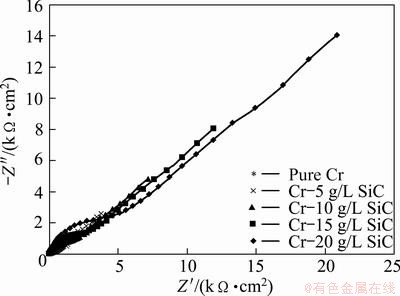
Fig. 10 Nyquist plot for pure Cr coating and Cr-SiC nano-composite coatings in 1 mol/L NaOH solution
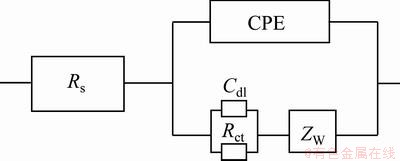
Fig. 11 Equivalent circuits used for numerical fitting of impedance plots for NaOH solution
3.3.2 EIS tests in 1 mol/L NaOH solution
Figure 10 represents the Nyquist plots in 1 mol/L NaOH solution. The Nyquist plots exhibit a capacitive loop at the higher frequencies followed by a diffusion-controlled charge transfer at the lower frequencies [14]. The diagrams indicate that the corrosion mechanism was controlled not only by a charge transfer but also by diffusion process. The equivalent circuit model for electrochemical behavior is shown in Fig. 11. The experimental data have a good fitting with this model with an average error of about 2.3%. Cdl and Zw represent a double layer capacitor and Warburg impedance. The corrosion rate is affected by the inter-diffusion of Cr3+ and OH- ions, and there should exist a Warburg diffusion element reasonably describing the diffusion effect of ions [15,16]. The charge transfer resistances in NaOH solution are listed in Table 4. Rct increases with increasing the SiC nanoparticles content in coating.
3.3.3 EIS tests in 0.05 mol/L HCl solution
The Nyquist diagrams in 0.05 mol/L HCl solution are shown in Fig. 12. The impedance spectra for Nyquist and Bode diagrams were analyzed by fitting the experimental data to equivalent circuit model (Fig. 13). A good fit with this model was obtained with an average error of about 4.5%. Rs represents the solution resistance. The capacitive loop, Rct and CPE, can be attributed to the charge transfer reaction. The constant phase element, CPE, is introduced in the circuit instead of a pure double layer capacitor to give a more accurate fit [12]. Rct represents the charge transfer resistance whose value is a measure of electron transfer across the surface and is inversely proportional to corrosion rate [13]. Charge transfer resistances in HCl solution are listed in Table 5. Rct increases with increasing the SiC nanoparticles content in coating.
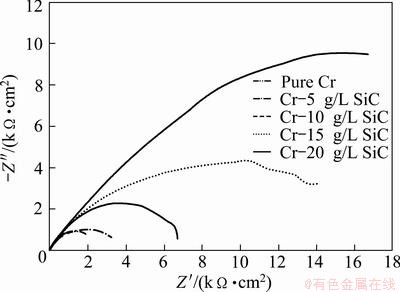
Fig. 12 Nyquist plot for pure Cr coating and Cr-SiC nano-composite coatings in 0.05 mol/L HCl solution
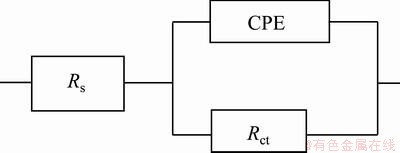
Fig. 13 Equivalent circuits used for numerical fitting of impedance plots for HCl solution
It could be seen in Table 5 that by increasing the number of SiC nanoparticles in the bath, the charge transfer resistance of the coatings was increased in the environment. According to the overall investigation of potentiodynamic and impedance data, these coatings have a reasonable performance in corrosive environments.
3.4 Hardness measurements
By increasing SiC nano-particles in the coating, the micro-hardness increased from HV 1050 for pure Cr coating to HV 1225 for Cr-20 g/L SiC (Fig. 14). The mechanisms of such strengthening are the grain refinement strengthening and the dispersion strengthening [10,11,17, 18]
The addition of SiC nanoparticles would increase their deposition and increases the number of nucleation sites in the matrix. This leads to the formation of finer grains. The grain refinement strengthening by Hall- Petch relationship is as follows:
��y = ��i+kD-1/2 (4)
HV = 3��y (5)
where ��y is the yield stress; ��i is the friction stress; k is a constant; D is the grain size in diameter. The mechanism proposed for the dispersion strengthening is illustrated in Fig. 15 according to Orowan��s mechanism [19]. The yield stress is determined by the shear stress required to bow a dislocation line between two nanoparticles, a distance �� apart. In Fig. 15, stage 1 shows a straight dislocation line approaching two nanoparticles; at stage 2 the line is beginning to bend; at stage 3 it will have reached the critical curvature. The dislocation can then move forward, no further decreasing its radius of curvature. Since the segments of dislocation that meets on the other side of the particle are of opposite sign, they can annihilate each other, leaving a dislocation loop around each particle at stage 4. The original dislocation is then free to move further at stage 5. The shear stress required to force dislocation between the obstacles is
��0=Gb/�� (6)
and the yield stress is
��y =2Gb/�� (7)
where G refers to the shear modulus of the matrix and b is the Burger��s vector of the dislocation. For pure chromium, these values are taken to be 115 GPa and 0.2884 nm, respectively [20].
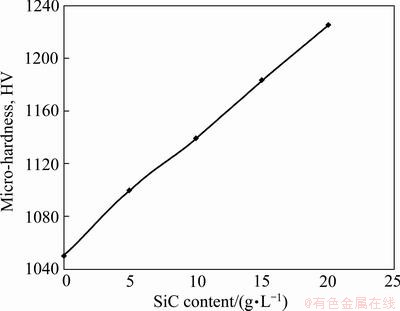
Fig. 14 Microhardness vs SiC content in plating bath
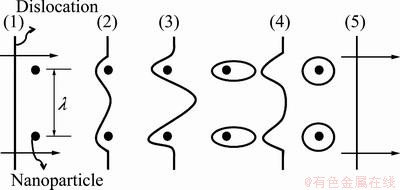
Fig. 15 Schematic drawing of stages in passage of a dislocation between widely separated nano-particles, based on Orowan��s mechanism of dispersion hardening [19]
These strengthening mechanisms become stronger with increasing SiC nanoparticle content in composite coatings. Thus the micro-hardness of the coating increases with the increase of SiC nanoparticles content.
3.5 Wear behavior of coatings
3.5.1 Friction coefficient
Figure 16 shows the friction coefficient of pure Cr coating and Cr-SiC nanocomposite coatings containing 0.85% and 1.13% SiC (under the identical test conditions). The friction coefficients of all coatings wove approximately the same in the first 10 m. The of friction coefficient of pure Cr coating increased to 0.5 and remained at this value. However, the friction coefficients of Cr-SiC nanocomposite coatings exhibited little change and kept stable during the test. The hard nano-scaled reinforcements embedded in nanocomposite coatings reduce direct contact between the metal matrix and the abrasive surface. On the other hand, during the friction process, the co-deposited SiC nanoparticles gradually protruded out of the matrix, which carry the load transfer from the matrix, and as a result, the thermal plastic deformation and scuffing wear at high temperature caused by the heat generated in the sliding are reduced. The nanoparticles which are separated from matrix due to abrasion act as solid lubricants. This is the reasons why the friction coefficients of nanocomposite coatings are much more stable and much less as compared with pure Cr coating.
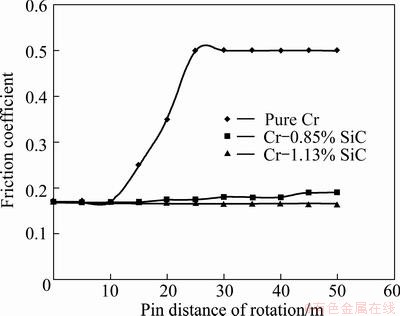
Fig. 16 Friction coefficient of pure Cr and Cr-SiC coatings
3.5.2 Wear performance
Figure 17 shows the wear loss of pure Cr coating and Cr-SiC nanocomposite coatings with different SiC contents. It is obvious that the wear resistance of the nanocomposite coatings is more than that of pure Cr coating. The wear resistance of nano-composite coatings is increased by increasing the SiC nanoparticles content. This can be attributed to the strengthening effect and the decrease in friction coefficient. The hardness and friction coefficient are the two parameters which affect the wear resistance [21]. The wear resistance increases with increasing hardness and decreasing friction coefficient.
The tendency of Cr-SiC nanocomposite coatings for plastic deformation is less than pure Cr coating. The results suggest that the wear resistance was improved by the addition of SiC nanoparticles. The embedded SiC nanoparticles can significantly improve the tribological performance of Cr-SiC nanocomposite coatings.
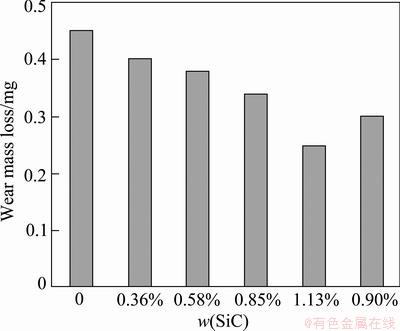
Fig. 17 Wear mass loss vs mass fraction of SiC in coatings
4 Conclusions
The content of SiC nanoparticles in coating is influenced by current density, stirring rate and SiC nanoparticles concentration in the plating bath. The maximum SiC content embedded in the coating was obtained at the SiC nanoparticles concentration in the plating bath of 20 g/L, current density of 32 A/dm2 and stirring rate of 200 r/min. The maximum SiC content in the coating is around 1.13%. When the concentration of SiC in the bath is more than 20 g/L, the agglomeration of nanoparticles increases. The surface morphology of Cr-SiC nanocomposite coating is smoother, more uniform and compact than that of pure Cr coating. The co-deposited SiC nanoparticles are uniformly distributed into the Cr matrix which improves the corrosion and wear performance of coating. By increasing SiC content in the coating, the micro-hardness increases, the corrosion current density decreases and the corrosion potential shifts to the more positive potentials. The EIS spectra demonstrate that the corrosion rate is controlled by charge transfer resistance: Rct increases with the increase of SiC content. The Cr-SiC nanocomposite coatings show lower friction coefficient and better wear resistance compared with pure Cr coating. The worn surface morphology shows that the Cr-SiC nanocomposite coatings exhibit less abrasive width and depth and less tendency for plastic deformation.
References
[1] GUILEMANY J M, ESPLLARGAAS N, SUEGAMA P H, BENDETTI A. Comparative study of Cr3C2�CNiCr coatings obtained by HVOF and hard chromium coatings [J]. Corrosion Science, 2006, 48: 2998-3013.
[2] BENEA L, WENGER F , PONTHIAUX P, CEILIS J P. Tribocorrosion behaviour of Ni-SiC nano-structured composite coatings obtained by electro-deposition [J]. Wear, 2009, 266: 398-405.
[3] YAO Y, YAO S, ZHANG L, WANG H. Electro-deposition and mechanical and corrosion resistance properties of Ni-W/SiC nanocomposite coatings [J]. Materials Letters, 2007, 61: 67-70.
[4] BENEA L, BONORA P L, BORELLO A, MARTELLI S. Wear corrosion properties of nanostructured SiC�Cnickel composite coatings obtained by electroplating [J]. Wear, 2001, 249: 995-1003.
[5] RAMESH C S, SESHADRI S K. Tribological characteristics of nickel based composite coatings [J]. Wear, 2003, 255: 893-902.
[6] CIUBOTARIU A, BENEA L, VARSANYI M, DRAGAN V. Biofilm formation and corrosion resistance of Ni/SiC nanocomposite layers [J]. Electrochimica Acta, 2008, 53: 4553-4557.
[7] AHMAD Z. Principles of corrosion engineering and corrosion control [M]. 1st ed. London: Elsevier, 2006.
[8] SHI L, SUN C, GAO P, ZHOU F, LIU W. Mechanical properties and wear and corrosion resistance of electrodeposited Ni-Co/SiC nano-composite coating [J]. Applied Surface Science, 2006, 252: 3591-3599.
[9] ABDEL AAL A. Hard and corrosion resistant nanocomposite coating for Al alloy [J]. Material Science and Engineering A, 2008, 474: 181-187.
[10] CHEN X H, CHEN C S, XIAO H N, CHENG F Q, ZHANG G, YI G J. Corrosion behavior of carbon nanotubes�CNi composite coating [J]. Surface and Coatings Technology, 2005, 191: 351-356.
[11] MACDONALD J R, JOHANSON W B. Theory in impedance spectroscopy [J]. New York: John Wiley & Sons, 1987.
[12] ABDEL-GABAR A M, ABDELNABBY B A, SIDAHMED I M, EL-ZAYADY A M, SAADAWY M. Inhibitive action of some plant extracts on the corrosion of steel in acidic media [J]. Corrosion Science, 2006, 48: 2765-2779.
[13] PEREZ N. Electrochemistry and corrosion science [M]. Boston: Kluwer Academic Publishers, 2004.
[14] WANG L, ZHANG J, GAO Y, XUE Q, HU L, XU T. Grain size effect in corrosion behavior of electrodeposited nanocrystalline Ni coatings in alkaline solution [J]. Scripta Materialia, 2006, 55: 657-660.
[15] BAI A, CHUAN P Y, HU C C. The corrosion behavior of Ni-P deposits with high phosphorous contents in brine media [J]. Materials Chemistry and Physics, 2003, 82: 93-100.
[16] HOU F, WANG W, GUO H. Effect of the dispersibility of ZrO2 nanoparticles in Ni�CZrO2 electroplated nanocomposite coatings on the mechanical properties of nano-composite coatings [J]. Applied Surface Science, 2006, 252: 3812-3817.
[17] WANG S L, MURR L E. Effect of prestrain and stacking-fault energy on the application of the Hall-Petch relation in fcc metals and alloys [J]. Metallography, 1980, 13: 203-224.
[18] BAGHERY P, FARZAM M, MOUSAUI A B, HOSSEINI M. Ni�CTiO2 nano-composite coating with high resistance to corrosion and wear [J]. Surface and Coatings Technology, 2010, 204: 3804-3810.
[19] DIETER G E. Mechanical metallurgy [M]. 3rd ed. London: McGrow-Hill, 1988.
[20] ABDEL AAL A, IBRAHIM K M, ABDEL HAMID Z. Enhancement of wear resistance of ductile cast iron by Ni�CSiC composite coating [J]. Wear, 2006, 260: 1070-1075.
�����Cr-SiC������Ϳ���ĥ�𡢸�ʴ�͵������
M. Arab JUNEGHANI, M. FARZAM, H. ZOHDIRAD
Abadan Faculty of Petroleum Engineering, Petroleum University of Technology, Abadan, Iran
ժ Ҫ���ں�SiC�������ĸ����Һ�У�ͨ���ı���Һ��SiC�������ĺ�����������õ���ͬSiC������������Cr-SiC�����ϲ���Ϳ�㡣����ֱ�������������ڵ�̼�ֻ����ϳ����õ���CrͿ���Cr-SiC������Ϳ�㡣�о��˵����ܶȡ������ٶȺ�SiC������Ũ�ȶԵ������Ӱ�졣��ɨ��羵���о�Ϳ��ı�����ò�������������Cr-SiC������Ϳ����SiC���������ö���λ�����͵绯ѧ�迹�����о�Ϳ����0.05 mol/L HCl��1 mol/L NaOH��3.5% NaCl�еĸ�ʴ��Ϊ������Ӳ�ȼƲ���Ϳ���Ӳ�ȺͲ�����-��ĥ���Լ��о�Ϳ���ĥ����Ϊ��
�ؼ��ʣ�Cr-SiC������Ϳ�㣻���������ʴ�ԣ�ĥ����Ϊ
(Edited by Hua YANG)
Corresponding author: M. Arab JUNEGHANI; Tel: +98-9138818597; E-mail: arabjuneghani.mohammad@gmail.com
DOI: 10.1016/S1003-6326(13)62688-6
Abstract: Cr-SiC nanocomposite coatings with various contents of SiC nanoparticles were prepared by electrodeposition in optimized Cr plating bath containing different concentrations of SiC nanoparticles. Direct current electrocodeposition technique was used to deposit chromium layers with and without SiC nanoparticles on mild carbon steel. The effects of current density, stirring rate and concentration of nanoparticles in the plating bath were investigated. Scanning electron microscopy was used to study surface morphology. Energy dispersive analysis technique was used to verify the presence of SiC nanoparticles in the coated layers. The corrosion behaviors of coatings were investigated by potentiodynamic polarization and electrochemical impedance spectroscopy methods in 0.05 mol/L HCl, 1 mol/L NaOH and 3.5% NaCl (mass fraction), respectively. Microhardness measurements and pin-on- disc tribometer technique were used to investigate the wear behavior of the coatings.
