
Trans. Nonferrous Met. Soc. China 30(2020) 3226-3239
Combined powder metallurgy routes to improve thermal and mechanical response of Al-Sn composite phase change materials
Chiara CONFALONIERI, Maxime PERRIN, Elisabetta GARIBOLDI
Department of Mechanical Engineering, Politecnico di Milano, Via La Masa 1, 20156 Milan, Italy
Received 18 February 2020; accepted 18 October 2020
Abstract:
Powder metallurgy processes are suitable to produce form-stable solid-liquid phase change materials from miscibility gap alloys. They allow to obtain a composite metallic material with good dispersion of low-melting active phase particles in a high-melting passive matrix, preventing leakage of the particles during phase transition and, therefore, increasing the stability of thermal response. Also, the matrix provides structural properties. The aim of this work is to combine conventional powder mixing techniques (simple mixing and ball milling) to improve active phase isolation and mechanical properties of an Al-Sn alloy. As matter of fact, ball milling of Sn powder allows to reduce hardness difference with Al powder; moreover, ball milling of the two powders together results in fine microstructure with improved mechanical properties. In addition, different routes applied showed that thermal response depends on the microstructure and, in particular, on the particle size of the active phase. In more detail, coarse active phase particles provide a fast heat release with small undercooling, while small particles solidify more slowly in a wide range of temperature. On the other hand, melting and, consequently, heat storage are independent of the particle size of the active phase. This potentially allows to ��tailor�� the thermal response by producing alloys with suitable microstructure.
Key words:
metallic phase change materials; powder metallurgy; thermal stability; mechanical properties; miscibility gap alloys;
1 Introduction
Using latent heat phase change materials (PCMs), thermal energy can be stored and released in the form of latent heat associated to a reversible phase transition. This potential can be exploited in many different cases of thermal management and research on these materials increased exponentially in the last decades. Usually, the solid-solid and solid-liquid transitions are exploited, thanks to their limited volume expansion with respect to transitions involving gas state [1,2]. Among these two, solid-liquid transitions have higher latent heat; however, leakage of molten phase from its container must be prevented [1,2]. In this framework, metallic PCMs are still the less developed class, despite of their high potential for medium-and high-temperature applications (>120 ��C) [3,4]. In addition to higher transition and application temperatures, they have also large latent heat per unit volume, high thermal conductivity, good thermal stability and reliability [3,4]. According to ZHOU and WU [4], a common approach to obtain metallic solid-liquid PCMs is encapsulating the PCM in a passive higher-melting material through mechanical processes or electroplating. However, oxidation and degradation at high temperatures can reduce material durability and thermal energy performance; moreover, this process can be complex and expensive [5], as well as thermal conductivity can be too low [1]. A viable alternative is designing a form-stable material, consisting of an active phase (i.e. the actual PCM) embedded in a higher-melting passive matrix. The latter has a double purpose: avoiding leakage of molten active phase and keeping structural properties. To keep microstructural and compositional stability, the two phases must not interact forming intermetallics and solid solutions, since these phenomena reduce the available quantity of active phase. According to SUGO et al [6], this kind of microstructure can be obtained using miscibility gap alloys (MGAs), i.e. alloys whose phases are immiscible both in liquid and solid state. So, since the solubility of the high-melting matrix in the active phase is low also when the latter is liquid, it is possible to keep a stable composition over time and thermal cycles. Examples of such alloys to be used as PCMs are Al-Sn, Fe-Cu, Fe-Mg and Al-Bi [6]. Among them, previous studies of Authors�� research group were focused on an Al-Sn alloy [7-10]. The Al-Sn system is a simple eutectic system, but, due to the low solid solubility of the two elements and the eutectic composition close to pure Sn (97.6 at.%), it can be considered as a metastable MGA [11,12]. The transition temperature of this PCM is assumed almost equal to the melting temperature of pure Sn, since the eutectic reaction temperature (228 ��C) is close to the melting temperature of pure Sn (232 ��C). So, according to the PCM classification of ZHOU and WU [4], it belongs to the class of medium-temperature PCMs. The authors chose this system because a PCM based on this simple binary alloy has a transition temperature slightly higher than the maximum temperatures achievable with polymeric PCMs. Further, in addition to its functional properties, this system had been widely applied in bearing alloys [12-15]. So, the development of a production process could be based on traditional industrial processes.
A common issue of MGAs is that solidification of cast MGAs results in the high-melting phase surrounded by the lower-melting one [12,13]. Considering Al-Sn systems, this is caused by the significant differences between the two metals in melting temperature, as well as in density [12]. Among the possible solutions, powder metallurgy is a relatively simple and effective technique to obtain the desired structure. This approach has been widely applied to Al-Sn based bearing alloys, in order to obtain a homogenous distribution of Sn particles throughout the component volume [13,14]; as already highlighted, this microstructure is the one desired for PCMs too.
Powder metallurgy process consists of three steps: powder mixing, compression and sintering. Previous studies of authors�� research group [7,8] showed that powder preparation has a strong influence over final properties of an Al-Sn based PCM, which will be considered in this work too. Testing different compression and heat treatment conditions, GARIBOLDI and PERRIN [7] focused on simple mixing (SM) of powders, while CONFALONIERI et al [9,10] applied ball milling (BM). The goal of the latter approach was combining powder mixing to powder size reduction and increase of powder hardness. Preliminary comparison between the two methods [8] showed that, as expected, BM gave a finer microstructure than SM; consequently, also thermal and mechanical response changed. In more detail, both techniques result in quick energy storage, but ball-milled samples showed heat release in a wider range of temperature with respect to simple-mixed ones. Then, simple-mixed samples have higher values of stored energy, while ball-milled samples exhibit higher thermal stability, thanks to the absence of interconnections among Sn particles.
The comparison highlighted that the two processes are complementary and, therefore, the conclusion is that an optimized powder preparation based on a combination of ball milling and simple mixing could lead both to (1) suitable micro-structure for metallic composite PCMs (i.e. fine and composed of two phases: Sn particles embedded in Al matrix), and (2) suitable thermal properties (i.e. high thermal stability and short transition temperature range).
The present work is focused on the identification of the powder-based production process that could supply the combination of microstructural features and thermal response mentioned above. To determine the best parameters, three new powder mixing methods were developed and applied. The powder blends were then compressed and, in some cases, sintered above Sn melting temperature applying the same process for each sample.
Microstructural, thermal and mechanical characterization was conducted on as-produced samples. The same tests were repeated after thermal cycles simulating service conditions in order to verify thermal stability; in other words, the thermal response does not change during service. Using Al-Sn PCMs, this is strictly connected to the absence of Sn leakage, which reduces the amount of active phase undergoing the transition.
2 Experimental
2.1 Powder supply
Samples were produced by mixing 20 vol.% of Sn powders with Al powders, which corresponds to about 40 wt.% of Sn. The Al powder was an atomized high purity Al (>99.7 wt.%) powder with diameters <45 ��m (ECKA Granules GmbH, Germany). The Sn powder (SN, Metalpolveri S.r.l) had a high purity (>99.9 wt.%), with a very fine particle-size distribution (over sieve grain size: <25 ��m 64%-71%, 25-45 ��m 20%-26%, 45-75 ��m 5%-11%, >75 ��m <0.3%) and good homogeneity.
2.2 Powder preparation methods
The innovative methods of producing Al-Sn composite PCMs have been designed according to three following basic concepts and observations arising from previously obtained results [7,9,10]:
(1) Since Al is harder than Sn, Sn particles are significantly deformed when mixed with Al; this results in the formation of Sn aggregates with elongated shapes, instead of the desired round particles.
(2) As already mentioned, ball milling leads to powder-size reduction and hardness increase, with an extent depending on process parameters [16].
(3) Simple mixing only blends the powders, without affecting powder size or mechanical properties.
Scheme in Fig. 1 summarizes the steps of new powder preparation methods, which will be here- after referred as Method 1, 2 and 3. In all cases, the first step is ball milling of Sn powders, with the aim of reducing Sn powder size and increasing particle hardness to reduce the gap with Al. Following this common stage, Method 1 (M1) consists of simple mixing of ball-milled Sn powders: the expected microstructure should contain globular Sn particles. On the other hand, the second step of Method 2 (M2) and Method 3 (M3) involves ball milling of Sn with a part of Al powders, aiming at forming an Al or Al-Sn shell around a Sn particle core. Then, in Method 2, this ball-milled Al-Sn blend is mixed with the rest of unprocessed Al powder; since the latter should be softer than ball-milled blend, its flow among ball-milled particles during compression was expected, leading to very low porosity after compaction and avoiding inter- connection among ball-milled particles. Finally, the most complex designed process was Method 3, in which also the mixture of the last fraction of Al powder was carried out through ball milling. The aim of this process was to form powder particles characterized by a very fine microstructure with graded microstructure with Sn-rich core, which could lead, after compression stage, to a fine dense structure with good isolation of Sn particles. Method 1 and Method 3 are supposed to result in completely different microstructures, while Method 2 should give an intermediate condition.
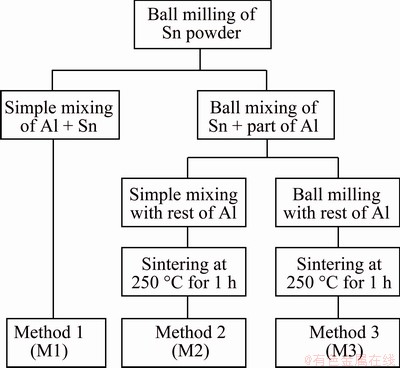
Fig. 1 New powder preparation methods
Ball milling steps were performed in a planetary mill (Retsch PM 400 planetary ball mill), using hardened steel balls with a diameter of 20 mm (material to ball mass ratio of 1:5, and about 80% of empty space in the jar) in stainless steel jars. Ethanol was used as lubricant (7% on the total mass of powders), to avoid cold fusion phenomena [14]. To achieve protection from oxidation, the jars were filled with Ar before each process step. Powders were ground at 250 r/min, alternating grinding cycles of 20 min to pause cycles of 10 min to avoid excessive increases in temperature due to friction and to further minimize oxidation phenomena. For Step 1, ball milling lasted 6 h; while the other steps lasted 2 h each. This process was developed in previous studies about ball-milled PCMs [9,10]; the only difference is the reduction of single ball- milling time (from 24 h to 6/2 h) to avoid too fine microstructures.
From now on, the specimens will be called with the label of their powder preparation method (M1, M2 and M3), since further processing is almost the same for all of them.
2.3 Compaction and sintering
Bulk specimens were obtained through cold compression. In facts, according to GARIBOLDI and PERRIN [7], cold compression of Al-Sn powders gives better properties with respect to hot compression, especially in terms of thermal stability. Compression consisted of two steps: force up to 20 kN at 3 mm/min and then force up to 53 kN at 1 mm/min. Finally, cylindrical sample were obtained with diameter of 15 mm and height of around 20 mm (20.21, 17.76 and 21.47 mm for M1, M2 and M3, respectively). After compaction, M2 and M3 samples were sintered at 250 ��C for 1 h, to improve the mechanical resistance.
2.4 Characterization
X-ray diffraction (XRD) analysis was performed at room temperature to verify which crystalline phases were present in each as-produced bulk sample. A Rigaku Smartlab SE X-ray diffractometer was used, operating at 40 kV and 30 mA with Cu K�� source and Bragg-Brentano geometry (��-�� measurement). Crystalline phases were identified by comparing the obtained patterns with references from the Crystallography Open Database [17,18] using Maud software [19].
The microstructural characterization was conducted through scanning electron microscopy (SEM), using a W-SEM (Zeiss Evo 50) detecting back-scattered electrons (BSE). Thanks to the significant Z-contrast between Al and Sn, BSE- SEM micrographs show clearly Al and Sn phases without any etching. Quantitative analysis was conducted using ImageJ software [20], assuming that the volume fraction of a phase is equal to its area fraction, as suggested by UNDERWOOD [21]. In this way, porosity was measured for all samples. On the other hand, Sn particles were analysed only for M1 and M3, since it was not possible to do the same for M2 sample due to its peculiar microstructure. An area of about 10 mm2 (two micrographs corresponding to 5 mm2) was considered for M1 and M2 samples, while an area of about 0.6 mm2 (three micrographs corresponding to 0.2 mm2) was considered for M3 sample; areas of different sizes were necessary to have enough resolution of pores and particles (Sn in M1, and ball milled Sn-rich particles in M3) to be analyzed as well as to have enough particles representing the microstructure. Particle features taken into account are total particle area (in ��m2 and its percentage of the total analyzed area) and the best ellipse fitting the particle, represented by major axis, minor axis and angle with respect to horizontal direction; generally, in the following, the ��particle dimension�� will correspond to the major axis. Moreover, the two shape descriptors are considered: circularity and aspect ratio. Circularity indicates if the particle contour is round and smooth (value tends to be 1) or it has irregularities and/or elongated shape (value tends to be 0) [22,23]. Aspect ratio is the ratio between the major and minor axis of the fit ellipse [22].
Further, grain orientation in as-produced conditions was analyzed through electron back scattered diffraction (EBSD), using an Oxford Instrument C Nano EBSD detector in a high- resolution field emission gun (FEG) SEM (Zeiss Sigma 500). The test was conducted on M2 sample, since its microstructural features are intermediate between the other two samples. The test was repeated at low magnification (area of 622.90 ��m �� 370.16 ��m) and at high magnification (area of 28.5 ��m �� 7.78 ��m) with step size of 0.832 and 0.050 ��m, respectively, to obtain a suitable resolution.
Vickers microhardness (HV) measurements gave a preliminary characterization of mechanical properties. A Future-tech FM-700 microhardness tester was used, repeating at least five indentations for every sample, with 4.91 N load on the indenter and dwell time of 15 s.
Thermal properties were determined through differential scanning calorimetry (DSC) tests, using a Setaram TG/DSC Labsys 1600 machine. The goal of these analyses was evaluating the stability of PCM thermal behaviour and amount of energy stored over thermal cycles. Tests were conducted on samples of about 55 mg in alumina crucible under Ar inert atmosphere. The thermal history applied consisted of two consecutive cycles between room temperature and 320 ��C with a heating/cooling rate of 20 ��C/min, keeping the maximum temperature for 5 min; between the two cycles, temperature was held at 40 ��C for 20 min. The stored/released energy was determined by measuring the area of the transition peak occurring in correspondence of melting/solidification of Sn in the heat flux versus time curve; the baseline in correspondence of the peak was interpolated as a polynomial curve choosing the suitable grade to obtain the best fitting [24].
3 Results
3.1 Composition
XRD patterns (Fig. 2(a)) show that only pure Al and pure ��-Sn phases are present in as-produced conditions. Also, small traces of SnO can be observed; however, they are considered to be significant only in M3 sample by XRD analysis software (Maud [19]). Considering the main Sn peaks at low angles (Fig. 2(b)), their relative intensity changes in different samples. In particular, the first two peaks of both M1 and M3 samples have almost the same height and also the following peaks are in the same range; on the other hand, in M2 sample, the peak at 2��=32�� is significantly higher than the other Sn peaks.
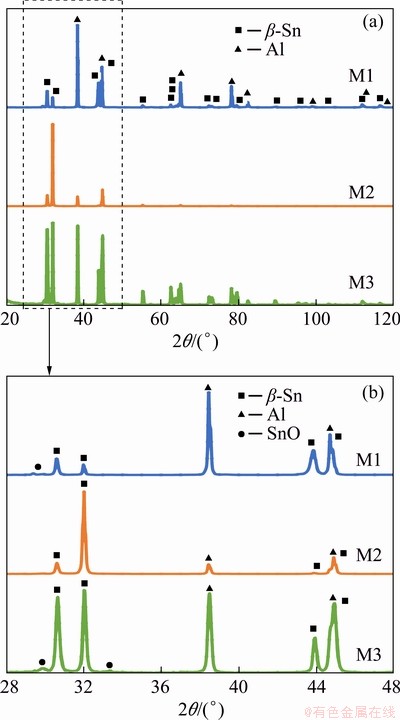
Fig. 2 XRD patterns of samples under as-produced conditions
3.2 Microstructure
Sample produced by Method 1 (ball milling of Sn powder and simple mixing of this powder with Al) was characterized by coarse microstructure, consisting of a broad distribution of Sn particles, ranging from few microns to more than 400 ��m (Fig. 3(a) and Table 1). In BSE-SEM micrographs, the darker phase is Al, whereas the brightest one is Sn. Sn particles are generally elongated in direction perpendicular to compression, even if elongation is less evident in smaller particles. In facts, combining results of fit ellipse angle and aspect ratio (Table 1), most particles have aspect ratio equal or greater than 2, i.e. the maximum axis is twice the minimum one, and their angle with respect to horizontal direction is zero, confirming what inferred from image qualitative analysis. After 100 thermal cycles (Fig. 3(b)), both the small, homogeneous particles and the coarse particles of inhomogeneous appearance are slightly more spherical, but the overall microstructure is pretty similar to that of as-produced samples.
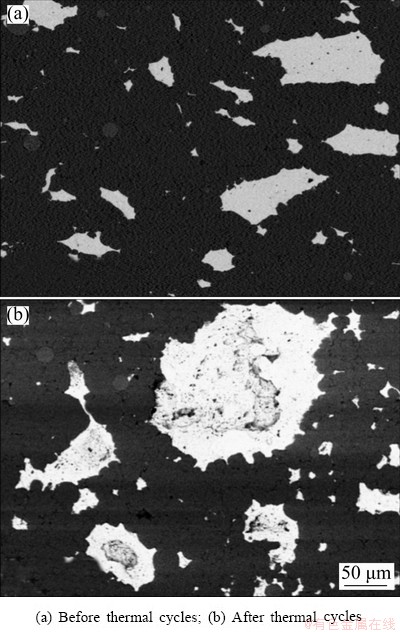
Fig. 3 BSE-SEM micrographs of sample obtained by Method 1
Table 1 Results of quantitative analysis on Sn particles in BSE-SEM micrographs of M1 sample before and after thermal cycles
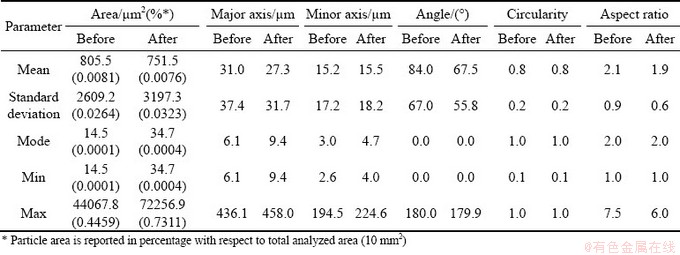
The presence of more spherical particles is highlighted also by the increment of average circularity and reduction of average aspect ratio. Even if the unvaried mode value suggests that the phenomenon does not occur for all particles, it is probably more frequent in bigger particles. Sn particles have a concave shape and small black spots are present. According to EDS analysis, these black particles consist of Sn (~50 wt.%), O and Si; Si impurities are probably present in Al powder. The overall composition of the sample in as-produced conditions from semi-quantitative analysis of BSE-SEM images is ~57 wt.% Al and ~33 wt.% Sn. Concerning porosity (Fig. 4), M1 sample is almost free of pores in as-produced conditions. After thermal cycles, porosity increases to slightly more than 1%.

Fig. 4 Porosity before and after thermal cycles
In the case of Method 2 (ball milling of Sn powders, ball milling of this powder with part of Al, and simple mixing with the rest of Al), sintering was performed, and few Sn droplets was observed from outer surfaces. Despite that, the core of the sample is compact, without significant pores (Fig. 4). From micrographs, it is possible to observe pure Al, pure Sn and an intermediate, much finer microstructure, which appears to be a mixture of Al and Sn particles (Fig. 5(a)); high magnification micrograph of Al-Sn mixed region is shown in the inset of Fig. 5(a). According to EDS, the latter contains around 50-60 wt.% of Sn in average, while the overall composition in low magnification sample areas is around 30 wt.% of Sn, with a few percent of O too. Al-Sn regions are contoured by fine Sn-rich grains. After thermal cycles, some leakage on sample surface was observed. Nevertheless, the general features of this micro- structure are kept, even if with some differences (Fig. 5(b)). First, in Al-Sn particles, the layer of fine Sn-rich grains becomes thicker and the inhomogeneous Sn distribution suggests its outward diffusion to form the Sn-rich layer. Then, a non- negligible amount of O (~20 wt.%) is observed in the inner part of coarse Sn particles and it increases up to 24 wt.% in their surrounding fine-grain Sn-rich layer (where EDS analyses performed on as-produced sample estimated 15 wt.% oxygen). Finally, porosity increases significantly, as shown in Fig. 4.
Sample obtained by Method 3 (ball milling of Sn powders, ball milling of this powder with part of Al, and ball milling with the rest of Al) displayed slight tin leakage from outer sample regions during sintering phase. The resulting as-produced micro- structure is the finest (Fig. 6(a)), even if a certain amount of pores (~2%) can be observed (Fig. 4). They are relatively small (ranging from nanometres or few microns to less than 50 ��m) and have a roughly rounded shape in longitudinal sections, suggesting a roughly spherical shape; on the other hand, regions with intermediate composition are elongated perpendicularly to compression direction.
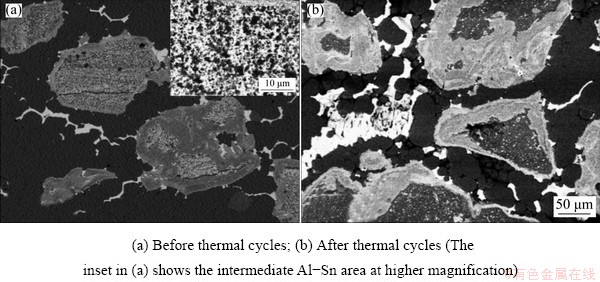
Fig. 5 BSE-SEM micrographs of sample obtained by Method 2
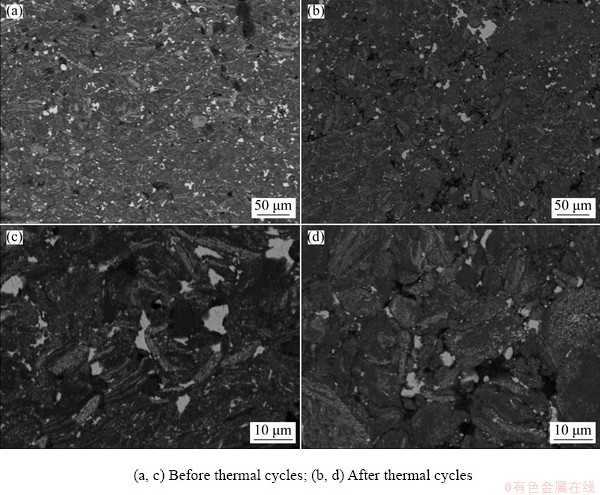
Fig. 6 BSE-SEM micrographs of sample obtained by Method 3
According to EDS analysis, the composition is: 53.3 wt.% Al, 33.6 wt.% Sn and 13.1 wt.% O. After 100 thermal cycles, the microstructure, at lower (Fig. 6(b)) and higher (Fig. 6(d)) magnifications, remains almost the same. However, porosity increases (Fig. 4).
In the case of M3 sample, quantitative analyses could not include all Sn-rich particles, since sub-micrometric particles have too low resolution to be clearly identified, as shown in high magnification micrograph (Fig. 6(c)). As for M1 sample, angle mode is equal to zero, and increase of mean circularity and aspect ratio prove the tendency of particles to become more spherical, even if it is probably more due to evolution of bigger particles, since mode values are still the same (Table 2). Considering area, major axis and minor axis (Table 2), it is possible to suppose that particles tend to become not only more spherical, but also slightly bigger.
EBSD inverse polar figures (IPFs) and IPF maps for Al phase are presented in Fig. 7. According to both the IPFs (Fig. 7(a)) and the IPF maps (Figs. 7(b, c)), orientations of Al grains are randomly distributed. This observation is valid in the core of the phase as well on the boundaries, where Al is in contact with Sn. On the other hand, the two IPFs of Sn (Fig. 8(a)) show that the most of Sn crystallographic poles are oriented in the same direction, which is highlighted also in the IPF maps (Figs. 8(b, c)), where the most of Sn area has the same colour with little tone variations. This homogeneous orientation is particularly evident along Y1 axis.
Table 2 Results of quantitative analysis of Sn particles in SEM micrographs of M3 sample before and after thermal cycles
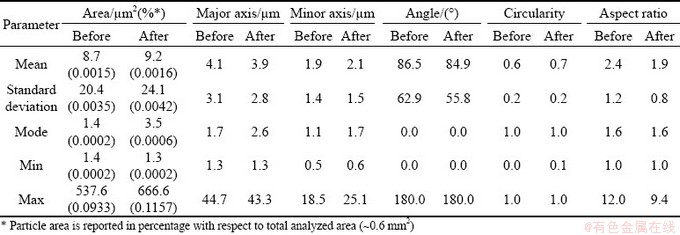
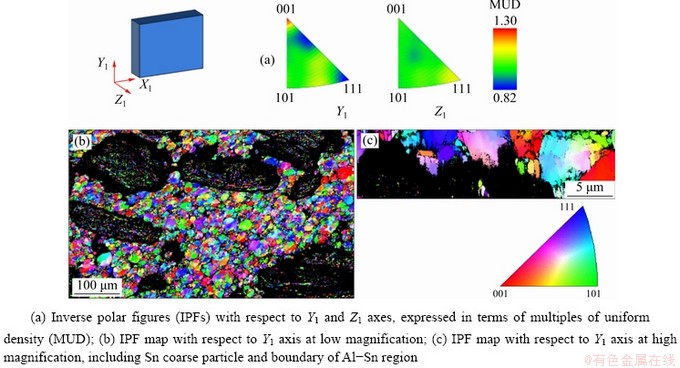
Fig. 7 EBSD results for Al phase (Y1 axis is parallel to compression direction and Z1 axis is perpendicular to sample surface)
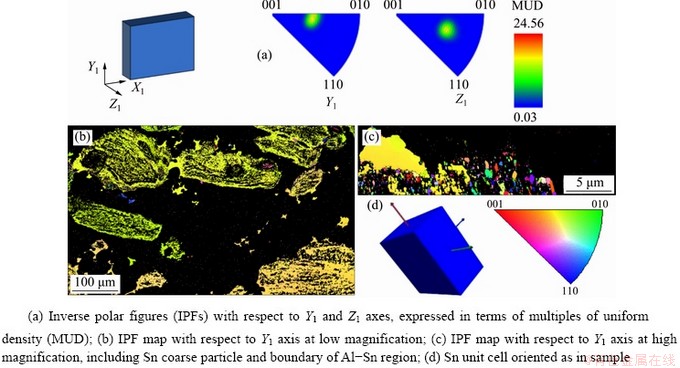
Fig. 8 EBSD results for Sn phase (Y1 axis is parallel to compression direction and Z1 axis is perpendicular to sample surface)
3.3 Mechanical properties
Results of Vickers microhardness tests are summarized in Fig. 9. Hardness of M1 and M2 samples is around 40 HV before thermal cycles and then decreases to 35 HV on average. Considering the higher standard deviation after cycles, the reduction is even less significant. M3 sample shows a higher hardness (~54 HV), which is almost constant after thermal cycles. The average size of the indentation (i.e. arithmetic mean of the two diagonal lengths d1 and d2 of the indentation) and area of corresponding indentations, computed from the definition of Vickers hardness according to the standard EN ISO 6507��1: 2018 [25], are reported in Table 3. By comparing these values with mean size and area of Sn particles, it is evident that indentations are significantly bigger than regions inside the material. Therefore, each hardness measurement generally depends on more than one phase.
3.4 Thermal response
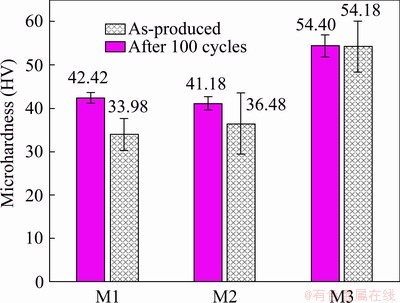
Fig. 9 Results of Vickers microhardness tests before and after thermal cycles
Table 3 Comparison of indentation size and area corresponding to mean value of Vickers microhardness with Sn particles size and area
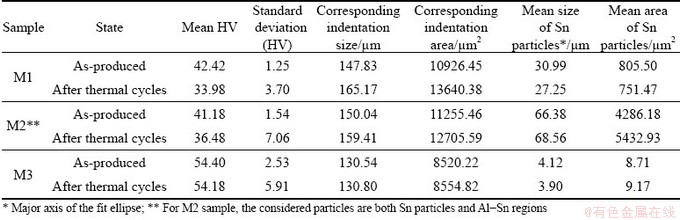

Fig. 10 Melting (a) and solidification (b) peaks on DSC curves for as-produced and thermal-cycled samples
Melting peaks in DSC curves are shown in Fig. 10(a) for each sample before and after thermal cycles. The peak has a V-shape and its onset temperature can be assumed to be around 227 ��C, even if for M2 and M3 samples the peak onset is very smooth and it is difficult to identify the exact value. The V-shape is kept after thermal cycles, but the peak tends to move at lower temperatures and its height decreases. M3 sample shows the less significant changes with respect to the other samples. On the other hand, solidification gives rise to multiple broad peaks. M1 sample has two peaks between 170 and 230 ��C, which appear also after thermal cycles. Almost no undercooling occurs in the first thermal cycles; while after 100 cycles, an undercooling of ~10 ��C is observed. Considering M3 sample, it is difficult to define the onset of transition; however, solidification clearly begins at temperatures lower than 180 ��C and ends at around 80 ��C. After 100 thermal cycles, the situation is generally unvaried, even if a short and broad peak forms around 180 ��C. The curve of M2 sample can be considered as an ��intermediate�� situation with respect to the other two: it has both broad and low peaks at low temperatures (below 180 ��C) and high peaks between 180 and 225 ��C.
Transition enthalpies determined from DSC curves are shown in Fig. 11. Due to the complex shape of the solidification peak, only melting peaks were considered in the calculation. In as-produced conditions, the highest value is observed for M1 sample (19.28 J/g), and the lowest for M3 sample (11.56 J/g). After thermal cycles, reduction of transition enthalpy is observed for every sample: ~38% for M1, ~48% for M2 and ~25% for M3.
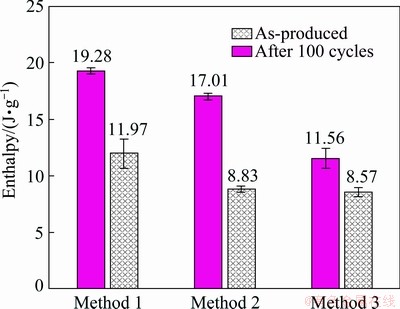
Fig. 11 Melting enthalpy before and after thermal cycles
4 Discussion
4.1 Composition
The applied powder metallurgy processes gave Al-Sn alloy almost without formation of other phases or contaminations. The exception is the formation of SnO, reasonably related to ball milling process; in facts, the longer the ball milling process is (one, two or three steps), the more the oxide is formed. Despite the protective Ar atmosphere, contamination occurred. Therefore, a further process optimization could involve a better control of the environment in the jar during ball milling, e.g. using longer time to achieve vacuum before adding inert gas and/or using other gas atmospheres. Moreover, it could be interesting also to consider different time processes.
4.2 Microstructure: were targets hit?
4.2.1 Method 1
The main aim of Method 1 was to obtain compact Sn particles, i.e. with high circularity and low aspect ratio. Sn particles should be prevented from flowing among Al grains during compression and, in the end, the leakage of the final microstructure should be avoided. As highlighted by both qualitative and quantitative analysis of BSE-SEM micrographs, Sn particles in M1 sample have generally a relatively rounded shape and are well isolated inside the Al matrix. This result confirms a positive effect of ball milling of Sn powder to reduce the difference of hardness with Al powder, since Sn particles are not flattened too much during compression. Moreover, Sn particles became more circular after thermal cycles; therefore, a sintering heat treatment could be useful to obtain this feature also in as-produced samples. In addition to the suitable Sn particle shape and distribution, this method results in a dense material, almost without porosity in as-produced conditions and significantly lower content with respect to the other two methods after thermal cycles.
4.2.2 Method 3
Method 3 gave a microstructure close to the desired one: very fine with good isolation of Sn particles. Nevertheless, non-negligible amount of porosity is observed. Despite of that, this microstructure is quite stable with respect to those obtained through Method 1 and Method 2 and probably higher compression stresses could have led to even less porosity and higher microstructural stability.
4.2.3 Method 2
The goal of Method 2 was to obtain an intermediate microstructure between the coarse one of Method 1 and the fine one of Method 3. In practice, the second ball milling step formed generally isolated regions containing an extremely fine distribution of Al and Sn, like in M3 sample microstructure, which has a Sn-rich external layer. In addition, like in M1 sample, coarse Sn particles are observed. The difference is that the latter form elongated and interconnected particles, from which Sn tends to leak toward the surface. In facts, shape and position of pores after cycles (i.e. around Al grains) correspond to shape and position of coarse Sn particles before cycles. Microstructure obtained through this method is not stable as expected, due to Sn leakage as well as the motion of Sn from the inner part of Al-Sn regions towards their boundaries.
Further, EBSD analysis of this sample shows a preferential grain orientation of Sn in longitudinal direction, which corresponds to the main heat flow direction during cooling after sintering. Actually, samples were simply cooled down in air; so, the most of heat flux was reasonably removed perpendicularly to the metallic substrate, i.e. along the axis of the cylindrical specimen. Moreover, it is not possible to identify a relationship between Al grains and Sn particles, because Sn has a preferential orientation everywhere and Al grains in contact with it are randomly orientated. As reported by MA et al [26], the anisotropy of Sn could affect thermal expansion and mechanical properties. However, in the tests performed up to now, clear effects of this feature were not observed. Nevertheless, it will be considered in the analysis of further mechanical tests.
4.3 Hardness
Microhardness values of M1 and M2 samples (~40 HV) as well as the one of M3 sample (~54 HV) are higher than the ones of cast Al-Sn alloys, which are usually around 30 HV [14]. This effect is ascribed to powder hardening during ball milling; however, thermal cycles are likely to cause relaxation and recrystallization of the alloy, which explains the reduction of hardness for M1 and M2. Conversely, M3 sample keeps its high hardness level also after thermal cycles. The explanation of this behaviour can be found considering a different hardening mechanism, i.e. precipitation hardening due to a homogeneous distribution of soft fine Sn particles in Al matrix [27]. As a matter of fact, this mechanism is not related to hardening of powders, which is reduced during thermal cycles due to the relaxation, but to the fine microstructure, which is stable even after many cycles. Therefore, this can explain hardness stability after simulated service. Higher content of pores in as-produced M3 sample and in all cycled samples causes more scattering in standard deviation.
4.4 Thermal response
4.4.1 Stored energy
All the samples have a DSC-measured melting enthalpy lower than the theoretical value computed for Al-40wt.%Sn alloy, i.e. 23.6 J/g. Considering M1 sample in as-produced conditions, the energy value (19.28 J/g) is quite close to the one obtained using the effective composition determined through semi-quantitative measurements (i.e. ~33 wt.% Sn, 19.47 J/g). After thermal cycles, measured enthalpy is even lower because some Sn leakage occurred, as demonstrated by visual analysis of sample surfaces just after simulated service and by the increment of porosity in correspondence of former coarse Sn particles. On the other hand, M3 sample shows a significantly lower melting enthalpy, despite a measured composition close to the nominal one. Authors think that this behaviour is related to the extremely fine microstructure which is characterized by micrometric and sub-micrometric Sn particles, but the actual mechanism is still not completely clear. However, despite the low energy, M3 sample gives the most stable thermal response. Finally, M2 sample, consisting of both coarse and fine Sn particles, behaves mainly as M1 sample; however, the reduction of stored energy with respect to the nominal one, especially after thermal cycles, could be also affected by the presence of the intermediate Al-Sn region containing fine Sn particles.
4.4.2 Thermal response mode
Analysis of transition peak shape on DSC curves allows to evaluate the ��thermal response mode�� of the material. As to melting peaks (Fig. 10(a)), they have always a V-shape and the width is generally the same for all the processes. Therefore, it is possible to conclude that melting behaviour is independent of microstructure and, consequently, it is independent of production process. The temperature that is assumed as activation temperature is lower than the melting temperature of pure Sn, but close to eutectic temperature. It is possible to ascribe this behaviour partially to the occurrence of eutectic reaction, and also to the presence of small particles which can lower the melting temperature with respect to bulk Sn. Also, the experimental error related to DSC machine calibration should be considered. Nevertheless, considering the final application of this material, these small differences are still acceptable. After thermal cycles, melting peaks are lower and narrower, due to the leakage of Sn during thermal cycles; in facts, this is more evident for M1 and M2 samples, which experienced more Sn losses.
On the other hand, solidification peaks change significantly in different production processes (Fig. 10(b)), i.e. they depend on the microstructure and, in more detail, on Sn particle size. As demonstrated by KIM and CANTOR [28], smaller particles of Sn in Al matrix solidify at lower temperature; in addition, some effect due to nanometric size can also contribute to the increase of undercooling [29].
Based on these concepts, solidification peaks observed in the present study can be reasonably correlated to the relative sample microstructures. M1 sample, which has the coarser microstructure, has two high peaks with onset between 220 and 230 ��C, i.e. with a low undercooling (less than 10 ��C); this behaviour occurs both before and after thermal cycles. Instead, in M3 sample, which has an extremely fine microstructure, solidification starts at significantly lower temperatures (below 180 ��C) and takes wider temperature ranges (about 80 ��C with respect to about 50 ��C of the M1 case). Finally, M2 sample has a microstructure that can be considered as intermediate between M1 and M3 samples with both coarse and fine microstructure in Al-Sn regions and, consequently, its thermal response is also intermediate between the other two, having both peaks close to transition temperature and with an undercooling of 60-70 ��C.
Moreover, the formation or growth of peaks at intermediate temperatures (160-180 ��C) in M3 and, especially, in M2 samples can be related to the coarsening of smaller particles noticed in micrographs. In conclusion, it is evident that solidification behaviour is strongly dependent on the microstructure and, on the production method: increasing the number of ball-milling steps, the final microstructure will be finer and consequently the thermal response will be shifted towards lower temperatures. This implies that thermal response of the material could be tailored according to the application requirements, i.e. fast or smooth heat release. For example, a slow heat release could be useful in mechanical components to reduce thermal stresses during heat release.
5 Conclusions
(1) Ball milling of Sn powder before mixing with Al is effective to reduce the hardness difference between the two metals. In this way, Sn particles are more rounded and less interconnected, reducing the leakage and improving the thermal stability.
(2) Mixing of Al and Sn powder through ball milling allows to obtain a fine microstructure with better mechanical properties with respect to simple mixing. Further, particle size dependent undercooling is revealed. Nevertheless, some collateral drawbacks are observed: a higher oxygen content and stored energy lower than expected for the actual Sn content.
(3) Observations on Method 2 combining simple mixing and ball milling confirm that microstructure has a strong effect on thermal response, especially on cooling. Therefore, it is potentially possible to design the microstructure to obtain the desired response on cooling, i.e., fast or slow heat release.
Acknowledgments
The Authors would like to thank Andrea MAGGI and Fabio FALGARI for their help in thermal characterization, and Filippo BELELLI, for his help in XRD tests. The Italian Ministry of Education, University and Research is acknowledged for the support through the Project ��Department of Excellence LIS4.0-Lightweight and Smart Structures for Industry 4.0��.
References
[1] PIELICHOWSKA K, PIELICHOWSKI K. Phase change materials for thermal energy storage [J]. Progress in Materials Science, 2014, 65: 67-123. doi: 10.1016/J. PMATSCI.2014.03.005.
[2] SU W, DARKWA J, KOKOGIANNAKIS G. Review of solid-liquid phase change materials and their encapsulation technologies [J]. Renewable and Sustainable Energy Reviews, 2015, 48: 373-391. doi: https://doi.org/10.1016/ j.rser.2015.04.044.
[3] SAFARI A, SAIDUR R, SULAIMAN F A, XU Y, DONG J. A review on supercooling of phase change materials in thermal energy storage systems [J]. Renewable and Sustainable Energy Reviews, 2017, 70: 905-919. doi: https:// doi.org/10.1016/j.rser.2016.11.272.
[4] ZHOU C, WU S. Medium- and high-temperature latent heat thermal energy storage: Material database, system review, and corrosivity assessment [J]. International Journal of Energy Research, 2019, 43: 621-661. doi: 10.1002/er.4216.
[5] FERNANDEZ A I, BARRENECHE C, BELUSKO M, SEGARRA M, BRUNO F, CABEZA L F. Considerations for the use of metal alloys as phase change materials for high temperature applications [J]. Solar Energy Materials and Solar Cells, 2017, 171: 275-281. doi: https://doi.org/10. 1016/j.solmat.2017.06.054.
[6] SUGO H, KISI E, CUSKELLY D. Miscibility gap alloys with inverse microstructures and high thermal conductivity for high energy density thermal storage applications [J]. Applied Thermal Engineering, 2013, 51: 1345-1350. doi: 10.1016/J.APPLTHERMALENG.2012.11.029.
[7] GARIBOLDI E, PERRIN M. Metallic composites as form-stable phase change alloys [C]//Trans Tech Publications. 2019: 1966-1971. doi: 10.4028/www.scientific.net/MSF.941. 1966.
[8] CONFALONIERI C, LI Z, GARIBOLDI E. Metallic form-stable phase change materials for thermal energy storage and management: General features and effect of manufacturing process on thermal response and stability [J]. La Metallurgia Italiana��International Journal of the Italian Association for Metallurgy, 2019, 7-8: 12-20.
[9] CONFALONIERI C, BASSANI P, GARIBOLDI E. Microstructural and thermal response evolution of metallic form-stable phase change materials produced from ball-milled powders [J]. Journal of Thermal Analisis and Calorimetry, 2020. doi: 10.1007/s10973-020-09785-7.
[10] CONFALONIERI C, GRIMALDI A T, GARIBOLDI E, Ball-milled Al-Sn alloy as composite phase change material [J]. Materials Today Energy, 2020, 17: 100456. doi: 10.1016/ j.mtener.2020.100456.
[11] MCALISTER A J, KAHAN D J. The Al-Sn (aluminum-tin) system [J]. Bulletin of Alloy Phase Diagrams, 1983, 4: 410-414. doi: 10.1007/BF02868095.
[12] CHIKOVA O A, KONSTANTINOV A N, SHISHKINA E V, CHEZGANOV D S. Nanoindentation study of the effect of the structural state of the melt on the crystal structure and mechanical properties of the phases in an Al-50wt.%Sn alloy [J]. Russian Metallurgy (Metally), 2013, 2013: 535-544. doi: 10.1134/S0036029513070045.
[13] STUCZYNSKI T. Metallurgical problems associated with the production of aluminium-tin alloys [J]. Materials & Design, 1997, 18: 369-372. doi: https://doi.org/10.1016/ S0261-3069(97)00078-2.
[14] LIU X, ZENG M Q, MA Y, ZHU M. Promoting the high load-carrying capability of Al-20wt%Sn bearing alloys through creating nanocomposite structure by mechanical alloying [J]. Wear, 2012, 294-295: 387-394. doi: 10.1016/ j.wear.2012.07.021.
[15] BALANOVIC L, ZIVKOVIC D, MANASIJEVIC D, MINIC D, MARJANOVIC B. Calorimetric study and thermal analysis of Al-Sn system [J]. Journal of Thermal Analysis and Calorimetry, 2013, 111: 1431-1435. doi: 10. 1007/s10973-012-2499-8.
[16] SURYANARAYANA C, Mechanical alloying and milling [J]. Progress in Materials Science, 2001, 46: 1-184. doi: https:// doi.org/10.1016/S0079-6425(99)00010-9.
[17] SGRAZULIS S, DASKEVIC A, MERKYS A, CHATEIGNER D, LUTTEROTTI L, QUIROS M, SEREBRYANAYA N R, MOECK P, DOWNS R T, le BAIL A. Crystallography open database (COD): An open-access collection of crystal structures and platform for world-wide collaboration [J]. Nucleic Acids Research, 2012, 40: D420-D427. doi: 10.1093/nar/gkr900.
[18] WYCKOFF R W G. Crystal structures [M]. 2nd ed. New York: Interscience Publishers, 1963.
[19] LUTTEROTTI L. Maud [Z]. 2018. http://maud. radiographema.eu.
[20] RASBAND W S. ImageJ [Z]. 2018. https://imagej.net/ Welcome.
[21] UNDERWOOD E. The mathematical foundations of quantitative stereology [C]//PELLISSIER G, PURDY S. Stereology and Quantitative Metallography. West Conshohocken, PA: ASTM International, 1972: 3-38. doi: 10. 1520/STP36841S.
[22] FERREIRA T, RASBAND W. ImageJ user guide [Z]. 2012, https://imagej.nih.gov/ij/docs/guide/146.html.
[23] TAKASHIMIZU Y, IIYOSHI M. New parameter of roundness R: Circularity corrected by aspect ratio [J]. Progress in Earth and Planetary Science, 2016, 3: 2. doi: 10.1186/s40645-015-0078-x.
[24] HEMMINGER W F, SARGE S M. The baseline construction and its influence on the measurement of heat with differential scanning calorimeters [J]. Journal of Thermal Analysis, 1991, 37: 1455-1477. doi: 10.1007/BF01913481.
[25] EN ISO 6507-1:2018, Metallic materials �C Vickers hardness test, Part 1: Test method [S]. 2018.
[26] MA Z L, SHANG H, DASZKI A A, BELYAKOV S A, GOURLAY C M. Mechanisms of beta-Sn nucleation and microstructure evolution in Sn-Ag-Cu solders containing titanium [J]. Journal of Alloys and Compounds, 2019, 777: 1357-1366. doi:https://doi.org/10.1016/j.jallcom.2018.11. 097.
[27] LIU X, ZENG M Q, MA Y, ZHU M. Melting behavior and the correlation of Sn distribution on hardness in a nanostructured Al-Sn alloy [J]. Materials Science and Engineering A, 2009, 506: 1-7. doi: 10.1016/J.MSEA.2008. 12.054.
[28] KIM W T, CANTOR B. Solidification of tin droplets embedded in an aluminium matrix [J]. Journal of Materials Science, 1991, 26: 2868-2878. doi: 10.1007/BF01124815.
[29] YANG B, GAO Y L, ZOU C D, ZHAI Q J, ZHURAVLEV E, SCHICK C. Size-dependent undercooling of pure Sn by single particle DSC measurements [J]. Chinese Science Bulletin, 2010, 55: 2063-2065. doi: 10.1007/s11434-010- 3041-7.
��ĩұ����Ϲ������Al-Sn���������ϵ��Ⱥ���ѧ��Ӧ
Chiara CONFALONIERI, Maxime PERRIN, Elisabetta GARIBOLDI
Department of Mechanical Engineering, Politecnico di Milano, Via La Masa 1, 20156 Milan, Italy
ժ Ҫ����ĩұ���������ڴӻ��ܼ�϶�Ͻ��Ʊ���̬�ȶ��Ĺ�-Һ�����ϡ����÷�ĩұ�����ܹ���õ��۵����������ڸ��۵���Ի����з�ɢ���õĸ��Ͻ������ϣ���ֹ�������п������������Ӷ����Ӳ������ȶ��ԡ���ϴ�ͳ�ķ�ĩ��ϼ���(��Ϻ���ĥ)�Ը���Al-Sn�Ͻ�Ļ�������������ѧ���ܡ���ʵ�ϣ���ĥ Sn�ۿ��Լ������� Al �۵�Ӳ�Ȳ��죬������ĥ�����ַ�ĩ��ϻ�õ�ϸС������֯���Ӷ������ѧ���ܡ����⣬���ò�ͬ����Ϸ�ʽ��ۣ�����Ӧȡ��������֯�������ǻ���������ijߴ硣����ϸ��˵���ִ�Ļ�����������ṩ���ٷ�����С�Ĺ��䣬��С�����ڴ��¶ȷ�Χ�����̸�������һ���棬����������ߴ粻��Ӱ���ۻ��ʹ��ȡ���ˣ�����ͨ�����غϽ������֯�����������ȶ��ԡ�
�ؼ��ʣ����������ϣ���ĩұ�����ȶ��ԣ���ѧ���ܣ����ܼ�϶�Ͻ�
(Edited by Bing YANG)
Corresponding author: Chiara CONFALONIERI; E-mail: chiara.confalonieri@polimi.it
DOI: 10.1016/S1003-6326(20)65456-5
Abstract: Powder metallurgy processes are suitable to produce form-stable solid-liquid phase change materials from miscibility gap alloys. They allow to obtain a composite metallic material with good dispersion of low-melting active phase particles in a high-melting passive matrix, preventing leakage of the particles during phase transition and, therefore, increasing the stability of thermal response. Also, the matrix provides structural properties. The aim of this work is to combine conventional powder mixing techniques (simple mixing and ball milling) to improve active phase isolation and mechanical properties of an Al-Sn alloy. As matter of fact, ball milling of Sn powder allows to reduce hardness difference with Al powder; moreover, ball milling of the two powders together results in fine microstructure with improved mechanical properties. In addition, different routes applied showed that thermal response depends on the microstructure and, in particular, on the particle size of the active phase. In more detail, coarse active phase particles provide a fast heat release with small undercooling, while small particles solidify more slowly in a wide range of temperature. On the other hand, melting and, consequently, heat storage are independent of the particle size of the active phase. This potentially allows to ��tailor�� the thermal response by producing alloys with suitable microstructure.
[18] WYCKOFF R W G. Crystal structures [M]. 2nd ed. New York: Interscience Publishers, 1963.
[19] LUTTEROTTI L. Maud [Z]. 2018. http://maud. radiographema.eu.
[20] RASBAND W S. ImageJ [Z]. 2018. https://imagej.net/ Welcome.
[25] EN ISO 6507-1:2018, Metallic materials �C Vickers hardness test, Part 1: Test method [S]. 2018.
