
Trans. Nonferrous Met. Soc. China 28(2018) 2427-2439
Shear behavior of AZ80 Mg alloy using experimental, theoretical and numerical techniques
A. BANAFSHI, F. FERESHTEH-SANIEE
Department of Mechanical Engineering, Faculty of Engineering, Bu-Ali Sina University, Hamedan 65178, Iran
Received 21 November 2017; accepted 24 April 2018
Abstract:
The shear punch test (SPT) is a suitable experiment for characterizing the shear behavior of various materials, especially where there are volume limitations. In the present investigation, the relations among various parameters such as clearance, die diameter and sample thickness, and the yield and ultimate shear strengths of AZ80 Mg alloy were studied. Moreover, based on the Mohr-Coulomb theory, relatively optimum conditions were introduced for the shear punch test. With this regard, a range of 2%-10% is found to be suitable for the clearance/sheet thickness ratio. To provide a simple shear stress state during a shear punch test, it is also necessary to select the die diameter/sheet thickness ratio between 2:1 and 10:1. Based on the predictions of the Mohr-Coulomb theory, it is better to conduct a room-temperature shear punch test with a sample thickness of 0.5 mm, a clearance of 25 ��m and a die diameter of 2 mm. Finally, the mean conversion factors to gain the tensile and compressive yield strengths of the cast AZ80 from its shear one are found to be 1.70 and 3.09, respectively.
Key words:
shear punch test; Mohr-Coulomb theory; shear behavior; AZ80 Mg alloy; numerical simulation;
1 Introduction
The shear punch test (SPT) was first introduced by LUCAS [1], where he employed this technique to determine the mechanical properties of materials used for making nuclear reactors. He conducted various experiments, namely SPT, microhardness and the bulge tests, with different alloys, such as copper, brass, aluminum and steel alloys, and compared the experimental findings with the corresponding stress-strain curve obtained from the tensile test. The SPT, which is actually a small-sample test, is very suitable where restrictions exist for the amount and dimensions of the test specimen. The shear punch test has extensively been used in many investigations. MAHMUDI et al [2] utilized the SPT for two different cold-rolled and annealed steel alloys. They conducted SPT and tensile tests in a temperature range of 25-850 ��C and compared the experimental results with each other. In another research, MAHMUDI et al [3], studied the behaviors of zinc and tin alloys within a temperature range of 25-152 ��C. They found that the greater the tin content, the lower both the yield and ultimate strengths of the alloy were. SPT has also been employed for light alloys, such as A356 aluminum [4], and AZ80 magnesium [5] alloys. SHINOHARA et al [6] performed SPT and ball microhardness tests with pure nickel, stainless steel and pure iron and compared the relevant experimental findings obtained. Their sample sizes were as small as those of a TEM disc. Some researchers used the shear punch test for dental, ceramic and composite materials [7-9]. Conducting SPTs for seven different materials, NOMOTO et al [8] claimed that this experiment was suitable for standardization of dental fillers and materials. BAO et al [9] related the shear strengths of Ti3AlC2 ceramic specified by two different experiments, namely SPT and compression test. QIAN et al [10] studied the behavior of the extruded aluminum profile under the shear-compression load by utilizing the shear punch test. SPT was also employed by ZABIHI et al [11] to find the mechanical properties of a hot rolled aluminum-based composite. They showed the increase of the shear strength by increasing the amount of alumina particles in the aluminum matrix. In another investigation [12], they found certain improvements in the shear load with increasing the number of accumulative roll bonding (ARB) cycles.
As shown in Fig. 1. in an SPT, a small sheet specimen is located between the upper and lower dies of the experimental set up and, then, sheared by a cylindrical punch with a flat base. The upper die acts as a guide for the moving punch, whereas the punch and the lower die operate as two opposite cutting edges [1].

Fig. 1 Schematic illustration of shear punch test set-up [1]
Since the SPT experiment is usually conducted with a universal testing machine, the load-displacement curve is the original data gained via this test. This curve is converted to a shear stress-normalized displacement by means of the following relationships [13]:
 (1)
(1)
 (2)
(2)
where �� is the average shear stress, P is the punch load, r is the average value of the punch and die radii (rpunch and rdie in Fig. 1) and t is the thickness of the test sample. In Eq. (2), �� is the normalized displacement and d is the punch travel during the experiment.
The peak shear stress in a shear stress-normalized displacement curve is called the ultimate shear stress (USS). Despite this parameter which can easily been specified form the curve, different criteria have been proposed by various researchers for determination of the shear yield stress (SYS). By accurate measurement of the movement of the punch head, TOLOCZKO et al [14] found a much better agreement result between the SPT and tensile tests. Their punch was 8 times harder than the previous ones and the punch diameter and its height were 1.0 and 18.0 mm, respectively. By performing the SPT tests with 0.25 mm-thick samples made of copper, aluminum, stainless steel, brass and low-carbon steel, they have found a good correlation with the von Mises prediction.
GUDURU et al [15] tried different punch-die clearances and sample thicknesses in order to study the effects of these variables on the values of SYS and USS. It was observed that for a fixed clearance, there was no considerable influence of sample thickness on the USS values of various materials. However, slight decrease in shear yield stresses of the aluminum and stainless steel alloys was detected when the sample thickness was reduced. To examine the effect of clearance, the sample thickness was specified and then the experiments were conducted for brass, pure zinc and stainless steel. Expecting for a very minor reduction in the yield point of the brass, enlarging the clearance did not affect the SYS and USS values of different materials. Nevertheless, GUDURU et al [16] numerically simulated the SPT and utilized a 0.15% offset method to specify the shear yield stress for various alloys. GOYAL et al [17] followed the Guduru��s suggestions in their finite-element (FE) analyses of the shear punch test. They selected the shear stress corresponding to 0.15% of the normalized displacement as the SYS of the material and obtained a good agreement with the Mises criterion.
Determination of mechanical properties of various Mg alloys has been the concern of many researches. With this regard, several researchers utilized the shear punch test for evaluation of shear strengths of different magnesium alloys, e.g. extruded and then ECAPed AZ31 [18], extruded Mg-6Li-1Zn at 200-300 ��C [19], cast Mg-4Zn-xSb with various tin contents at 25 and 200 ��C [20], and cast AZ91 and AZ91+2RE Mg alloys at 25-250 ��C [21]. Several researchers have found these properties for hot-deformed magnesium alloy by employing compression test [22] and others [23] used tensile test in order to gain the mechanical behavior of multi-direction forged AZ40 magnesium alloy.
The main purpose of the present work was to examine the effects of clearance, thickness and, die diameter as a new variable on conducting the shear punch test. Moreover, introduction of the relation between the data of SPT and those obtained through tensile and compression tests for materials such as AZ80 alloy, representing different behaviors in tension and compression, was another objective of this investigation. The experimental and finite element methods were employed to achieve these goals.
2 Finite-element simulation of SPT
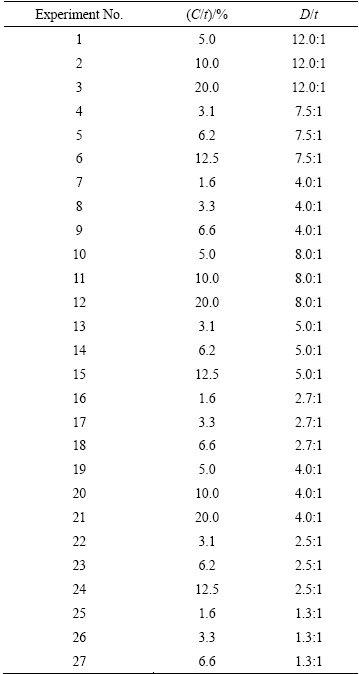
Two series of finite-element (FE) analyses were conducted for the shear punch test. The preliminary simulations were performed in order to estimate appropriate dimensions for the die set. A wide range of dimensions was used for conducting the FE simulations. By choosing three levels for each variable and comparing the results, the range became narrower so it was easier to approach the best combination of the parameters. The strain rate range relevant to the tensile and compression tests was obtained from the numerical simulations. The stress-strain curves determined by FERESHTEH-SANIEE et al [24] were employed for doing this series of the FE analyses. After manufacturing the die set for SPT and performing the tensile and compression tests, the second series of the FE simulations were conducted. The main objective of this series of the analyses was validation of the FE results by comparing with tests carried out for the present investigation. Considering three levels for each geometrical parameter, altogether 27 finite-element simulations were conducted for the first series of the numerical analyses of SPT (Table 1).
Table 1 Geometrical parameters for different preliminary FE simulations of shear punch test

The numerical analyses of SPT were carried out using Deform software. The axially symmetry of the shear punch test was considered for the FE modeling (Fig. 2). Elastic-plastic 4-node quadrilateral elements were utilized for modeling the workpiece. After performing the convergence test, the number of elements for the workpiece was selected between 4000 and 6000 for various simulations with different geometrical parameters. Since SPT is a quasi-static experiment, to create a strain-rate field corresponding to Ref. [17], the punch velocity was adopted to be 0.004 mm/s. The shear punch test is a shear-compression process [25]. That is why the data obtained from the compression tests [24] were used in the simulations of this experiment. The maximum ultimate compressive strength was selected as the damage criterion.
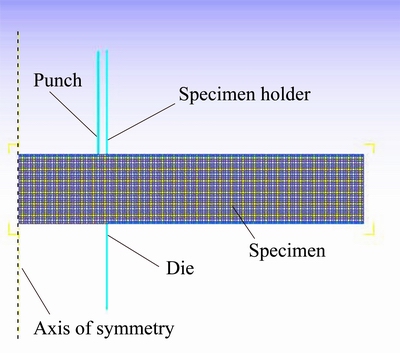
Fig. 2 Different parts of FE model for numerical simulation of SPT

Fig. 3 Distribution of Mises stress for various stages of sample deformation during numerical simulation of SPT

Fig. 4 Mises stress contours for yield point of sample (Arrows show the width of plastic zone)
Figure 3 illustrates various stages of deformation of the test sample during a typical SPT. In Fig. 3(a), the specimen starts to deform elastically and the maximum stress occurs next to the punch and die corners (arrows show this regions). Afterwards, the test sample experiences plastic deformation and the greatest stress takes place within the shear band. Arrows show the width of the shear band (Fig. 3(b)). Figure 3(c) corresponds to the maximum punch load and arrows show the plastic regions with the maximum stress. Finally, Fig. 3(d) illustrates the tearing stage of the experiment. The regions indicated by arrows in Fig. 3(d) involve plastic zones with the minimum level of stress, where the stress of these regions tends to be zero, and one can conclude that they are like free surfaces and the specimen is torn.
All parts of the tool set of the shear punch test were modeled as rigid bodies, similar to the previous researchers [16,17]. Therefore, since the elastic behaviors of the frame of the forming press and the punch are not modeled, the punch displacements are considerably smaller than those of the corresponding real experiment. To find the yield point in the FE analyses, the Mises stress contours were employed. GOYAL et al [17] claimed that by transition of the stress state from elastic to plastic, whole the shear band possesses the maximum stress, whereas no plastic deformation has taken place. Figure 4 illustrates the distribution of Mises stress in the deformation region of the sample which corresponds to such a situation. Arrows show the width of the plastic zone. Hence, a point in the shear stress-normalized displacement diagram which relates to the stress state shown in Fig. 4, has been adopted and then a line was drawn parallel to the initial linear part of the diagram to intersect the horizontal axis. The normalized displacement corresponding to this intersection point which was found to be 0.1% at the room temperature, was selected for determination of the yield point in the FE results.
3 Experimental
3.1 Shear punch tests
As mentioned previously, in a SPT, a cylindrical punch with a flat bottom face applies a shear force to the test sample, resulting a quite pure shear stress state at a cylindrical surface through the thickness of the specimen. The first objective of the present investigation is to study the effects of the sample thickness, punch-die clearance and diameter of the die on the shear properties obtained from a SPT. The second aim of this research work is relating the shear strength obtained from a shear punch test to experimental findings gained from the conventional tension and compression tests. To achieve these goals, three levels were selected for each of above-mentioned SPT variables. Hence, three dies and nine punches were manufactured to be used for AZ80 alloy samples with various thicknesses. Table 2 shows the test conditions for the 27 shear punch experiments designed for the present investigation.
3.1.1 Shear dies and punches
All the tools were made of VCN 200 (DIN 1.6580) steel with UTS of 1300 MPa. Because of high strength and good weldability, this steel has extensive applications for tool manufacturing in various metal forming industries. Three dies with internal diameters of 2, 4 and 6 mm were machined. Each die consisted of two components, namely the main die and the sample holder. These parts could be fastened to each other by means of a couple of screws. The main function of the holder was just gripping the specimen without exerting any force on it. To provide different clearances mentioned in Table 2 for various dies, nine punches were also prepared.
Table 2 Geometrical parameters for 27 shear punch tests designed for present work

3.1.2 Test samples
To make the specimen, AZ80 magnesium alloy was first cast using a special flux and in a preheated metallic die. Afterwards, the cast rod was machined to have 8 mm in diameter. Then, this machined AZ80 rod was wire cut to make disc samples with various thicknesses. To eliminate the effect of wire cut machining, each base of the disc samples was polished about 0.1 mm. Using this procedure, various specimens with desired thicknesses (Table 2) were prepared.
3.1.3 Method of performing SPTs
At first, the specimen was placed between the main die and blank holder and fixed in the position by means of a couple of screws. For more accurate measurement of the punch displacement, an LVDT with a 5 mm stroke was employed. Figure 5 illustrates the arrangement of various parts of the experimental set-up on the testing machine. All the SPT tests were conducted using a 50 kN servo-electrical testing machine. Since the SPT is a quasi-static experiment, all the shear punch tests were performed with a punch speed of 0.004 mm/s. For each test condition listed in Table 2, three shear punch tests were conducted and the average value of the experimental findings for each series of experiments was considered as the final SPT result for each condition. Therefore, 81 shear punch tests were altogether carried out at the room temperature. For each SPT, a load- displacement curve was provided by the testing machine. Using equations 1 and 2, this curve was converted to a shear stress-normalized displacement diagram. By this means, the influences of various test variables on the experimental findings were studied.

Fig. 5 Arrangement of different parts of SPT experimental set- up on testing machine
3.2 Tensile tests
Three tensile tests were carried out at the room temperature for the cast AZ80 alloy. These tests were conducted using a 150 kN servo-electrical testing machine. The load-displacement curve obtained from this series of tests was transformed to engineering stress-strain curves. Figure 6 shows a typical stress-strain diagram for the cast AZ80 magnesium alloy. Employing the offset method with a strain of 0.2%, the average yield stress was found to be 120.7 MPa. The average tensile ultimate strength was also specified to be 180.5 MPa.

Fig. 6 Typical engineering stress-strain curves for cast AZ80 alloy
3.3 Compression tests
As mentioned previously, the correlation between the shear and axial mechanical properties of the cast AZ80 alloy is studied in the present investigation. Since the behavior of the Mg alloys is significantly different in tension and compression, it is necessary to determine the compressive stress-strain curve of these alloys besides to the tensile ones. For this reason two compression tests were performed for the material under consideration. To make the test samples, the cast AZ80 alloy was machined to cylinders with a nominal height of 9 mm and a diameter of 6 mm. Both the compression tests were conducted with a 50 kN servo-electrical testing machine. Although the results of these tests were reasonably close to each other, the average values were calculated for both the yield and ultimate stresses. Similar to Ref. [26], 0.2% offset method was used for specifying the compressive yield stress. It was found to be 220.4 MPa. However, the ultimate compressive strength was determined to be 270.5 MPa for the cast AZ80. Figure 6 shows one of the compressive ��-�� curves for this alloy.
4 Results and discussion
Comparing the numerical results with the corresponding experimental findings, an encouraging agreement was found between them. For instance, Fig. 7 illustrates a representative comparison between the FE and experimental results for various clearances but the same die (6 mm) and sample thickness (1.5 mm). As can be seen, there is a good correlation between the two sets of the findings. Hence, in continuation of this section, the effects of various parameters, namely die diameter, clearance and thickness of the specimen, are just studied based on the outcomes obtained from the practical shear punch experiments.
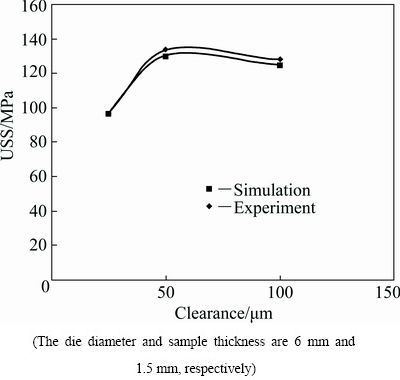
Fig. 7 Effects of die clearance on ultimate shear strength (USS) obtained from practical and numerically modeled shear punch tests

Fig. 8 Different zones created on cut surface during fine blanking process [29]
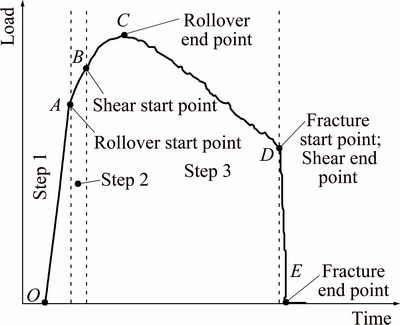
Fig. 9 Typical load-displacement curve of blanking operation [29]
The mode and stages of deformation in a shear punch test are very similar to those of fine blanking. For this reason, general concepts of the latter operation are employed here to discuss and explain the results of the former experiment. Figure 8 illustrates various zones of the sheared edge of the sheet in a fine blanking process, including rollover zone, shear zone, fracture zone and burr zone. Figure 9 also shows the relevant parts of a load-displacement curve of blanking operation for these zones. The rollover zone is created by the plastic deformation of the material. The smooth and shiny region of the cut section is caused by the shear process. After creation of the crack in the sample, an irregular and rough surface is formed. Finally, the burr zone is caused by plastic deformation of the specimen at the end stage of the process. In a blanking process, the depth of crack penetration and the angle of the fracture zone completely depend on the amount of the clearance. When the clearance is not proper, additional layers of the sample are torn before its complete rupture. An appropriate clearance results in a suitable fracture angle such that the upper and lower fracture zones gradually propagate to meet each other. On the other hand, a too large clearance creates a conical sheared edge [27-29].
4.1 Effect of clearance

Fig. 10 Variation of ultimate (a, c, e) and yield (b, d, f) shear stresses with clearance for different sample thicknesses with different die diameters
Figure 10 shows effects of the clearance on USS and yield shear stress (SYS) for various die diameters and sheet thicknesses. The thicker the sample, the greater the shearing forces and stresses are. By increasing the clearance from 25 to 50 ��m, the shearing strengths increase as well. However, the curves decline when the clearance increases from 50 to 100 ��m. Considering a specific thickness, the fracture angle and, consequently, the fracture area increase by increasing the clearance from 25 to 50 ��m. This results in greater shearing force and stress. By increasing the clearance from 50 to 100 ��m, the shearing stress decreases because when the clearance is too large, the length of the shear zone reduces and the length of the fracture zone increases. This results in more deviations from the pure shear state of stress and, subsequently, from the required forming force for conducting the relevant SPT.
Besides the influence of the clearance, its combination with thickness has interesting effect on the experiment. Therefore, selecting an appropriate value for the ratio of clearance/thickness C/t, one can observe a successful fine blanking process. It is suggested to choose this ratio between 2% to 10% [27]. A value lower than 2% extends the rollover stage of the process whereas a C/t ratio greater than 10%, increases the contribution of the fracture step. In both the cases, the shearing stress reduces. The numerical and experimental studies of the present investigation also illustrated that out-of-range values of C/t ratio have resulted in undesired findings. For this reason, it was tried to find a more precise range of C/t for the shear punch test. GUDURU et al [15] studied the effect of clearance on the shear strength in shear punch testing. They, first, selected a specified clearance and then conducted the SPTs with specimens made of pure zinc, brass, 6061 aluminum and AISI 430 stainless steel and with different thicknesses. The punch diameter was also 2.49 mm whereas the die and sample diameters were 2.51 and 6.00 mm, respectively. Then, they considered a specific thickness for sample and changed the clearance within the standard range and found that the variation of this parameter did not influence the shear stresses. They neither tried out-of-range values of clearance nor examined the interaction between this variable and the sample thickness, i.e. a more complete range and variable C/t ratio.
Table 3 summarizes the clearance/thickness ratio for the numerical and experimental studies conducted for the present investigation. As can be seen, the range of C/t is 1.6%-20%. But, based on the discussion mentioned above, the range of 2%-10% previously proposed for the blanking process is more suitable for performing a shear punch test. According to the findings, a thickness of 1.5 mm and a clearance of 25 ��m resulted in a C/t ratio of 1.6%, whereas, the thickness of 0.8 mm and clearance of 100 ��m produced a C/t ratio of 12.5%, which both are out of the suitable range for conducting an appropriate shear punch test.
4.2 Effect of die diameter
As shown in Fig. 11, one can study the influence of the die diameter on the USS of the material obtained from the shear punch tests. It is clear that the larger the die, the more obvious the difference between the ultimate shear strengths of samples with different thicknesses. Based on results illustrated in Fig. 11, when the die diameter increases, the sample sheet decreases or the clearance enlarges but the other test variables keep unchanged, more variations can be observed in the values obtained for the USS of the metal. In all these cases, the deformation regime deviates from a pure simple shear to a combination of bending and simple shear and this introduces certain errors in the calculated USS.
For bulk materials a researcher can wire cut the SPT samples into the desired thickness. However, this opportunity does not exist for rolled or other sheet products. For this reason, it is better to focus on the die diameter/thickness ratio and examine its effect on the deformation state of the SPT sample during the experiment. The influence of D/t on SPT is considered for the first time in the present investigation and other researchers did not pay any attention to this effect. Table 3 shows values of this ratio for the conducted shear punch tests, ranging from 1.3:1 to 12.0:1. After observing different experimental results, it was found that very large (for instance 12.0:1) and very small (for example 1.3:1) values of die diameter/thickness resulted in abnormal findings which were not consistent with other results. With this regard, examination of the fractured edge of the sample under an optical microscope revealed certain differences on the cut surfaces of the specimens obtained from various shear punch tests. It was observed that a large die diameter/thickness ratio (e.g. 12.0:1) could result in a larger fracture area and a smaller sheared area in the thickness-through section of the specimen, whereas a too small ratio (i.e. 1.3:1) enlarged the rollover zone and limited, again, the shear zone.
Table 3 Die diameter/thickness ratio (D/t) and clearance/ thickness percentage for different shear punch tests
Figures 12 and 13 demonstrate these situations for typical specimens. The images were prepared along the thickness of the samples. As shown in Fig. 8, the cut edge of the sample can be divided into three zones, namely rollover, shear and fracture zones. Under the microscope, the rollover zone was distinguished by a rough surface including dispersed pits, whereas the fracture zone was characterized with many irregular grooves and projections. The shear zone was also identified as smooth and quite shiny part of the cut edge. Figure 13(a) represents the cut image for a sample with a die diameter/thickness of 1.3:1. It can be seen that the sectioned area mainly contains the rollover and fracture zones, where the former makes up a larger area. Figure 12(b) corresponds to a specimen with a ratio of 12.0:1, where the fracture zone is larger than the others. The section image of the sample with a ratio of 5.0:1 is illustrated in Fig. 13. It is clear that this picture contains all the rollover, shear and fracture zones, where the sheared area is considerable compared with the other two zones. To provide the necessary magnification, Fig. 13(a) just involves the rollover and shear areas, whereas Fig. 13(b) shows the shear and fracture zones. To introduce a suitable range of D/t for the first time, the sheared sections of various SPT specimens were studied and it was found that a range of 2:1-10:1 was appropriate for the die diameter/thickness in order to obtain reliable shear strengths.

Fig. 11 Ultimate shear strength versus die diameter for various sample thicknesses and clearances

Fig. 12 Morphologies on thickness section of specimens with D/t ratios of 1.3:1

Fig. 13 Morphologies on various thickness sections of sample with die diameter/thickness ratio of 5.0:1
One of unusual situation occurred in Fig. 11 was for t=0.5 mm and D=6 mm, resulting a D/t ratio of 12.0:1. This quite high ratio resulted in an enlargement of the fracture area and an USS value which was significantly different from the other relevant experimental findings. Moreover, in Fig. 10(c) (i.e. for a die diameter of 2 mm) when the sheet thickness is 1.5 mm, the variations of the shear strengths do not conform to those of the other SPT experiments. In this case the die diameter to thickness is about 1.3:1 and out of the above-mentioned desired range. Table 3 summarizes the die diameter/thickness ratios for the numerical and experimental studies conducted for the present investigation. The tried range of D/t in Table 3 is 1.3:1-12.0:1, whereas based on the shear properties via different SPT experiments, a range of 2:1-10:1 is more desirable.
4.3 Best combination for conducting SPT
The Mohr-Coulomb theory is employed for materials with different mechanical properties in tension and compression. Since magnesium and its alloys possess such a behavior, this theory is used for the present research. The main objective of using the theory was to understand which SPT conditions provided the most accurate shear strengths for the cast AZ80 under consideration. Based on the Mohr-Coulomb theory [30], using the tensile and compressive strength data of the material, one can calculate its yield and ultimate shear stresses by means of the following equations, respectively:
 (3)
(3)
 (4)
(4)
where ��y�� and ��u�� stand for yield and ultimate, whereas subscribes ��s��, ��t�� and ��c�� stand for shear, tensile and compressive, respectively. For the AZ80 alloy employed for this study, these equations resulted in 78.0 and 108.5 MPa for Ssy and Ssu, respectively. If the agreement between the experimental ultimate shear strength and Ssu is considered as an appropriateness of the SPT conditions, only the die diameters of 2 and 4 mm should be introduced. Table 4 illustrates the experimental and numerical values of the ultimate shear stress obtained by means of these dies. These values, especially that of D= 2 mm, are the closest ones to Ssu calculated based on Eq. (7) and, also imply a very good correlation between the FE findings and those of the practical shear punch tests.
It is worthy to mention that for experiment No. 10, the C/t and D/t ratios were respectively 5:1 and 8:1, both of which were within the acceptable ranges suggested previously. This was also the case for test No. 19 excepting that the ratio of die diameter/sheet thickness was 4:1. Figure 14 illustrates experimental load curves for test No. 10 and 19. All the results plotted in Fig. 11 were obtained based on such curves.
Table 4 Optimum shear punch test conditions for gaining ultimate shear strength as close as possible to that predicted by Mohr-Coulomb theory
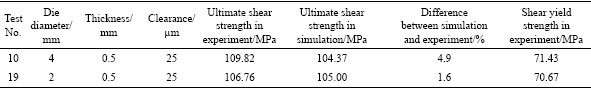
Table 5 Shear yield stresses obtained from experimental results by using three different techniques in comparison with those of theory and FE simulation (MPa)


Fig. 14 SPT curves for tests 10 and 19
LUCAS [1] suggested using the separation point, where the curve departs the initial linear part of the shear stress-normalized displacement curve, for determination of the shear yield stress. TOLOCZKO et al [14], also employed 1.0% offset method for determination of SYS values in different shear punch tests. KARTHIK et al [13] investigated the shear behaviors of aluminum, copper and various steels. They selected the punch diameter and the clearance to be 3.0 mm and 0.04 mm, respectively. The offset method was again employed but with various values, namely 0.15%, 0.2% and 1.0% of the normalized displacement. It was claimed that the best results were those corresponding to 0.2% and the criteria proposed by TOLOCKO et al [14] were suitable for their own experimental procedures. Thus, depending on the experimental set up, various criteria were utilized by different investigators for specifying the shear yield stress of the material. In this work, the shear yield stress is specified by using three methods, namely separation of the load-normalized displacement curve from its initial linear part, 1% and 2.2% offset methods. The results for tests No. 10 and 19 are summarized in Table 5. The amount of shear yield stress obtained from 2.2% offset method was less than those of the 1% and separation point criteria because there was a nonlinear curve after the initial linear part of the load-normalized displacement diagram. In order to decide which method was more accurate, all the three shear yield stresses were compared with those of the FE simulations and the Mohr-Coulomb theory. The lowest errors were related to application of 2.2% offset method, all less than 10%. Therefore, one can conclude that the shear yield strength obtained by means of the 2.2% offset technique could be more reliable. For this reason, all the shear yield stresses shown in Fig. 10 were determined employing this technique.
Some researchers have been interested in proposing relationships between the shear strength (��) gained from SPT and the tensile strength (��) obtained from the tensile test. The relation, initially suggested for both the yield and ultimate strengths, was in the form of ��=A��+B, where A and B were constants, depending on the material under consideration [1]. However, the relationship such as ��ys=A��ys is usually employed for correlating the shear and tensile yield strengths in Ref. [14]. Some researchers have proposed a similar equation for relating the ultimate tensile strength (UTS) and the maximum shear stress (��max) in the shear stress-normalized displacement diagram:
UTS=m��max (5)
where m is a constant ranging from 1.06 to 2.25 for different materials [13,15].
In ��=m�� relationship, m is a conversion factor for calculation of normal yield or ultimate strengths from the relevant shear ones. It differs from one alloy to another one. This simple factor, which can be employed for both the tensile and compressive stress states, is used for experimental findings of tests No. 10 and 19 and the final results are summarized in Table 6. As can be observed, the average value of m for the tensile yield stress is 1.70, which is very close to that suggested by the von Mises criterion for isotropic materials. AKBARIPANAH et al [31] determined a value of 1.87 for m. But they obtained this value for an ECAPed AZ80 alloy and for converting its ultimate shear strength to the relevant ultimate tensile stress. It is clear that performing an ECAP operation on the AZ80 alloy produces certain changes in its texture [30] and this, in turn, affects the value of m. Therefore, value of m for a wrought metal is different from that of its cast form, where the material exhibits a quite isotropic behavior. In a conclusion, it could be claimed that the von Mises relationship between the tensile and shear yield strengths of the AZ80 magnesium alloy might be established just for its cast form. However, for the compressive yield stress of cast AZ80, the conversion factor is much greater, namely more than 3.0 (see Table 6).
Table 6 Values of m for converting shear properties of cast AZ80 alloy to its various uniaxial-state properties

5 Conclusions
1) A range of 2%-10%, which has previously been proposed for the blanking process, is also suitable for the clearance/sheet thickness in an SPT. Values of this ratio which were out of the above-mentioned range, resulted in undesirable and quite inaccurate experimental findings.
2) To provide a simple shear stress state during a shear punch test, it is necessary to select the die diameter/sheet thickness between 2:1 and 10:1. A greater value of this ratio resulted in an extension of the fracture area, whereas a smaller value enlarged the rollover zone through the thickness of the sample. Both the cases limited the shear area of the specimen and caused inaccuracies in the shear properties obtained.
3) Based on the predictions of the Mohr-Coulomb theory, it is better to conduct a room-temperature shear punch test with a sample thickness of 0.5 mm, a clearance of 25 ��m and a die diameter of 2 mm. For these optimum dimensions, the percentage clearance/ sheet thickness and the die diameter/sheet thickness ratio are respectively 5% and 4.0:1, both of which were within the appropriate ranges suggested in the previous conclusions.
4) The mean conversion factors to obtain the tensile and compressive yield strengths of the cast AZ80 from its shear one were found to be 1.70 and 3.09, implying that for calculation of the tensile yield stress of this alloy, the conversion factor was closed to that of von Mises criterion for isotropic materials but there was a large difference between factors for the compressive yield stress.
References
[1] LUCAS G E. The development of small specimen mechanical test techniques [J]. Nuclear Materials, 1983, 117: 327-339.
[2] MAHMUDI R, SADEGHI M. Correlation between shear punch and tensile strength for low-carbon steel and stainless steel sheets[J]. Materials Engineering and Performance, 2013, 22: 433-438.
[3] MAHMUDI R, ESLAMI M. Shear strength of the Zn-Sn high- temperature lead-free solders [J] Materials Science: Materials in Electronics, 2011, 22(8): 1168-1172.
[4] HAGHDADI N, ZAREI-HANZAKI A, ROOSTAEI A A, HEMMATI A R. Evaluating the mechanical properties of a thermomechanically processed unmodified A356 Al alloy employing shear punch testing method [J]. Materials & Design, 2013, 43: 419-425.
[5] ABEDI H R, ZAREI-HANZAKI A, BAGHERZADEH BIUCKI M, EMAMY M. Evaluating the room temperature mechanical properties of age hardened AZ80 magnesium alloy using shear punch testing method [J]. Material Science and Engineering A, 2014, 606: 360-369.
[6] SHINOHARA K, LUCAS G E, ODETTE G R. Shear punch and ball microhardness measurements of 14 MeV neutron irradiation hardening in five metals [J]. Nuclear Materials, 1985, 133: 326-331.
[7] LEON C A, DREW R A L. Small punch testing for assessing the tensile strength of gradient Al/Ni-SiC composites [J]. Materials Letters, 2002, 56: 812-816.
[8] NOMOTO R, CARRICK T E, McCABE J F. Suitability of a shear punch test for dental restorative materials [J]. Dental Materials, 2001, 17(5): 415-421.
[9] BAO Y W, CHEN J X, WANG X H, ZHOU Y C. Shear strength and shear failure of layered machinable Ti3AlC2 ceramics [J]. The European Ceramic Society, 2004, 24(5): 855-860.
[10] QIAN L, PAREDES M, WIERZBICKI T, SPARRER Y, FEUERSTEIN M, ZENG P, FANG G. Experimental and numerical study on shear-punch test of 6060 T6 extruded aluminum profile [J]. Mechanical Sciences, 2016, 118: 205-218.
[11] ZABIHI M, TOROGHINEJAD M R, SHAFYEI A. Evaluating the mechanical behavior of hot rolled Al/alumina composite strips using shear punch test [J]. Materials Science and Engineering A, 2014, 618: 490-495.
[12] ZABIHI M, TOROGHINEJAD M R, SHAFYEI A. Shear punch test in Al/Alumina composite strips produced by powder metallurgy and accumulative roll bonding [J]. J Materials Science and Engineering A, 2016, 667: 383-390.
[13] KARTHIK V, VISWESWARAN P, VIJAYRAGHAVAN A, KASIVISWANTHAN K.V, BALDEV R V. Tensile�Cshear correlations obtained from shear punch test technique using a modified experimental approach [J]. Nuclear Materials, 2009, 393(3): 425-432.
[14] TOLOCZKO M B, KURTZ R J, HASEGAWA A, ABE K. Shear punch tests performed using a new low compliance test fixture [J] Nuclear Materials, 2002, 307: 1619-1623.
[15] GUDURU R K, DARLING K A, KISHORE R, SCATTERGOOD R O, KOCH C C, MURTY K L. Evaluation of mechanical properties using shear�Cpunch testing [J]. Materials Science and Engineering A, 2005, 395: 307-314.
[16] GUDURU R K, SCATTERGOOD R O, KOCH C C, MURTY K L. Finite element analysis of a shear punch test [J]. Metallurgical and Materials Transactions A, 2006, 37: 1477-1483.
[17] GOYAL S, KARTHIK V, KASIVISWANTHAN K V, VALSAN M, RAO K, BALDEV R V. Finite element analysis of shear punch testing and experimental validation [J]. Materials & Design, 2010, 31: 2546-2552.
[18] MASOUDPANAH S M, MAHMUDI R. Effects of rare earth elements and Ca additions on high temperature mechanical properties of AZ31 magnesium alloy processed by ECAP [J]. Materials Science and Engineering A, 2010, 527: 3685-3689.
[19] KARAMI M, MAHMUDI R. Hot shear deformation constitutive analysis of an extruded Mg-6Li-1Zn alloy [J]. Materials Letters, 2012, 81: 235-238.
[20] ALIZADEH R, MAHMUDI R. Evaluating high-temperature mechanical behavior of cast Mg-4Zn-xSb magnesium alloys by shear punch testing [J]. Materials Science and Engineering A, 2010, 527: 3975-3983.
[21] MAHMUDI R, KABIRIAN F, NEMATOLLAHI Z. Microstructural stability and high-temperature mechanical properties of AZ91 and AZ91+2RE magnesium alloys [J]. Materials & Design, 2011, 32: 2583-2589.
[22] FAN C, PENG Y, YANG H, ZHOU W, YAN H. Hot deformation behavior of Al-9.0Mg-0.5Mn-0.1Ti alloy based on processing map [J]. Transactions of Nonferrous Metals Society of China, 2017, 27: 289-297.
[23] SHI G, ZHANG K, LI X, LI Y, MA M, YUAN J, LU C. Mixed grain structure and mechanical property anisotropy of AZ40 magnesium alloy bar with diameter of 160 mm [J]. Transactions of Nonferrous Metals Society of China, 2015, 25: 3944-3952.
[24] FERESHTEH-SANIEE F, BARATI F, BADNAVA H, FALLAH NEJAD K H. An exponential material model for prediction of the flow curves of several AZ series magnesium alloys in tension and compression [J]. Materials & Design, 2012, 35: 1-11.
[25] EL-MAGD E, ABOURIDOUANE M. Characterization, modeling and simulation of deformation and fracture behavior of the light-weight wrought alloys under high strain rate loading [J]. Impact Engineering, 2006, 32: 741-758.
[26] TOLOCZKO M B, KURTZ R J. Room temperature compression properties of two heats of unirradiated V-4Cr-4Ti [R]. Richland, WA (US): Pacific Northwest National Laboratory (PNNL), 2004.
[27] TOTRE A, NISHAD R, BODKE S. An overview of factors affecting in blanking processes [J]. Emerging Technology and Advanced Engineering, 2013, 3: 390-395.
[28] GUSTAFSOON E. Experiment on sheet metal shearing [D]. Lulea: Lulea University of Technology, 2013, 112.
[29] ARMUNANTO V B, YUDIT C N S, PRIYANTO K. Circularity analysis of different clearances in the sheet metal punching process [J]. International Journal of Engineering and Advanced Technology, 2012, 2: 277-280.
[30] BUDYNAS R G, NISBETT K J. Shigley��s mechanical engineering design [M]. 3rd ed. New york: McGraw-Hill, 2015.
[31] AKBARIPANAH F, FERESHTEH-SANIEE F, MAHMUDI R, KIM H K. Microstructural homogeneity, texture, tensile and shear behavior of AM60 magnesium alloy produced by extrusion and equal channel angular pressing [J]. Material and Design, 2013, 43: 31-39.
ͨ��ʵ�顢���ۺ���ֵģ�⼼���о�AZ80þ�Ͻ�ļ�������
A. BANAFSHI, F. FERESHTEH-SANIEE
Department of Mechanical Engineering, Faculty of Engineering, Bu-Ali Sina University, Hamedan 65178, Iran
ժ Ҫ�����г������(SPT)�����ڱ������ֲ��ϵļ������ܣ��������ܵ�������ƵIJ��ϡ������о�AZ80þ�Ͻ�������ͼ�����ǿ������ֲ�������϶��ģ��ֱ������Ʒ��ȣ�֮��Ĺ�ϵ�����⣬����Mohr-Coulomb���ۣ��ڼ��г���������������������������������������ʵļ�϶/Ƭ�ĺ�ȱȷ�ΧΪ2%~10%��Ϊ���ڼ��г���������ṩ������Ӧ��״̬����Ҫѡ���ģ��ֱ��/Ƭ�ĺ�ȱ�Ϊ2:1~10:1������Mohr-Coulomb ����Ԥ�⣬�õ����¼��г����������Ų���Ϊ����Ʒ���0.5 mm����϶25 ��m��ģ��ֱ��2 mm��ͨ����̬AZ80þ�Ͻ�ļ�������ǿ�Ȼ���õ��俹���Ϳ�ѹ����ǿ�ȵ�ƽ������ϵ���ֱ�Ϊ1.70��3.09��
�ؼ��ʣ����г�����飻Mohr-Coulomb���ۣ��������ܣ�AZ80þ�Ͻ���ֵģ��
(Edited by Xiang-qun LI)
Corresponding author: F. FERESHTEH-SANIEE; Tel: +98-81-38292630; Fax: +98-81-38292631; E-mail: ffsaniee@basu.ac.ir; ffsaniee@yahoo.com
DOI: 10.1016/S1003-6326(18)64889-7
Abstract: The shear punch test (SPT) is a suitable experiment for characterizing the shear behavior of various materials, especially where there are volume limitations. In the present investigation, the relations among various parameters such as clearance, die diameter and sample thickness, and the yield and ultimate shear strengths of AZ80 Mg alloy were studied. Moreover, based on the Mohr-Coulomb theory, relatively optimum conditions were introduced for the shear punch test. With this regard, a range of 2%-10% is found to be suitable for the clearance/sheet thickness ratio. To provide a simple shear stress state during a shear punch test, it is also necessary to select the die diameter/sheet thickness ratio between 2:1 and 10:1. Based on the predictions of the Mohr-Coulomb theory, it is better to conduct a room-temperature shear punch test with a sample thickness of 0.5 mm, a clearance of 25 ��m and a die diameter of 2 mm. Finally, the mean conversion factors to gain the tensile and compressive yield strengths of the cast AZ80 from its shear one are found to be 1.70 and 3.09, respectively.
