
J. Cent. South Univ. (2012) 19: 547-552
DOI: 10.1007/s11771-012-1038-x![]()
Behaviour of large post-liquefaction deformation in saturated sand-gravel composites
PAN Hua(�˻�)1, CHEN Guo-xing(�¹���)1, 2, SUN Tian(����)1, LIU Han-long(������)2
1. Institute of Geotechnical Engineering, Nanjing University of Technology, Nanjing 210009, China;
2. Geotechnical Research Institute, Hohai University, Nanjing 210098, China
? Central South University Press and Springer-Verlag Berlin Heidelberg 2012
Abstract:
The laboratory tests on the post-liquefaction deformation of saturated sand-gravel composites were performed to investigate the characteristics of stress-strain relation and the dissipation of pore water pressure by the hollow cylinder apparatus. It is found that the stress-strain response and the dissipation process of pore water pressure are composed of three stages, including the low intensive strength stage, the superlinear strength recovery stage and the sublinear strength recovery stage, and the demarcation points of the curve of pore water pressure are lag behind those of the stress-strain response. The comparison results of the behaviour of large post-liquefaction deformation between saturated sand-gravel composites and Nanjing fine sand show that the low intensive strength stage and the superlinear strength recovery stage of saturated sand-gravel composites are shorter while the sublinear strength recovery stage is longer. A stress-strain model and a dissipation model of excess pore water pressure of liquefied sand-gravel composites are established, in which the initial confining pressure and the relative density can be considered synthetically. And it is found that the predicted results by the two models are in good agreement with experimental data.
Key words:
1 Introduction
Earthquakes can cause huge damage to buildings, bridges and other structures founded on sand deposits, for example, the 1964 Niigata earthquake [1], the 1983 Nihonkai-Chuba earthquake [2] and the 1995 Hyogoken-Nambu earthquake [3]. Since then, a lot of researches have been carried out to study the liquefaction mechanisms. The foundation deformation is composed of two parts: one is the residual deformation generated under the ground motion; the other is the flow deformation generated under the deadweight and external force after the liquefaction of soil, which is also called post-liquefaction deformation. The former may be several centimeters while the latter may be several meters. The large post-liquefaction deformation may occur even in level deposits with a sufficiently large lateral extent [4-5], so the prediction of large post-liquefaction deformation has a very important engineering significance.
The large post-liquefaction deformation can be evaluated approximately using simpli?ed methods such as those proposed by HAMADA et al [6], TOKIMATSU and SEED [7], ISHARA and YOSHIMINE [8], TOWHATA et al [9], BARTLETT and YOUD [10]. YASUDA et al [11] proposed a double line model of stress-strain relationship of sand after liquefaction based on laboratory tests. LIU et al [12] conducted a series of torsional tests on sand, and proposed a hyperbolic model of stress-strain relationship of sand after liquefaction. ZHANG et al [13] proposed a constitutive model which can evaluate small to large cyclic strains of saturated sand during liquefaction process based on Ramberg-Osgood model. WANG et al [14] proposed a constitutive model which included the low intensive strength stage, superlinear strength recovery stage and sublinear strength recovery stage.
The above researches were carried out based on the saturated sand. However, the disaster investigations due to earthquake show that liquefaction damage of sand-gravel composites is not a rare entity. For example, the protective layer of sand-gravel composites of Miyun reservoir in Beijing was liquefied during the 1976 Tangshan earthquake, which induced the slope sliding. Likewise, there was liquefaction damage of sand-gravel composites during the 1983 Borah earthquake. Thus, it is necessary to study the post-liquefaction deformation characteristics of sand- gravel composites. However, nowadays, sufficient seismic hazard evaluation data are not available.
XU et al [15] and ZOU et al [16] proposed a constitutive model composed of three lines based on the laboratory tests on the post-liquefaction deformation of sand-gravel composites. Obviously, the accuracy of segment-line models used to reflect the stress-strain relationship of soil after liquefaction is not pretty high, and cannot reflect sublinear strength recovery stage of soil or the flow stage of soil under the static load.
The stress-strain responses and the characteristics of excess pore water pressure after liquefaction of sand-gravel composites were studied. A constitutive model of stress-strain responses and a dissipation model of excess pore water pressure were established, and the influence of relative densities and confining pressure on the characteristics of liquefied soil were studied. The results can provide experimental and theoretical basis for forecasting vertical and lateral deformation of liquefied foundation and ground in sand-gravel composites deposit.
2 Experimental
2.1 Test equipment
The hollow cylinder apparatus which can conduct tests on hollow cylinder samples and solid cylinder samples was used in this work. In static triaxial test, the maximum axial strain can reach 20%, so it is suitable for the tests on the post-liquefaction deformation of saturated sand-gravel composites.
2.2 Test materials
The tests were carried out on the samples of saturated sand-gravel composites and the grain size distribution is shown in Fig. 1.
2.3 Test procedure
The solid cylinder samples were used in all tests, whose diameter and height are 100 mm and 200 mm, respectively. The dry deposition method was employed in the sample preparation. When filling of dry sand-gravel composites was finished, CO2 gas flowed to replace the air. The specimen was subsequently filled with de-aired water which had been circulated for about 30 min. Back pressure was then applied incrementally up to approximately 300 kPa so as to saturate the specimen. Pore water pressure parameter B of all the prepared samples was required to gain a value over 0.98. Cyclic loading was imposed on the specimens after consolidation stage in order to liquefy the specimens, then the static loading was imposed on the liquefied specimens at a certain strain speed, as shown in Fig. 2.
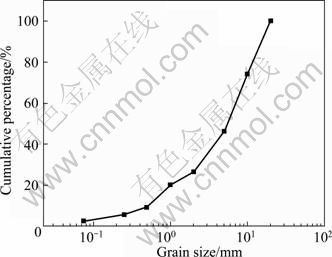
Fig. 1 Grain size distribution curve of sand-gravel composites

Fig. 2 Loading process in post-liquefaction tests
The influence of relative densities and confining pressure on the characteristics of liquefied soil were studied with confining pressures �ҡ�0 equal to 100, 200 and 300 kPa, respectively, and relative densities Dr equal to 30%, 50% and 60%, respectively.
3 Results and discussion
Figure 3 shows the test results of stress-strain relationship and the dissipation curves of pore water pressure of sand-gravel composites after liquefaction under confining pressure �ҡ�0=100 kPa and relative density Dr=50%, and the results of Nanjing saturated fine sand under the same condition are also shown in Fig. 3.
It can be found that the stress-strain relationship of liquefied sand-gravel composites is different from that under the ordinary static triaxial test. The stress-strain relationship of liquefied sand-gravel composites and Nanjing fine sand all can be divided into three stages. ��0 is the strain demarcation point of the first and second stages, and ��1 is the strain demarcation point of the second and third stages.

Fig. 3 Relationships between deviator stress q, excess pore water pressure u and axial strain ��a of sand-gravel composites and Nanjing fine sand when �ҡ�0=100 kPa, Dr=50%
In the first stage, the tangent modulus of soil increases from zero to a minimal value, the axial strain ��a increases quickly, the deviator stress q almost equals zero, and the pore water pressure nearly keeps as the confining pressure. The soil almost presents as fluid body and it cannot bear any shear stress. So, this stage is called the low intensive strength stage defined by SHAMOTO et al [5]. Because the effective stress of liquefied sand almost equals zero, the specimen has a trend of vibro- compaction under the cyclic loading, and the water of the specimen is under the compression status. Then, there is a trend of shear dilation in the specimen under the static loading, and the water of the specimen transforms from compression status to free state. In the transformation process, the effective stress almost maintains zero, but the axial strain increases greatly. Compared with sand, the first stage of stress-strain relationship curve of sand-gravel composites is very short, and its strain demarcation point ��0 is only about 1%. This means that the strength of sand-gravel composites can be recovered after liquefaction in a relatively short period of time.
In the second stage, the water of the specimen transforms to free state wholly with the development of the axial strain. The pore water pressure decreases quickly, and the effective stress increases fast, so the strength of specimen recovers gradually, and the stress- strain curve appears as upper concave. And this stage is called the superlinear strength recovery stage. Compared with sand, the second stage of stress-strain relationship curve of sand-gravel composites is also very short, and the strain demarcation point ��1 is only about 4%.
In the third stage, the specimen is also under the state of shear dilation, and the deviator stress q increases continuously, while the tangent modulus decreases. The stress-strain relationship curve appears as upper convex, and this stage is called the sublinear strength recovery stage.
In theory, the stress-strain curve will present as a horizontal line with the development of the strain. This means that the specimen will be destroyed and appear as flow state under the static loading (just as the results of Nanjing fine sand). However, because of the range of axial force transducer, the tests of sand-gravel composites are terminated as the strain reaches 15%. There is no horizontal line of stress-strain curve at the end of the tests, but such trend can be found with the help of the test data.
Figures 4 and 5 show the stress-strain curves of sand-gravel composites after liquefaction under different confining pressures �ҡ�0 and relative densities Dr. It can be found that the values of ��0 and ��1 decrease with the increase of �ҡ�0, but the ultimate strength of sand-gravel composites increases. The value of ��0 decreases with the increase of Dr, while the value of ��1 and the ultimate strength of sand-gravel composites increase.

Fig. 4 Relationships between deviator stress q and axial strain ��a of sand-gravel composites under different confining pressure
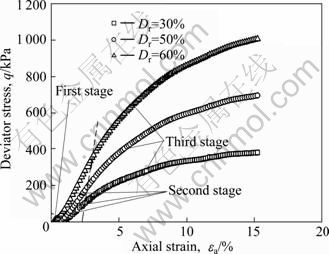
Fig. 5 Relationships between deviator stress q and axial strain ��a of sand-gravel composites under different relative densities
4 Stress-strain relationship
4.1 Mathematical model of stress-strain relationship
According to the characteristics of stress-strain relationship of liquefied sand-gravel composites, exponential curve can be used to fit the test data. The function expression is shown as
![]() (1)
(1)
where ![]() , so parameter c equals the ultimate value of deviator stress q, c=qu; d and f are the fitting parameters. So, Eq. (1) can be rewritten as
, so parameter c equals the ultimate value of deviator stress q, c=qu; d and f are the fitting parameters. So, Eq. (1) can be rewritten as
![]() (2)
(2)
4.2 Fitting results of constitutive model
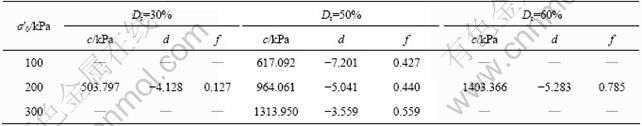
Figures 6 and 7 show the results fitted by Eq. (1), and the fitting parameters c, d and f are summarized in Table 1. The results indicate that the exponential curves can reflect the stress-strain relationship of liquefied saturated sand-gravel composites.
Based on the results of Table 1, the fitting parameters c, d and f can be determined by relative densities Dr and effective confining pressures �ҡ�0:
 (3)
(3)

Fig. 6 Fitting results of stress-strain responses under different confining pressures
4.3 Verification of constitutive model
Another two tests are used to verify the applicability of the constitutive model: Dr=0.4, �ҡ�0=150 kPa and Dr=0.55, �ҡ�0=250 kPa. The tested and predicted curves of stress-strain responses are shown in Fig. 8. It can be found that the results of the experiment generally tally with the predicted analyses. This means that the constitutive model has a good applicability.

Fig. 7 Fitting results of stress-strain responses under different relative densities
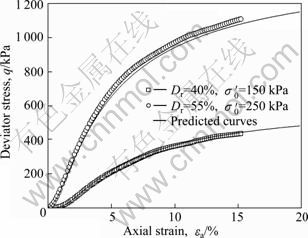
Fig. 8 Comparison of tested and predicted curves of stress-strain responses of valid tests
Table 1 Values of parameters of stress-strain under different test conditions
5 Dissipation model of pore water pressure
5.1 Establishment of dissipation model of pore water pressure
Figures 9 and 10 show the relationship between pore water pressure u and axial strain ��a of liquefied saturated sand-gravel composites. It can be found that the dissipation process of u can also be divided into three stages just like the stress-strain relationship, but the demarcation points of each stage are lag behind those of the stress-strain relationship (see Fig. 3).
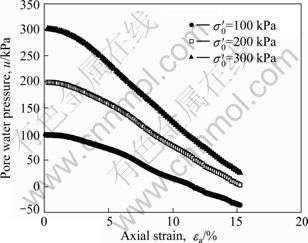
Fig. 9 Effects of confining pressure on relationships between deviator stress q and axial strain ��a of sand-gravel composites
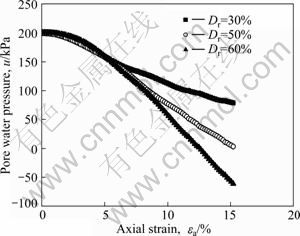
Fig. 10 Effects of relative density on relationships between deviator stress q and axial strain ��a of sand-gravel composites
Based on the research on the test data, the relation between normalized pore water pressure u* and deviator stress q* is just as shown as
![]() (4)
(4)
where u*=u/�ҡ�0; q*=q/�ҡ�0; ![]()
Because all the tests in this work were made under isotropic consolidation, the pore water pressure under the dynamic loading can reach the initial effective confining
pressure �ҡ�0. This means that ![]() . So, Eq. (4) can be rewritten as
. So, Eq. (4) can be rewritten as
![]() (5)
(5)
where n and t are the fitting parameters.
5.2 Fitting results of dissipation model of pore water pressure
Figures 11 and 12 show the results fitted by Eq. (5), and the fitting parameters n and t are summarized in Table 2.
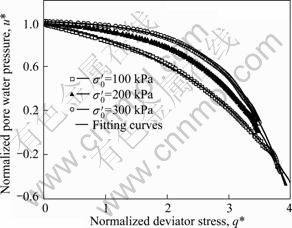
Fig. 11 Fitting results of normalized pore water pressure under different confining pressures
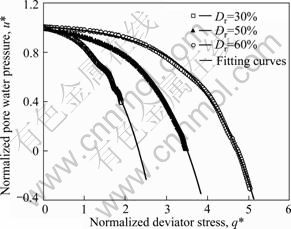
Fig. 12 Fitting results of normalized pore water pressure under different relative densities
Based on the results of Table 2, the fitting parameters n and t can be determined by relative densities Dr and effective confining pressures �ҡ�0 as
 (6)
(6)
5.3 Verification of dissipation model of pore water pressure
Another two tests are used to verify the applicability of the dissipation model of pore water pressure, which are Dr=0.4, �ҡ�0=150 kPa and Dr=0.55, �ҡ�0=250 kPa. The tested and predicted curves of normalized pore water pressure and deviator stress are shown in Fig. 13. It can be found that the results of the experiment generally tally with the predicted analyses. This means that the dissipation model of pore water pressure has good applicability.
Table 2 Values of fitting parameters under different test conditions
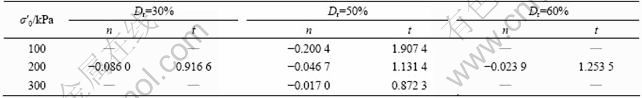
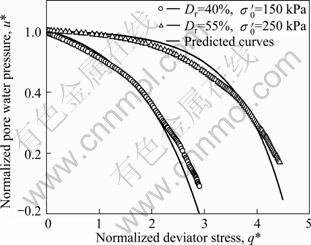
Fig. 13 Comparison of tested and predicted curves of normalized pore water pressure
6 Conclusions
1) The stress-strain response and the dissipation process of pore water pressure are composed of three stages, including the low intensive strength stage, the superlinear strength recovery stage and the sublinear strength recovery stage, and the demarcation points of the curve of pore water pressure are lag behind those of the stress-strain response.
2) The behaviour of large post-liquefaction deformation in saturated sand-gravel composites and Nanjing fine sand are different. Compared with Nanjing fine sand, the low intensive strength stage and the superlinear strength recovery stage of sand-gravel composites are very short, while the sublinear strength recovery stage appears longer.
3) A stress-strain model and a dissipation model of excess pore water pressure of liquefied sand-gravel composites are established, in which the initial confining pressure and the relative density can be considered synthetically. The predicted results by the two models are in good agreement with experimental data.
References
[1] HAMADA M, TOWHATA I, YASUDA S, ISOYAMA R. Study on permanent ground displacements induced by seismic liquefaction [J]. Computers and Geotechnics, 1987, 4(4): 197-220.
[2] TOHNO I, SHAMOTO Y. Liquefaction damage to the ground during the 1983 Nihonkai-Chubu Earthquake in Akita prefecture [J]. Natural Disaster Science, 1985, 7(2): 67-93.
[3] TOHNO I, SHAMOTO Y. Liquefaction damage to the ground during the 1983 Nihonkai-Chubu Earthquake in Aomori prefecture [J]. Natural Disaster Science, 1986, 8(1): 85-116.
[4] HAMADA M, ISOYAMA R, WAKAMATSU K. Liquefaction- induced ground displacement and its related damage to lifeline facilities [J]. Soils and Foundations, 1996, (Special Issue): 81-97.
[5] SHAMOTO Y, ZHANG Jian-min, GOTO S. Mechanisms of large post-liquefaction deformation in saturated sand [J]. Soils and Foundations, 1997, 37(2): 71�C80.
[6] HAMADA M, YASUDA S, ISOYAMA R. Observation of permanent displacements induced by soil liquefaction [J]. Proceedings of Japan Society of Civil Engineers, 1986, 3(6): 211-220.
[7] TOKIMATSU K, SEED H B. Evaluation of settlements in sands due to earthquake shaking [J]. Journal of the Geotechnical Engineering Division, ASCE, 1987, 113(8): 861-878.
[8] ISHIHARA K, YOSHIMINE M. Evaluation of settlements in sand deposits following liquefaction during earthquakes [J]. Soils and Foundations, 1992, 32(1): 173-188.
[9] TOWHATA I, SASAKI Y, TOKIDA K, MATSUOKA H, TAMARI Y, YAMADA K. Prediction of permanent displacement of lique?ed ground by means of minimum energy principle [J]. Soils and Foundations, 1992, 32(3): 97�C116.
[10] BARTLETT S F, YOUD T L. Empirical prediction of liquefaction induced later spread [J]. Journal of Geotechnical and Geoenvironmental Engineering, ASCE, 1995, 121(4): 316-329.
[11] YASUDA S, YOSHIDA N, MASUDA T. Stress-strain relationship of liquefaction sands [C]// Earthquake Geotechnical Engineering. Rotterdam: Balkema, 1995: 811-816.
[12] LIU Han-long, ZHOU Yun-dong, GAO Yu-feng. Study on the behaviour of large ground displacement of sand due to seismic liquefaction [J]. Chinese Journal of Geotechnical Engineering, 2002, 24(2): 142�C146. (in Chinese)
[13] ZHANG Jian-min, WANG Gang. A constitutive model for evaluating small to large cyclic strains of saturated sand during liquefaction process [J]. Chinese Journal of Geotechnical Engineering, 2004, 26(4): 546-552.
[14] WANG Yan-li, WANG Yong. Experimental study on strength and deformation characteristics of saturated sand after liquefaction [J]. Journal of Hydralic Engineering, 2009, 39(6): 667-672. (in Chinese)
[15] XU Bing, KONG Xian-jing, ZOU De-gao, et al. Laboratory study on behaviour of static properties of saturated sand-gravel after liquefaction [J]. Chinese Journal of Geotechnical Engineering, 2007, 29(1): 103-106. (in Chinese)
[16] ZOU De-gao, XU Bing, KONG Xian-jing. Study on the stress-strain relation of liquefied saturated sand-gravel composites and method of parameter identification [J]. China Civil Engineering Journal, 2009, 42(5): 117-124. (in Chinese)
(Edited HE Yun-bin)
Foundation item: Project(90715018) supported by the National Natural Science Foundation of China; Project(200808022) supported by the Special Fund for the Commonweal Industry of China; Project(08KJA560001) supported by the Key Basic Research Program of Natural Science of University in Jiangsu Province; Project(CX10B_170Z) supported by the Postgraduate Scientific Innovation Program in Jiangsu Province, China
Received date: 2011-02-18; Accepted date: 2011-04-22
Corresponding author: CHEN Guo-xing, Professor; Tel: +86-25-83239595; E-mail: gxc6307@126.com
Abstract: The laboratory tests on the post-liquefaction deformation of saturated sand-gravel composites were performed to investigate the characteristics of stress-strain relation and the dissipation of pore water pressure by the hollow cylinder apparatus. It is found that the stress-strain response and the dissipation process of pore water pressure are composed of three stages, including the low intensive strength stage, the superlinear strength recovery stage and the sublinear strength recovery stage, and the demarcation points of the curve of pore water pressure are lag behind those of the stress-strain response. The comparison results of the behaviour of large post-liquefaction deformation between saturated sand-gravel composites and Nanjing fine sand show that the low intensive strength stage and the superlinear strength recovery stage of saturated sand-gravel composites are shorter while the sublinear strength recovery stage is longer. A stress-strain model and a dissipation model of excess pore water pressure of liquefied sand-gravel composites are established, in which the initial confining pressure and the relative density can be considered synthetically. And it is found that the predicted results by the two models are in good agreement with experimental data.
