
Article ID: 1003-6326(2005)06-1356-05
Semiconducting of nanocrystalline tin oxide and
its influence factors
LI Li-li(������), DUAN Xue-chen(��ѧ��)
(School of Materials Science and Engineering, Central South University,
Changsha 410083, China)
Abstract:
A series of nanocrystalline SnO2 powders, doped with different Sb contents, were synthesized by route of alkoxides hydrolysis using SnCl4��5H2O and SbCl3 as starting materials and calcined at different temperatures. The microstructure and morphology of samples are investigated by XRD and TEM, the valence state changes of Sb in SnO2 crystal lattice is detected by M��ssbauer spectroscopy and XPS.The resistivity of powders is examined with a mould of inside diameter d=10mm at a constant pressure. The results show that lightly-doping Sb is effective means of semiconducting of nanocrystalline SnO2. The ratio of Sb5+ to Sb3+ decreases with increasing Sb content in SnO2 crystal lattices and calcination temperature. The XPS diffraction confirms the same result as M��ssbauer spectroscopy.
Key words:
tin oxide; doping; M��ssbauer spectroscopy; XPS CLC;
number: TQ134.3 Document code: A
1 INTRODUCTION
SnO2 has non-stoichiometric structure and its conductivity critically originates from oxygen vacancies in itself, but the content of oxygen vacancies in materials is usually difficult to control. Doped SnO2 with Sb, Mo and F is often available for applications to various areas such as displays, electrochromic windows, gas sensors, catalysts, rechargeable Li batteries and optical electronic devices[1-7]. Specially Sb is the best dopant, because SnO2 is of the preferable conductivity and transparency in visible light wavelength range after doped with Sb[4, 8, 9].
According to semiconductor physics it is well known that the conductivity of SnO2 depends on the concentration of charge carries and their mobility in the case of Sb doping. The concentration and mobility of charge carries depend respectively on the content of Sb and scattering of charge carries in crystal lattice of SnO2. If Sb exists in form of Sb2O3, SnO2 doped with Sb should be a P-type semiconductor. But the measurements of Hall mobility confirms that SnO2 doped with Sb is a N-type semiconductor. This problem has been studied in many literatures to explain the above phenomena, where two species of Sb valence state exist in crystal lattice of SnO2 doped with Sb which transform to each other under different condition[10, 11]. Despite the clear knowledge about coexisting of Sb3+ and Sb5+ in crystal lattice of SnO2 doped with Sb, there still exists uncertainties of semiconducting mechanism of SnO2 and its effect factors yet, specially the transforming rule of Sb valence state. The advantages of the route of alkoxides hydrolysis is that doping Sb is incorporated homogeneously into crystal lattice of SnO2, and the synthesized materials by the method of alkoxides hydrolysis will provide more precise information of valence state about Sb in crystal lattice of SnO2 than these by mechanical mixture methods. The aim of this work is to investigate semiconduting mechanism and its influence factors of nanocrystalline SnO2 powder synthesized by alkoxides hydrolysis.
2 EXPERIMENTAL
2.1 Synthesis of nanocrystalline SnO2 doped with Sb
All the chemical reagents used in the experiments were of analytical grade, they were SnCl4��5H2O, SbCl3, isopropyl alcohol [(CH3)2CHOH], ammonia (NH4OH). Ration SnCl4��5H2O and SbCl3 were dissolved in 300mL isopropyl alcohol respectively according to 1%, 3%, 7%, 12% and 17%(mole fraction) Sb and solution was reflowed and stirred at 78�� for 16h. The solution was centrifuged and the white solid precipitates was removed. Transparent Sn alkoxides was hydrolyzed at 60�� using 1mol/L ammonia as additive agent till the pH value of final solution is 3.0. At this point the heater was turned off and the solution obtained was stirred continuously for 2h. The sol was aged for 72h at room temperature, washed with deionized water, and dried in an oven at 80�� for 10h. The dry sol was ground and sol powders was calcined in an open ceramic crucible at different temperature respectively for 2h in atmosphere. Blue SnO2 doped with Sb powders was obtained after ground.
2.2 Analysis of XRD, M��ssbauer spectroscope, XPS and resistivity
Powder XRD data was carried out with a Rigaku D/max-RB diffractometer with CuK�� radiation (��=0.15418nm). The sample was scanned from 1.2�� to 10�� and 20�� to 80�� in step of 0.02��. The mean crystalline sizes of powders examined from XRD diffraction peaks based on the Scherre equation: D=k��/(��cos��), where D is mean crystallite sizes of powder; k is a constant, 0.89; �� is wavelength of X-ray; �� is diffraction angle and �� is the true half-peak width of diffraction peak. The 121Sb M��ssbauer spectroscope were recorded at 12K for detecting the oxidation state of Sb in the samples. XPS measurements were performed with the AlK�� line. The resolution of apparatus has been fixed to 0.5eV. The resistivity of powders was examined with a mould of inside diameter of 10mm at a constant pressure.
3 RESULTS AND DISCUSSION
3.1 Microstructure and resistivity of powders
Fig.1(a) shows the XRD patterns of the samples doped with different contents of Sb respectively and calcined at 600��. It shows that crystal structure of nanocrystalline SnO2 powders is a tetragonal rutile structure and no precipitates of Sb oxides is detected in the samples doped with 1%-12% Sb(mole fraction, the same below). But the diffraction peak of Sb2O3 is found in the samples doped with 17%Sb. The solubility of Sb in SnO2 is less than 17%, doping elements Sb replaces tin ions in the SnO2 lattice and the powders become a substitutive solid solution. Diffraction lines are considerably broadened with increasing Sb content, and the line broadening indicates that the mean crystalline sizes of powders reduces after doped with Sb. The average crystalline sizes of powders doped with 1%, 3%, 7%, 12% and 17% Sb which are calculated from XRD diffraction peaks based on the Scherre equation are respectively 15.4, 9.3, 7.2, 6.6 and 8.9nm. Fig.1(b) shows XRD patterns of the samples doped with 3% Sb which is calcined at different temperatures respectively. At 100 and 300�� the degree of powders crystallization is incompleteness and the diffraction peaks are not sharp. Up to 600�� diffraction lines are narrowed with increasing calcinations temperature, which indicates the increasing crystalline sizes of powders calcined at higher temperature. The average crystalline sizes of powders calcined at 600, 900 and 1200�� which are calculated from XRD diffraction peaks based on the Scherre equation are 12.5, 28.7 and 42.3nm. This results correspond to that of TEM as shown in Fig.2, which shows that the mean crystalline sizes of powders increase with increasing calcinations temperature.
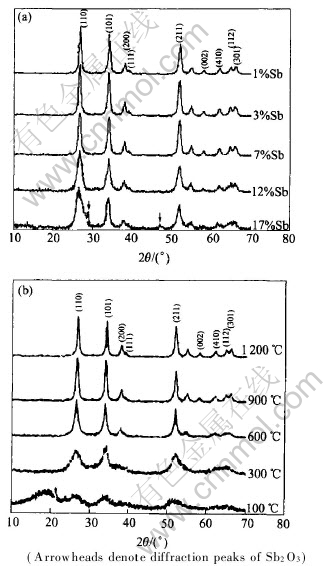
Fig.1 XRD patterns of nanocrystalline SnO2 samples (a) doped with different mole fraction of Sb samples calcined at 600��, and SnO2 sample with 3% Sb calcined at different temperatures

Fig.2 TEM images of ATO nanocrystalline calcined at 600��(a) and 1200��(b)
Fig.3 shows the dependence of resistivity of powders on Sb content and calcination temperature. They reveal that resistivity of powders decreases with increasing Sb content in lightly-doping range and at a Sb content of 3.5% it reaches a minimum, whereafter it begins to increase with increasing Sb content in heavily-doping range. The resistivity of powders doped with 3% Sb decreases with increasing calcination temperature and reaches a minimum at about 600��, then increases with increasing calcinations temperature. These changes are related to changes of valence state of Sb in crystal lattice of SnO2[12, 13].
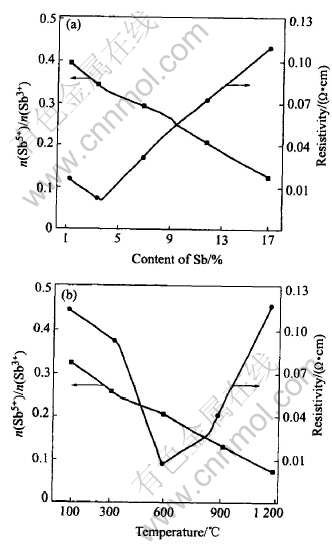
Fig.3 Dependence of resistivity on Sb content and calcination temperature
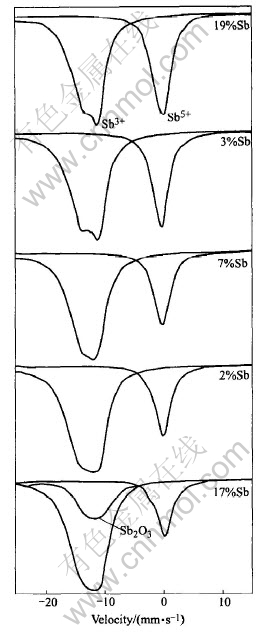
Fig.4 121Sb M��ssbauer spectroscope patterns of samples doped with different mole fractions of Sb
3.2 Changes of Sb valence state and relation with resistivity of powders
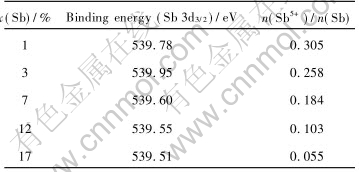
Fig.4 shows 121Sb M��ssbauer spectroscope patterns of samples doped with different Sb content, there are broad asymmetric peaks at around 12mm/s and narrow symmetric peaks at 0mm/s in spectroscope patterns, they correspond respectively to Sb3+ and Sb5+. The mole ratio of each valence state is equal to the peak area ratio of its curve in M��ssbauer spectroscope. Based on relative areas of both peaks, the mole ratio of Sb5+ to Sb3+ in samples with different Sb contents are calculated respectively, relation curve of the Sb5+ to Sb3+and Sb content are presented in Fig.3. It shows that the values of the mole ratio of Sb5+ to Sb3+ decreases with increasing Sb content. The values of the mole ratio of Sb5+ to Sb3+ in lightly-doped range is larger than that in heavily-doped range, where there is no inflexion in the curve. But there is a inflexion in Fig.3 for the resistivity dependence of Sb content, the resistivity of powders has a minimum values. If we take the relative content of Sb5+ and absolute content of donor in crystal lattice of SnO2 into account, this difference can be explained by two reasons: firstly, although the values of the mole ratio of Sb5+ to Sb3+ in lightly-doping range is larger than that in heavily-doping range, the absolute content of donors which originates from Sb5+ is low due to low Sb content and the resistivity of samples is relatively large. With increasing Sb content the absolute content of donors increases and the resistivity of samples decreases; secondly the larger the Sb content is the less the values of the mole ratio of Sb5+ to Sb3+. The absolute content of donors which originates from Sb5+ does not increase as quickly as that of Sb3+. At the same time, that more Sb5+ is incorporated into crystal lattice of SnO2 causes malformation. The scatter of carrier is enhanced and its mobility is reduced. The appearance of resistivity minimum is due to the fact that the absolute content of donors originating from Sb5+ increases in lightly-doping range and the carrier is scattered by malformation of crystal lattice in heavily-doping range. It is Sb5+ that turns SnO2 into a semiconductor. So the SnO2 doped with Sb is a N-type semiconductor. The results of XPS measurements is shown in Table 1, which indicates that the Sb5+ and Sb3+contents in crystal lattice of SnO drop and rises as Sb content increases. It is in accord with that of M��ssbauer spectroscopy.
3.3 Effect of calcination temperature on valence state of Sb
Fig.5 shows the 121Sb M��ssbauer spectroscope patterns of doping 3%Sb samples calcined at different temperatures. There are still a broad asymmetric at around 12mm/s and narrow symmetric peaks at 0mm/s respectively for Sb5+and Sb3+ at all calcinating temperatures. The change of relative areas for two peaks can be detected from spectroscope patterns. In the same way content of the Sb5+ and Sb3+ is proportion to areas of two
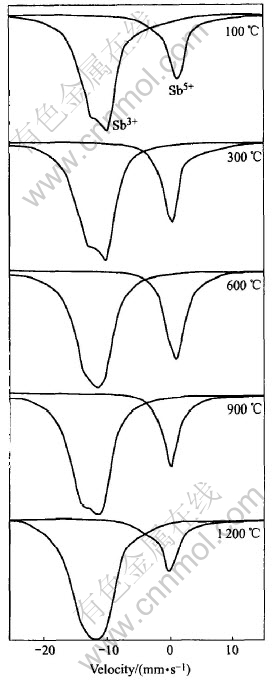
Fig.5 121Sb M��ssbauer spectroscope patterns of doping 3%Sb samples calcined at different temperatures
Table 1 XPS results of ATO samples doped with different Sb contents
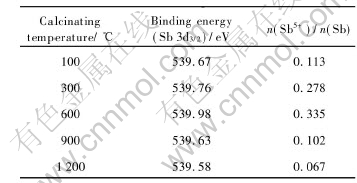
peaks[7, 14]. The values of the mole fraction of Sb5+ to Sb3+ based on relative areas of two peaks as a function of the calcinations temperature as shown in Fig.3, the ratio of the pentavalent and trivalent state of Sb decreases with the increasing calcinating temperature. That the reaction Sb5++2e= Sb3+ progresses toward the right-hand side leads the pentavalent state Sb to decrease and the trivalent state Sb to increase in crystal lattice of SnO2 when calcination temperature is elevated, despite there is more pentavalent state Sb at low calcinations temperature than at high calcinations temperature, the resistivity of samples is yet large because of incomplete crystallization for powders at low calcination temperature, which is testified in the XRD patterns of Fig.3. It is impossible for the pentavalent state Sb to be entirely incorporated into crystal lattice of SnO2 in the case of incomplete crystallization, so a low absolute amount of the pentavalent state Sb in crystal lattice of SnO2 leads to a higher resistivity. The higher the calcinations temperature the more complete the crystallization of samples, that more pentavalent state Sb exists in crystal lattice of SnO2 induces minimum values of resistivity up to 600��. At calcination temperature of 600-1200��, with complete crystallization of the samples, Sb segregation occurs as trivalent state Sb at the surface[8, 15], leading content of pentavalent state Sb in crystal lattice of SnO2 to drop and resistivity of the samples to rise. This implies that the distribution of Sb in samples is inhomogenous. The results of XPS are shown in Table 2 and accord with that of M��ssbauer spectroscopy. Sb5+ and Sb3+content in crystal lattice of SnO is to drop and rise as calcination temperature increases.
Table 2 XPS results of ATO samples calcined at different temperatures
REFERENCES
[1]ZHANG Jian-rong, GAO Lian. Synthesis of antimony- doped tin oxide(ATO) nanoparticles by the nitrate-citrate combustion method [J]. Materials Research Bulletin, 2004, 39: 2249-2255.
[2]Shukla S, Ludwig L, Parrish C, et al. Inverse-catalyst-effect observed for nanocrystalline-doped tin oxide sensor at lower operating temperatures [J]. Sensors and Actuators B, 2005, 104: 223-231.
[3]Wang Y, Lee J Y, Deivaraj T C. A microemulsion-based preparation of tin/tin oxide core/shell nanoparticles with particle size control [J]. Journal of Materials Chemistry, 2004, 14: 362-365.
[4]Sorescu M, Diamandescu L, Tarabasanu-Mihaila D, et al. Hydrothermal synthesis and structural characterization of (1-x) ��-Fe2O3-xSnO2 nanoparticles [J]. Journal of Physics and Chemistry of Solids, 2004, 65: 1021-1029.
[5]Shukla S, Patil S, Kuiry S C, et al. Synthesis and characterization of sol-gel derived nanocrystalline tin oxide thin films as hydrogen sensor [J]. Sensors and Actuators B, 2003, 96: 343-354.
[6]Sorescu M, Diamandescu L, Tarabasanu-Mihaila D, et al. Hydrothermal synthesis and structural characterization of (1-x) ��-Fe2O3-xSnO2 nanoparticles [J]. Journal of Physics and Chemistry of Solids, 2004, 65: 1021-1029.
[7]Cabot A, Dieguez A, Romano-Rodriguez A, et al. Influence of the catalytic introduction procedure on the nano-SnO2 gas sensor performances where and how stay the catalytic atoms? [J]. Sensors and Actuators B, 2001, 79: 98-106.
[8]Sun K, Liu J, Browning N D. Correlated atomic resolution microscopy and spectroscopy studies of Sn(Sb)O2 nanophase catalysts [J]. Journal of Catalysis, 2002, 205: 226-227.
[9]Ciriaco F, Cassidei L, Cacciatore M, et al. First principle study of processes modifying the conductivity of substoichiometric SnO2 based materials upon adsorption of CO from atmosphere [J]. Chemical Physics, 2004, 303: 55-61.
[10]Abello L, Bochu B, Gaskov A, et al. Structural characterization of nanocrystalline SnO2 by X-ray and raman spectroscopy [J]. Journal of Solid State Chemistry, 1998, 135: 78-85.
[11]ZHANG Jian-rong, GAO Lian. Synthesis and characterization of antimony-doped tin oxide(ATO) nanoparticles [J]. Inorganic Chemistry Communications, 2004, 7: 91-93.
[12]Koivula R, Harjula R, Lehto J. Structure and ion exchange properties of tin antimonates with various Sn and Sb contents [J]. Microporous and Mesoporous Materials, 2002, 55: 231-238.
[13]Jeon Y A, No K S, Choi S H, et al. Preparation and electrochemical characterization of size controlled SnO2-RuO2 composite powder for monolithic hybrid battery [J]. Electrochimica Acta, 2004, 50: 907-913.
[14]Szczuko D, Werner J, Oswald S, et al. XPS investigations of surface segregation of doping elements in SnO2 [J]. Applied Surface Science, 2001, 179: 301-306.
[15]Martinelli A, Ferretti M. Decomposition of (Sn2x-Fe1-xSb1-x)O4 solid solutions with x�Q0.5 [J]. Materials Research Bulletin, 2003, 38: 1629-1643.
(Edited by LONG Huai-zhong)
Foundation item: Project(2002AA302606) supported by the Hi-tech Research and Development Program of China
Received date: 2005-03-15; Accepted date: 2005-06-28
Correspondence: LI Li-li, PhD candidate; Tel: +86-731-8830503; E-mail: l911105@public.cs.hn.cn
