

Evaluation of stress concentration for planar tubular joints
M. F. GHANAMEH1, D.THEVENET2, A. ZEGHLOUL1
1. Laboratory of Mechanics and Physics of Materials - U.M.R. CNRS N�� 7554,
University of Metz, LPMM, 57045 Metz, France;
2. Laboratory of Mechanics of Naval Structures, ENSIETA, 29806 Brest, France
Received 10 April 2006; accepted 25 April 2006
Abstract:
In offshore tubular structures, a typical tubular joint may be subjected to three different types of basic loadings: axial, in-plane bending and out-of-plane bending, through its brace members. Each type will cause a different stress distribution at the joint intersection of structures. Moreover, the actual load condition of a tubular joint can be any combination of the above three basic load cases, for this reason, a combined loading was investigated in addition to these three basic loadings. This load is composed of an axial loading combined with a continuation of rotational bending loading obtained while rotate center of the brace around a circle. Different types of planar joints such as T, Y, X, K, DT, DY, DX, TY, TK, DTX, DTDY, and DTDK, with braces subjected to combined loading, were numerically analyzed to study the effect of those different cases of loading and different types of joints, on the stress concentration zone and values.
Key words:
welded tubular joints; finite element method; stress concentration; stress distribution; offshore platform;
1 Introduction
Tubular joints are commonly used in engineering structures and it is found that the fatigue failure of practical structures, in general, first occurs at the weld toe of the joints. For offshore structures, which are subjected to fatigue by wave loading, circular hollow sections are used almost exclusively due to their relatively smaller hydrodynamic loads and stress concentrations in joints.
Offshore structures consist of a large number of tubular members connected to one another by special joints. Tubular members are jointed together at their intersections in a variety of geometrical forms. These joints represent structural discontinuities, which incur a large amount of stress concentration. The stress concentration can produce a maximum stress at the intersection as high as thirty times the nominal stress acting in the members. The combination of high stress concentration with dynamic loads makes fatigue damage almost unavoidable. Because of these facts, the static and fatigue behavior of offshore tubular joints is the subject of considerable research and has been given special attention by many researchers [1�C6].
One of the most important purposes for offshore structure researchers is to maintain the structural integrity of these structures, which means to make an initial prediction about the safety of the structure over its lifespan and to plan inspections. So, it��s very useful to know previously the stress distribution around the weld toe and the stress concentration values and zones. Hence, the objectives of this study are as follows.
1) To study the behavior of tubular joints subjected to basic and combined loadings.
2) To determine the stress distribution profile for different types of planar tubular joint by proposing a new method of presenting the stress concentration results of finite element analysis of the offshore welded tubular joints. This method can easily and quickly show the stress distribution and the stress concentration zones around the brace/ chord intersection for different forms of planar tubular joints.
2 General details
2.1 Specifications of studied joints
The tubular joints used in the offshore platforms have relatively large dimensions and cannot be easily tested in laboratory on this scale. For this reason, reduced scale joints are proposed here. Initially, a single set of joint parameters was selected to perform analyses; the features selected to describe joint geometry were the following: D=2d=100 mm, L=700 mm, l=300 mm, ��=30��, 45�� and 60�� for all inclined braces and ��=90�� for all straight braces, and g=2 mm for the joints with two or three closed braces. These parameters were used to study the twelve forms of planar tubular joints (Fig.1): T-, Y-, X-, K-, DT-, DY-, DX-, TY-, TK-, DTX-, DTDY-, and DTDK-tubular joints.
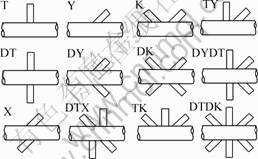
Fig.1 Scheme of studied joints
A tubular joint can be described by the use of some non-dimensional parameters ��, ��, ��, �� and �� in addition to the parameter ��. The parameters corresponding to the proposed joint dimensions are ��= 14, ��=0.5, ��=25, ��=1 and ��=0.02. The elastic modulus and Poisson��s ratio were respectively: E= 210 GPa and �� = 0.3.
2.2 Boundary conditions and loading
Tubular joints may be subjected to three types of basic loads through theirs braces: Ax, IPB and OPB loading. In the case of multi braces joints these loads can be balanced (symmetrical or anti-symmetrical loading). Fig.2 shows some examples of these loads.
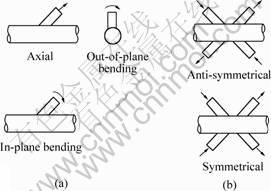
Fig.2 Basic loads for tubular joints(a) and balanced axial loading for DK-joints(b)
Each of the load types will cause a different stress distribution on the joint. Stress concentrations caused by the above three basic load cases have been extensively studied. LEE [7] investigated T and Y-joints subjected to single Ax, IPB and OPB loading and K and DT or X-joints subjected to balanced Ax, IPB and OPB loading. Whereas SOH and SOH [8] studied the three balanced loading applied on DT, K and TK-Joints; and LEE and BOWNESS [9] proposed two methods of balanced axial loading for DK-joints: symmetrical axial loading and anti-symmetrical axial loading. The actual loading conditions on a tubular joint, however, are any combination of the three basic load cases. For this reason the combined loading was investigated in addition to the three simple loading types (Ax, IPB and OPB loading). This combined loading is composed of an axial loading (tension or compression) and a continuation of combined bending (rotational bending) obtained while rotating the center of the brace around a circle in 36 steps. Moreover, the two ends of the chord are fixed in all cases of loading.
The different modes of loading are shown in Fig.3 for four joint types. However, they represent all the other joint type because of the geometrical similarly of the other joint types.
3 Finite element modelling
One of the key parts in a finite element analysis (FEA) is the mesh generation, since a high quality mesh is required for successful analysis. There are many commercial modeling programs available for creating FE models such as ABAQUS [10], I-DEAS [11] and ANSYS [12]. In this study, the FE package ABAQUS was used to perform the numerical analysis. This decision was based primarily on the degree of automation that was possible for mesh generation, model solution, and extraction of results. The finite element model proposed and validated in previous study [13, 14] (illustrated in Fig.4), was used to perform the analysis presented in this study.
4 Stress distribution
4.1 Maximum and minimum stress distribution curves
The distributions of local stresses along the intersecting lines (of T-joints for example) are indicated in Fig.5 for the three simple load cases and Fig.6 for the 36 combined loading steps, note that the limiting cases have been marked in thick lines as the angle of bending load is equal to 0��, 90��, 180�� and 270��.
From the stress distribution curves of the 36 steps of combined loading, two curves are plotted representing the maximum and minimum values of the group of curves. These curves are called respectively maximum Stress Distribution Curves (SDCmax) and minimum Stress Distribution Curves (SDCmin). The advantage of using these two curves is the ability to replace the curves resulting from 36 steps of combined loading with only one or two similar curves corresponding to different simple loading cases. This allows simple evaluation of the effect of the proposed combined loading on the stress concentration around the intersection chord/brace. Using these two curves makes it possible to determine the stress amplitude needed to calculate the fatigue life.
4. 2 Stress distribution curves for simple loadings
Fig.5 shows the stress distribution at the chord/ brace intersection of the T-joint subjected to three simple loading cases as shown in Fig.3. The distribution curves are plotted starting from the chord crown toe positions along the counter clockwise direction. This figure
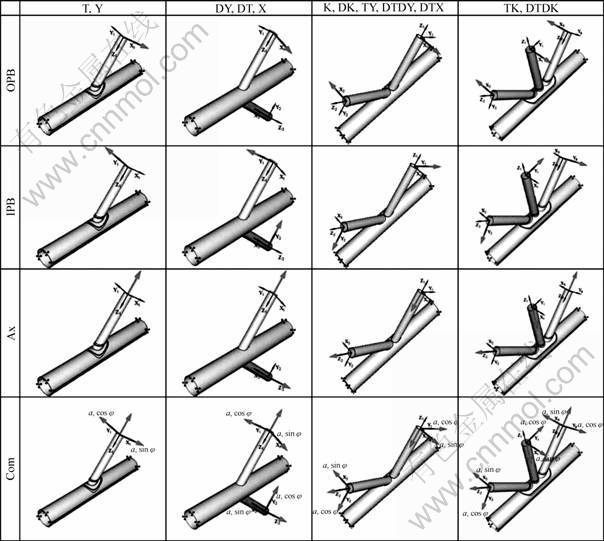
Fig.3 Various loading cases

Fig.4 Typical FE mesh used in this study
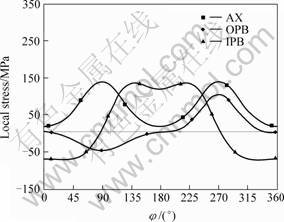
Fig.5 Stress distribution for T-joint in simple loading cases
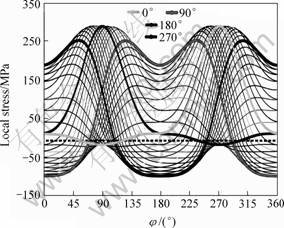
Fig.6 Stress distribution for T-joint in combined loading case
indicates that the ��hot spot�� stress for the chord is found to occur at the saddle location for Ax and OPB loading and it is found between saddle and crown locations for IPB loading, or at ��= 45�� with respect to the crown locations. This result is in good agreement with the results established by PANG and LEE [15].
Studying the other joint configurations gives the same results for DT-joint with a little increase of stress concentration values. When the Y-joints brace are subjected to Ax or OPB loading (Figs.7(a) and (b)), the ��hot spot�� stress locations move toward the heel area (crown heel point of ��=180��) with decreasing brace inclination from 90�� (case of T-joint) to 60�� then 45�� and 30��, regardless of the loading direction, whereas the ��hot spot�� stress locations move in the inverse direction of the loading direction if the brace subjected to IPB loading (Fig.7(c)).
The T-joint and Y-joint results subjected to Ax, IPB and OPB loading are shown in Fig.3. They can be generalized for all straight and inclined braces respectively unless there is another brace on the same side of chord such as DT, DY and X-joints.
For joints with two or more braces on the same side of chord and subjected especially to an anti symmetric balanced loading, the ��hot spot�� stress locations move toward the gap. This is the case for K-joints (Fig.8) and also DK, TY, DTDY, DTX, TK and DTDK-joints. Note that stresses in Fig.8 are calculated around the brace subjected to tensile loading.
For joints having more than one brace on the same side of the chord and one of them in straight position such as TY, DTDY, TK, DTK and DTX-joints, it is found that the maximum stress values are localized around the straight brace in the balanced IPB or OPB loading cases, and around the inclined brace subjected to a tension loading in the balanced AX loading case. It must be mentioned that the stress

Fig.7 Influence of parameter �� on Y-joint chord stress concentration around chord/brace intersection in Ax loading(a), OPB loading(b) and IPB loading(c)
values are higher in these joints group than that of joints having two inclined braces (such as K and DK-joints). As an example of this result, Fig.9 illustrates a comparison between K and TY-joints subjected to balanced IPB loading.
4.3 Stress distribution curves for combined loadings
The main purpose of this work is to study the behavior of different joint types subjected to combined loading approaching the true service conditions of the tubular elements in offshore structures.
From Fig.10, it seems that there is not a great

Fig.8 Influence of parameter �� on K-joint chord stress concentration around chord/brace intersection in Ax loading(a), IPB loading(b) and OPB loading(c)
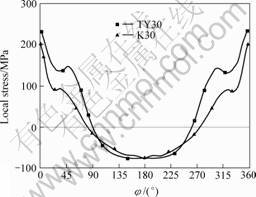
Fig.9 Stress distribution of balanced IPB loading for K and TY-joints (��=30��)
difference between DT-joint SDCmax and T-joint SDCmax. This result can be generalized for all other similar joints such as DY and X-joints compared to Y-joint, K-joint compared to DK-joint, DTX and DTDY-joints compared to TY-joint, and finally TK-joint compared to DTDK-joint.
The results concerning Y-joints show that the situation is quite different. In fact, the stress concentration value increases with increasing brace inclination (from ��=30�� to ��=60��) until it approaches the T-joint stress concentration value (Fig.11). It means that it is recommended to use the smaller brace inclination since it will decrease the stress concentration. This result is still valid for X and DY-joints as compared to the DT-joint (Figs.12 and 13) for ��=30�� or 45��. For ��=60�� it can be noted that the stress concentration is greater than that of the DT-joint.
Similar to the simple loading conditions, it appears that the stress concentration increases enormously for cases where there are two or more braces on the same side of chord which are speci-

Fig.10 Comparison between DT-joint SDCmax and T-joint SDCmax
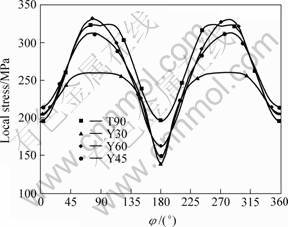
Fig.11 Comparison between T-joint SDCmax and Y-joint SDCmax

Fig.12 Comparison between DT-joint SDCmax and X-joint SDCmax
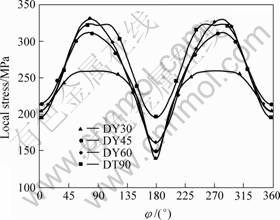
Fig.13 Comparison between DT-joint SDCmax and DY-joint SDCmax
fically subjected to an anti-symmetric balanced loading. Moreover, the ��hot spot�� stress locations move toward the gap area. Fig.14 shows a comparison between the stress distribution curves (SDC) of Y, TY, K, and TK-joints. From this figure, it is obvious that the stress concentration increases when another brace is added to the same side of chord (K-joints compared to Y-joints) especially if it is perpendicular to the chord (TY-joints compared to Y-joints) and it rises enormously when adding two braces (TK-joints compared to Y-joints).
4.4 Polar stress distribution curves
One of the objectives of this study is to formulate a simple method of evaluating the stress concentration around the intersection chord/brace. So, the stress distribution curves for the three simple loading cases and the SDCmax and SDCmin curves were plotted in polar coordinates as it is shown in Fig.15. This representation gives a very clear image of the stress concentration state and the effect of each loading type on the location and

Fig.14 Comparison between SDCs of Y, TY, K, TK-joints
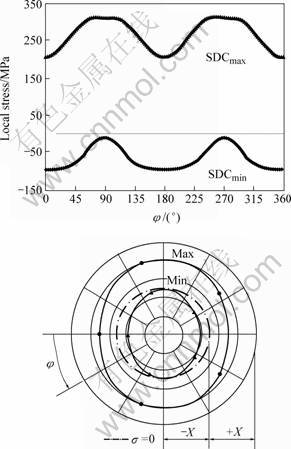
Fig.15 Polar stress distribution curves for T-joint in combined loading case
the value of this concentration around the chord/brace intersection.
Fig.16 shows the polar stress distribution curves for different loading types applied to T-joint. By using these curves, it is possible to determine quickly and easily positions of hot spot points corresponding to each type of loading. This figure highlights the fact that the combination of loadings will raise the ��hot spot�� stress values to two times, compared to the case of simple loadings. This stress is found to occur at the saddle location for Com loading and for combination of Ax and OPB loading. It is found at ��= 45�� with respect to the crown locations for combination of Ax and IPB loading. The ��hot spot�� stress locations in the Y-joints move toward the crown heel point (��=��) with decreasing brace inclination from 90�� (T-joint) to 60�� then 45�� and 30��; if the brace subjected to Ax or OPB loading, regardless of the loading direction, whereas the ��hot spot�� stress locations move in the inverse direction of the loading direction if the brace subjected to IPB loading.
The examination of the polar stress distribution curves relating to the various joints reveals two models of stress distributions (Fig.17).
Model 1: Corresponding to the stress distribution of T-, Y-, DT-, DY- and X-joints where there is only one brace on each side of chord.
Model 2: Corresponding to the stress distribution of the K-, TK-, DX-, TY-, DTDY-, DTDK- and DTX-joints where there are at least two braces located on the same side of the chord. In this case of joints, we obtain several shapes of curves according to the brace and its position and the direction of the axial loading applied.
Fig.17 illustrates these two models, since it gives the polar stress distribution curves for Y-joints (example of model 1) and TK-joints (example of model 2). In this figure, because of the geometrical symmetry in the multi-brace joints, only the polar stress distribution curves corresponding to the braces of one side of chord are considered. For DTDK, DTDY, DTX, DTX, DX, TK, TY and K joints, the polar stress distribution curves correspond to the braces where the strongest stress concentration appears.
In the cases of TY-, DTDY-, TK-, DTDK- and DTX-joints, containing at least two braces (one in straight position and the other inclined) in the same side of the chord and subjected to a loading balanced FDP or FHP, the maximum values of constraint are obtained around the straight brace. On the other hand, in the
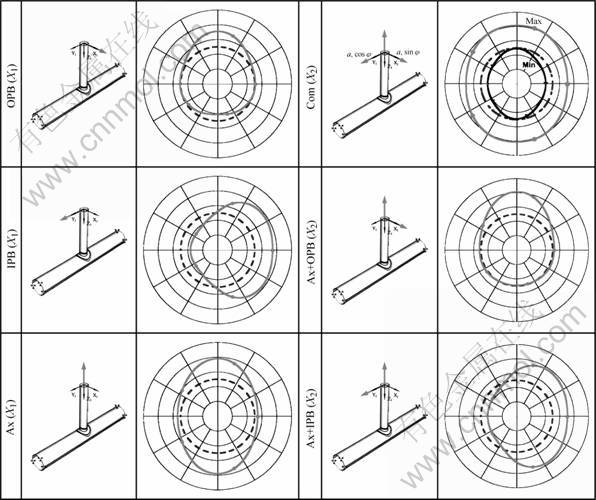
Fig.16 Polar stress distribution curves for different loading types applied to T-joint (Scale: X1=250 MPa, X2=500 MPa, X3=750 MPa)
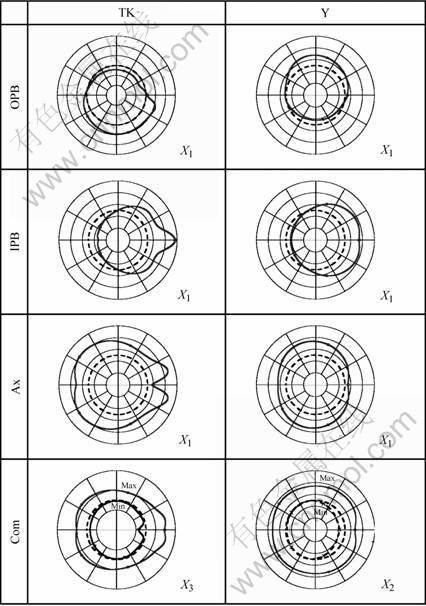
Fig.17 Comparison of various types of stress distribution for TK- and Y-joints (Scale: X1=250 MPa, X2=500 MPa, X3=750 MPa)
case of balanced axial loading or Com loading, the maximum values of constraint appear around the inclined brace (Fig.18). Moreover, the levels of constraint relating to this group of junctions are higher than those observed in the junctions K and DK, where the two braces located in the same side of the chord, are inclined.
5 Conclusions
1) The tubular elements used to design offshore platforms are subjected to combined loading conditions. These loading conditions generate in the vicinity of the joints, hot-spot points or zones of strong stress concentration which often constitute sites for fatigue crack initiation and propagation. The determination of stresses at these hot-spot points by finite element analysis gives results in good agreement with literature for simple loading, which validates the modeling approach employed.
2) The proposed method for evaluating the stress concentration is useful for a quick estimation of the ��hot spot�� areas (where the stress concentration occurs) for different types of joints subjected to different loading cases. Specifically, the case of combined loading simulating true loading of tubular elements of offshore structures has been studied, which is very important for manufacturing and testing operations.
3) Drawing the SDCmax and SDCmin curves helps to easily read the effect of this combined loading on the stress concentration around the chord/brace intersection, and moreover, to determine the stress amplitude. ?�� needed to calculate fatigue life.
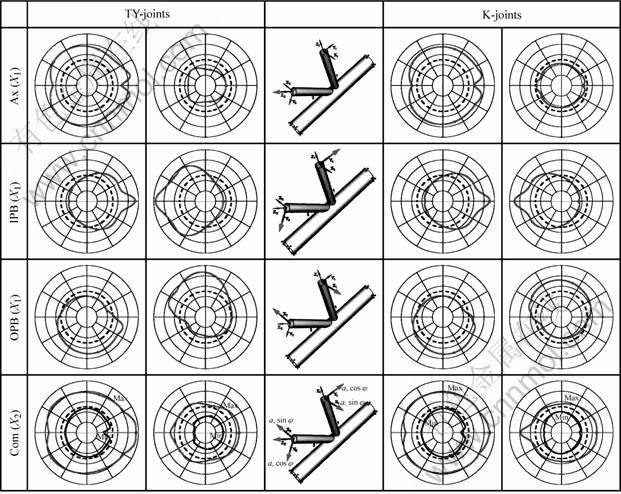
Fig.18 Two examples of junctions having several braces located on same chord side. K-joints: two inclined brace, TY-joints: one straight brace and one inclined brace (Scale: X1=250 MPa, X2=500 MPa)
Nomenclature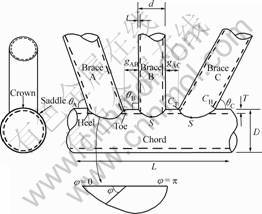
Principal points
C: Crown
S: Saddle
CT: Crown toe (For ��=0)
CH: Crown heel (For ��=��)
Chord dimensions
D: Chord diameter
T: Chord wall thickness
L: Chord length
Brace dimensions
d: Brace diameter
t: Brace wall thickness
l: Brace length
Joint parameters
��: Chord length parameter ��=2L/D
��: Diameter ratio ��=d/D
��: Chord thickness ratio ��=D/2T
��: Brace inclination angle
��: Wall thickness ratio ��=t/T
��: Angle measured around intersection
��: Gape parameter ��=g/D
g: Braces gap
Loading
IPB: In-plane bending
OPB: Out-of-plane bending
Ax: Axial
RB: Rotational bending
Com: Combination of Ax and RB
References
[1] HEALY B E, ZETTLEMOYER N. In-plane bending strength of circular tubular joints [A]. Proceeding of the 5th International Symposium on Tubular Structures [C]. Nottingham, UK, 1993. 325-344.
[2] WARD J K, BILLINGTON C J. Strength assessment of a multi-planar joint in a north sea jacket structure [A]. The Proceeding of the Second International Offshore and Polar Engineering Conference [C]. San Francisco, 1992. 369-376.
[3] WILMSHURST S R, LEE M M K. Ultimate capacity of axially loaded multi-planer double K-joints in circular hollow section [A]. Proceeding of the 5th International Symposium on Tubular Structures [C]. Nottingham , UK, 1993. 712-719.
[4] CAO J, YANG G, PACKER J A. FE mesh generation for circular joints with or without cracks [A]. The Proceeding of the 7th International Offshore and Polar Engineering Conference [C]. USA, 1997. 98-105.
[5] CHIEW S P, SOH C K. Strain concentra tions at intersection regions of a multiplanar tubular DX-joint [J]. Journal of Constructional Steel Research, 2000, 53(2): 225-244.
[6] GANDHI P, RAMACHANDRA MURTHY D S, RAGHAVA G, MADHAVA RAO A G. Fatigue crack growth in stiffened steel tubular joints in seawater environment [J]. Engineering Structures, 2000, 22(10): 1390-1401.
[7] LEE M M K. Estimation of stress concentrations in single-sided welds in offshore tubular joints [J]. International Journal of Fatigue, 1999, 21(9): 895-908.
[8] SOH A K, SOH C K. ��Hot spot�� stresses of K tubular joints subjected to combined loadings [J]. Journal of Constructional Steel Research, 1993, 26(2-3): 125-140.
[9] LEE M M K, BOWNESS D. Estimation of stress intensity factor solutions for weld toe cracks in offshore tubular joints[J]. International Journal of Fatigue, 2002, 24(8): 861-875.
[10] ABAQUS. Hibbit, Karlsson & Sorenson Inc. ABAQUS/Standard User's Manual (Version 6.3 and 6.4). USA, 2003-2004.
[11] I-DEAS. SDRC. I-DEAS Master Series (11): User Manual[M]. Ohio, 2004.
[12] ANSYS. Swanson Analysis Systems Inc, ANSYS Release 8.1, Houston, TX, 2004.
[13] GHANAMEH M F, THEVENET D, ZEGHLOUL A. Stress concentration in offshore welded tubular joints subjected to combined loading[J]. Journal of Materials Science & Technology, 2004, 20(S1): 35-37.
[14] GHANAMEH M F, THEVENET D, ZEGHLOUL A. Effects of joint configuration and loading type on stress concentration in offshore welded tubular joints[A]. Advanced Problems in Mechanics[C]. St Petersburg, Russia. 2005.
[15] PANG H L J, LEE C W. Three-dimensional finite element analysis of a tubular T-joint under combined axial and bending loading[J]. International Journal of Fatigue, 1995, 17(5): 313-320.
Corresponding author: M. F. GHANAMEH; Tel: +33-387547005; Fax: +33-387315366; E-mail: ghanameh@univ-metz.fr
