
J. Cent. South Univ. (2016) 23: 1353-1362
DOI: 10.1007/s11771-016-3187-9

Assessing ability of a wet swale to manage road runoff: A case study in Hefei, China
TANG Ning-yuan(����Զ)1, LI Tian(����)1, GE Jun(���)2
1. State Key Laboratory of Pollution Control and Resource Reuse (Tongji University), Shanghai 200092, China;
2. The New Binhu Region Construction Investment Co. Ltd, Hefei 230601, China
 Central South University Press and Springer-Verlag Berlin Heidelberg 2016
Abstract:
The ability of a wet swale, constructed in an area of poor soil permeability, to manage runoff from a roadway was monitored through 27 storm events over a period of 8 months. During the monitoring period, the wet swale reduced the total runoff volume by 50.4% through exfiltration and evapotranspiration. The wet swale significantly decreased the influent pollutant concentrations, and the effluent mean concentrations of total suspended solids, total phosphorus, chemical oxygen demand, ammonium, oxidized nitrogen, and total nitrogen in the effluent were 31 mg/L, 0.10 mg/L, 29 mg/L, 0.52 mg/L, 0.35 mg/L and 1.28 mg/L, respectively. Pollutant loads were also substantially reduced from 70% to 85%. Plant uptake played an important role in nutrient removal in the wet swale. Approximately half of the nitrogen (53.8%) and phosphorus (51.5%) that entered the wet swale was incorporated in above-ground plants. It is shown that wet swales are useful for managing runoff from roads in areas of poor soil permeability.
Key words:
1 Introduction
Swales are specifically designed to attenuate and treat stormwater runoff from roadways. A wet swale has similar characteristics to a stormwater wetland, and is a broad open channel capable of temporarily storing stormwater runoff. Because they are generally constructed in areas where soil may be periodically inundated and may remain wet for a long time, wet swales are less common than grassed swales that are only used for runoff conveyance and typically remain dry after storm events through infiltration [1-7]. As such, there are fewer documented examples of field-scale monitoring of the performance of wet swales.
Wet swales studied in Florida [8] and in Washington [9] effectively removed total suspended solids (TSS), with reported removal efficiencies ranging from 67% to 81%. Significant variability in the nutrient removal was documented in related literature. HARPER [8] and WINSTON et al [10] reported that total nitrogen (TN) in highway runoff was reduced by 40% by the wet swales. However, KOON [9] observed that there was little nitrogen removal in the wet swale. Wet swales can also remove a proportion of the phosphorus in runoff, and reductions in total phosphorus (TP) ranging from 17% to 39% have been reported [8-9]. Because of either phosphorus leaching from media or decomposition of vegetation debris, phosphorus was exported from one of the two monitored wet swales [10].
To date, few published data exist on the effectiveness of field scale wet swales in quantifying the water quality performance and hydraulic performance under actual working conditions. Besides, the investigation of pollutant removal mechanism also lacked in wet swales field monitoring studies. Therefore, some effort should be directed at characterizing the water quality improvements and hydraulic performance that are possible with a wet swale. In this work, we assessed the performance of a full-scale wet swale in an area of clay soil to provide reference data for future wet swale design and management.
2 Methods
2.1 Site description
The study site was a wet swale on Luzhou Road, an eight-lane highway in Hefei, Anhui Province, China (Fig. 1(a)). The wet swale was constructed in 2010 and was 120 m long. It was planted with a mix of 90% Typha latifolia linn and 10% Scirpus validus, and about half of the area of the swale was vegetated. Two check dams were installed along the flow direction in the wet swale, and the wet swale was divided into three cells of equal area. The wet swale had a rectangular cross section (Fig. 1(b)); it was 13 m wide and had a longitudinal slope of approximately 1%. Soil in the swale was native, and, based on the United States Department of Agriculture (USDA) soil classification, was silty clay. The soil had poor permeability and the region around the wet swale had a perched water table that was 0.9�C1.5 m below the soil surface.
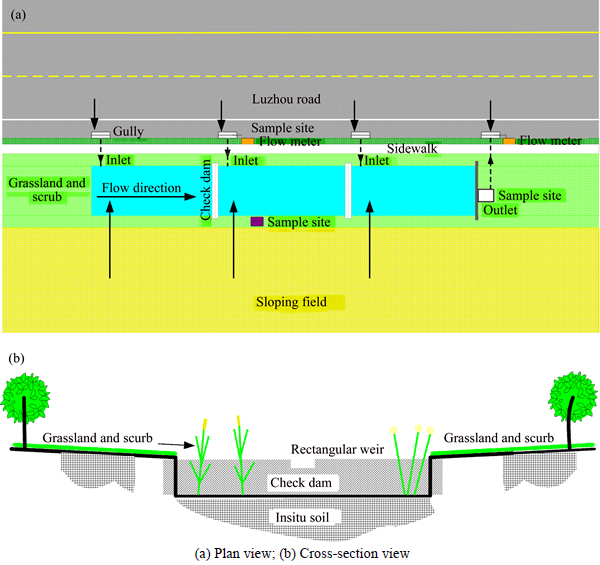
Fig. 1 Diagram of wet swale by Luzhou Road:
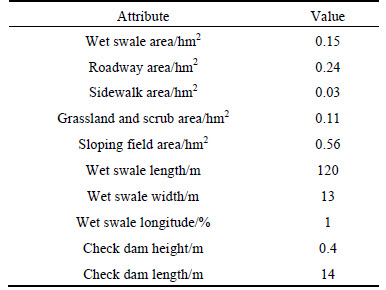
The wet swale received runoff from the roadway and was surrounded by pervious grassland and scrub. Runoff from the four lanes was collected by curbside gullies and drained to the three cells of the wet swale through a 300 mm diameter PVC pipes. Over the monitoring period, there was no obvious runoff from either the sidewalk (part of which was permeable) or the surrounding area of pervious grassland and scrub. Sloping fields, comprised of piled-up excavated soil, had developed close to the swale as a result of construction activities. Because some parts of the sloping fields were not covered by grass, large quantities of soil particles were washed out by runoff during heavy storm events, and entered the swale cells. The effluent from the wet swale was discharged to a storm sewer under the road through a 300 mm diameter PVC pipe. Sampling of the wet swale occurred between April 2012 and November 2012, during which a total of 27 storm events were monitored. The design characteristics of the wet swale are given in Table 1.
Table 1 Design characteristics of wet swale
2.2 Sampling program
Two NIVUS PCMF velocity-area flow meters (NIVUS Group, Germany) were installed in the wet swale, one in the swale inlet pipes and the other at the outlet pipe, to monitor flows. Because the gullies along the road had the same drainage area and cross slope, we assumed that the amount and quality of water introduced to each cell of the wet swale were similar. Thus, influent was only monitored and sampled in one of the wet swale cells. Flow data were recorded at 1 min intervals. Samples of influent from the roadway and effluent from the wet swale were collected at 15-60 min intervals over sampling periods between 2 and 10 h. Samples of standing water were collected from the wet swale at regular intervals (every 1�C3 d, typically 3 d) between events, or after events (once events stopped).
Because of the challenge associated with measuring the runoff flow rate from the sloping fields, a hydrological model that used Infoworks CS (HR Wallingford Group, UK) was developed to calculate the surface runoff from the sloping field. The model parameters were calibrated using the observed hydrological data. During the monitoring period, we collected samples of runoff generated in the sloping fields through eight storm events. The overland runoff flow from these events was simulated using the calibrated model. Water samples were collected at 30 min intervals.
The cumulative rainfall on the surface of the wet swale was significant due to the large surface area of the swale and the low permeability of the swale soil. During the duration of rainfall events, a 300 mm diameter plastic pot was placed on the concrete pillar inserted in the grassland around the wet swale. The height between the bottom of plastic pot and the grassland was 1 m, therefore, the solids in grassland splashed by the rainfall did not fall into the plastic pot. The rainfall samples from eight events were collected for further analysis.
The water level of the standing water in each swale cell was recorded daily by staff gauges inserted in the swale soil. The elevation of the water level at each monitoring point was determined by a water level gauge, based on the vertical control point in the roadway. The standing water depth and the water level drawdown rate were calculated from the water level data. Both the standing water depth and the water level drawdown rate were used to determine evapotranspiration and exfiltration.
A SL3-1A tipping bucket rain gauge (Shanghai Meteorological Instrument Factory Co. Ltd., Shanghai, China) with a sensitivity of 0.1 mm was installed on top of a nearby building and the rainfall depth was recorded at 1 min increments.
2.3 Vegetation and soil
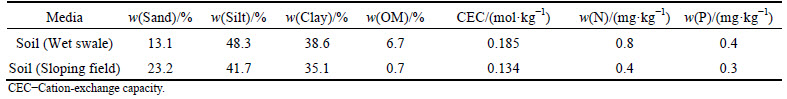
Vegetation samples were harvested from the wet swale on 11 October 2012 to evaluate the contribution of plant uptake to nutrient removal. Plants were randomly collected from 1 m2 area [11]. To ensure regrowth in the following growing season, only above-ground biomass was collected. Plant samples were rinsed and dried to a constant mass at 80 ��C for 24 h. Plant samples were chopped finely and ground to <0.1 mm with a metal-free mill before analysis. Soil samples were collected from 0 to 10 cm depth in wet swale and sloping field, and were dried and sieved (<2 mm). The physical and chemical characteristics of soil samples were analyzed [12], as given in Table 2.
2.4 Analysis methods
Water samples except for rainfall samples were analyzed by standard methods for TSS, TP, total dissolved phosphorous (TDP), chemical oxygen demand (COD), dissolved COD, TN, ammonium  -N), oxidized nitrogen
  -N, composed of nitrite and nitrate), and total dissolved nitrogen (TDN) [13]. Rainfall samples were only analyzed for TP, TN,
 and
and  Particulate nitrogen was calculated by subtracting TDN from TN. Organic nitrogen (ON) was calculated by subtracting
  -N and
  -N from TN. Samples were filtered with 0.45 ��m disposable filters before analysis for dissolved pollutants. Due to the low pollutant concentrations in direct rainfall, the rainfall samples were not diluted and analyzed directly. The nitrogen content of plant samples was determined using a Macro Elemental Analyser (VARIO MACRO, Elementar Analysensysteme GmbH, Germany). After tri-acid digestion, the phosphorus content of plant samples was determined using a standard method.
2.5 Evaluation of hydrological and water quality data
Water depth and the water level drawdown rate duration curves were developed from the related measurements. These curves were used in this work to express the cumulative distribution of the water depth and the water level drawdown rate, and to demonstrate the cumulative duration or probability that was equal to or greater than a given water depth and water level drawdown rate.
Table 2 Physical and chemical characteristics of soil in wet swale and sloping field
The EMC values of the monitored pollutants for the influent and effluent were calculated using DAVIS��s method [14]. The monitored influent and effluent pollutant loads were the sum of the loads from the individual storm events over the whole monitoring period.
Probability plots and water quality targets were used to evaluate swale performance [14]. An effluent pollutant concentration of 0 was used to represent an event that produced no measurable effluent flow.
The accumulated mass of nutrients (PM) in each above-ground plant species in the wet swale was calculated by
 (1)
(1)
where PB is the dry biomass per m2; PC is the mean nitrogen and phosphorus content per kg in the plants above ground; S is the area of plants in the wet swale.
3 Results
3.1 Hydraulic performance
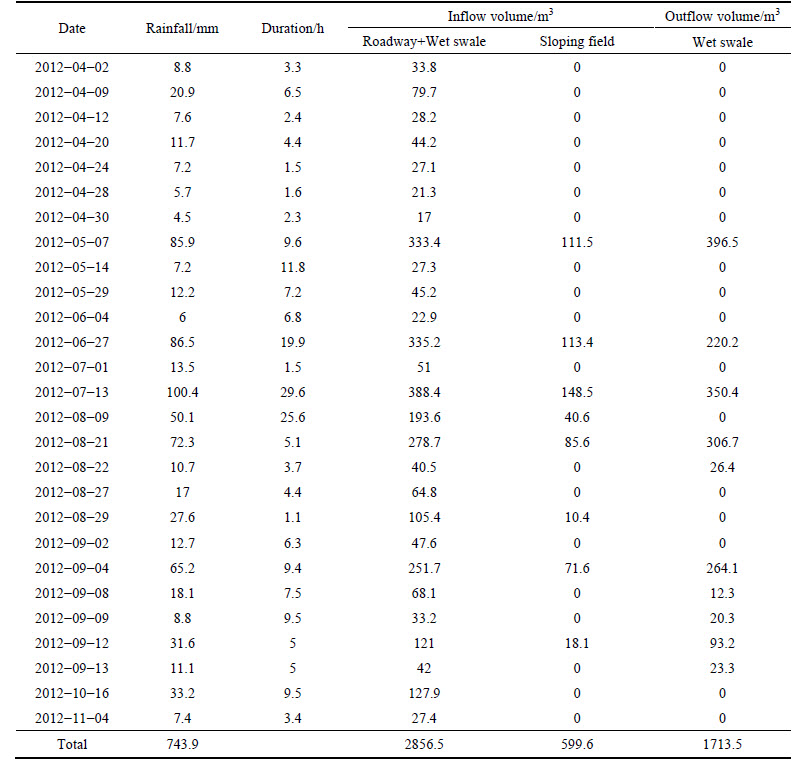
A total of 27 storm events were monitored (Table 3). Of the 27 storm events, 10 produced measurable discharge. The remaining events were completely retained in the swale and the accumulated water was either evapotranspired or exfiltrated between events. The runoff volumes from the roadway and the swale itself,including the sloping field, represented 82.7% and 17.3% of the total inflow volume, respectively.During the monitoring period, the wet swale reduced the total inflow volume by 50.4% through exfiltration and evapotranspiration.
The water level drawdown rate was lower than 1 cm/d for most of the monitoring period, and the exceedance duration was less than 25% (Fig. 2(b)). As a result, a standing water depth of approximately 14 cm was maintained in the swale cells most of the time, and the exceedance duration approached 90% (Fig. 2(a)). Further, some small storm events that followed the larger outflow-generating events also generated measurable outflow because of the relatively short interval between events (Table 3). These results suggested that evapotranspiration, exfiltration, and the interval between events were important factors that influenced the hydraulic performance of the wet swale.
Table 3 Summary of the inflow and outflow volumes of the wet swale during the monitoring period
3.2 Water quality control performance
3.2.1 Total suspended solids
The wet swale removed significant amounts of TSS from the roadway and sloping field runoff. Influent TSS EMCs ranged from 69 to 380 mg/L and from 220 to 600 mg/L for the roadway and sloping field, respectively, whereas the effluent TSS mean EMC was 31 mg/L, and ranged from 9 to 76 mg/L (Table 4). Probability plots (Fig. 3(a)) confirmed the successful removal of TSS, with TSS completely captured in 63% of events, and the remainder consistently below influent EMCs. We used an effluent discharge target value of 30 mg/L TSS to evaluate the efficacy of the wet swale. Relative to the influent TSS concentrations in runoff, the probability that this discharge target would be exceeded was reduced to about 17.0%.
TSS removal in the wet swale was first ascribed to the initial capture and retention of concentrated runoff and then to sedimentation and filtration by plants once the wet swale began to discharge. These treatment processes are clearly shown in a pollutograph (Fig. 4). The first flush of TSS in runoff from the roadway and sloping field was temporarily retained by the swale. In addition, the effluent discharged in the initial hours was mainly from the standing water, which had TSS concentrations between 8 and 15 mg/L. These processes greatly extended the hydraulic retention time of runoff in the wet swale, and promoted TSS removal. After discharge, TSS in standing water was removed by settling between events (Table 5).
3.2.2 Phosphorous
The wet swale removed moderate amounts of TP from roadway and sloping field runoff (Table 3). The class II threshold of the Environmental Quality Standards for Surface Waters (EQSSW) [15] for phosphorous is 0.1 mg/L. The exceedance probability for inputs was 100%, which was reduced to just 17% when the wet swale was used (Fig. 3(b)).
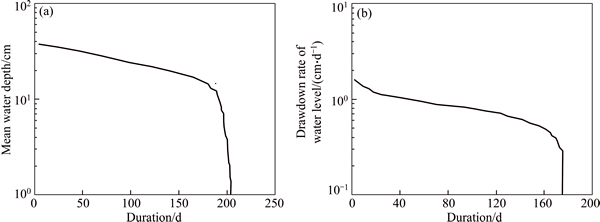
Fig. 2 Duration curves of mean water depth (a) and drawdown rate of water level (b) during monitoring period
Table 4 Mean EMC values for range of monitored pollutants through monitored storm events in wet swale (An effluent pollutant concentration of 0 was used to represent an event that produced no measurable effluent flow)
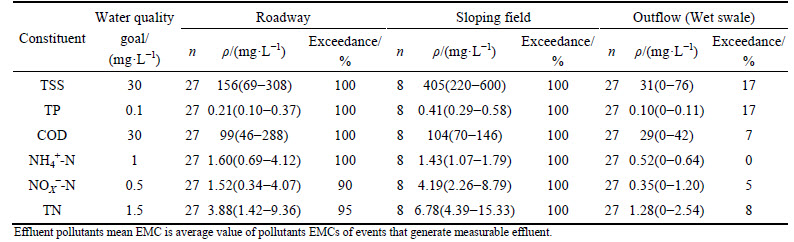
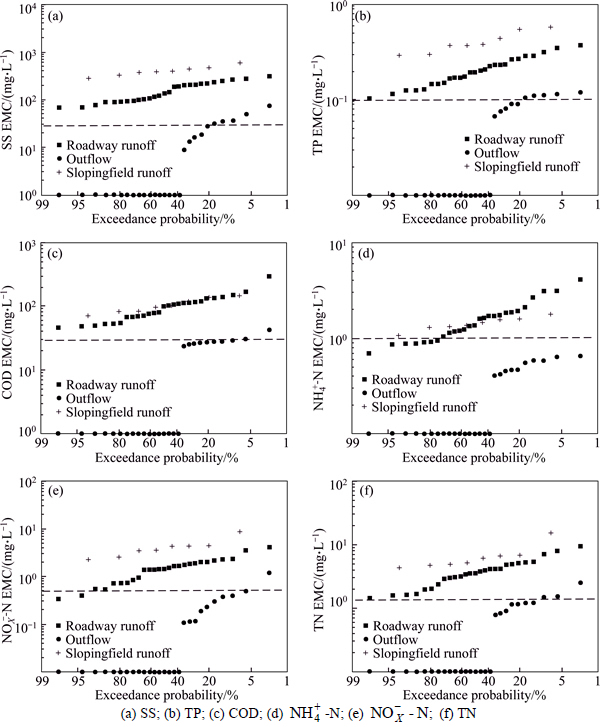
Fig. 3 Log normal probability plots of EMCs showing roadway runoff, sloping field runoff, and wet swale discharge (Dashed line represents selected water quality targets):
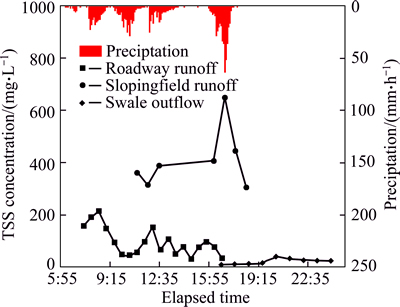
Fig. 4 Pollutograph of TSS showing measured concentrations during storm event on 2012-06-27
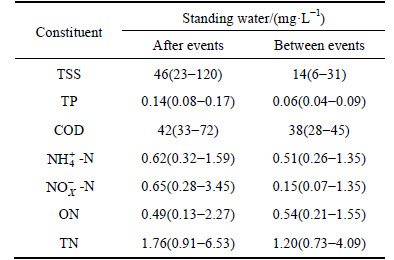
Table 5 Mean values and range of pollutant concentrations in standing water between and after events
Approximately 70%-90% of phosphorous in roadway and sloping field runoff was bound to particulates, and 10�C30% was in the dissolved form (Fig. 5(a)), which was consistent with the results reported by WU et al [16] and VAZE and CHIEW [17]. Most of the influent particulate bound phosphorous was removed by sedimentation in the wet swale. The dissolved phosphorous in the influent was also effectively removed through plant uptake and adsorption onto soil particles with high silt/clay content (Table 2) that were eroded and transported from the sloping field to the wet swale. More TP was removed from the standing water between events (Fig. 6(a), Table 5) via the pathways mentioned above.
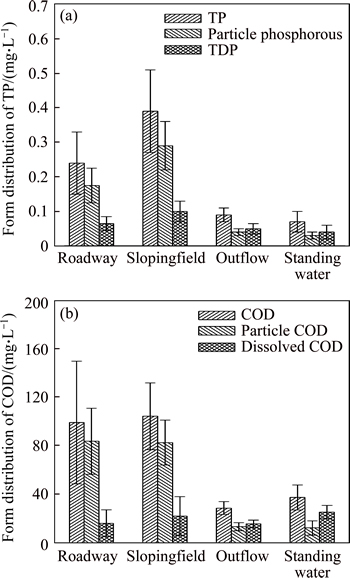
Fig. 5 Distribution of different forms of TP (a) and COD (b) in inflow, outflow and standing water
3.2.3 Chemical oxygen demand
There was moderate COD removal in the wet swale. The mean EMC inputs of roadway and sloping field runoff were 99 mg/L and 104 mg/L, respectively, whereas the effluent EMC values ranged from 24 to 42 mg/L (Table 4). The class IV threshold of the EQSSW for COD was selected as the effluent discharge target. The exceedance probabilities for both roadway andsloping field runoff were 100%, but the exceedance probability was reduced to 7% by the wet swale (Fig. 3(c)). Influent COD was removed mainly by sedimentation, as it was mostly in the particulate form (Fig. 5(b)), with only a small portion in the dissolved form. The dissolved COD in standing water increased significantly relative to the concentration in the influent between events because of the release of organic compounds from decomposing vegetative detritus; this is demonstrated by the slight decrease in the mean COD concentrations in standing water (Fig. 6(b), Table 5) between events.
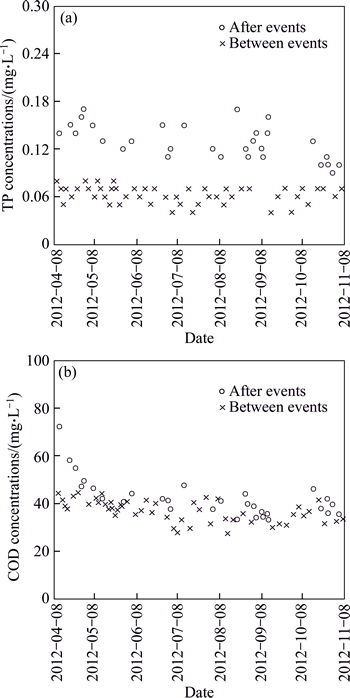
Fig. 6 TP (a) and COD (b) concentrations in standing water between and after events
3.2.4 Nitrogen
The proportions of particulate and dissolved nitrogen varied between the water samples. Particulate nitrogen only accounted for an average of 11.9% of TN in roadway runoff. Most of the influent TN was in dissolved forms of nitrogen, consisting of  -N, and dissolved organic nitrogen. and -N represented approximately 80% of the influent TN concentrations; these were analyzed as separate fractions to allow quantification of the nitrogen treatment, and evaluation of the removal mechanisms within the wet swale.
The wet swale effectively removed from influent runoff. Mean EMC influent concentrations from the road and sloping field were 1.60 and 1.43 mg/L, whereas concentrations in the effluent were 0.41-0.64 mg/L (Table 4), respectively. Nearly all of the EMC values for the effluent were lower than 1 mg/L, and met the class III threshold of the EQSSW (Fig. 3(d)). Influent was removed through adsorption by detritus and eroded soil particles with high silt/clay content (Table 2) from the sloping field in the wet swale [18-19]. The captured was nitrified between events by the available oxygen in the shallow standing water. Plants, through uptake, also removed in the wet swale. However, the increase in the mean ON concentrations in standing water (Fig. 7(b), Table 5) between events relative to the concentrations after events indicated that was generated by ammonification of ON. This offset the NH4+-N removal, meaning that concentrations in standing water between events did not decrease any further (Fig. 7(a), Table 5).
-N concentrations (Table 4) were significantly reduced by the wet swale in all of the storm events. We used an effluent discharge target value of 0.5 mg/L -N to evaluate the efficacy of the wet swale. The exceedance probability was reduced from 90%-100% in runoff to 5% after treatment by the wet swale (Fig. 3(e)). Nitrite was easily oxidized to stable nitrate. Nitrate removal mainly occurred in the interval between events. The organic matter content of soil in the swale was high (Table 2). The organic matter within the wet swale sediments provided carbon substrates for denitrification. In addition, the overall heterotrophic activity was increased by organic matter, which resulted in consumption and subsequent reduction of oxygen within sediments, thus supporting denitrification [20-21]. Plant uptake was also a possible pathway for nitrate removal in the wet swale. Figure 7(c) shows that -N in standing water was removed effectively between events via the pathways mentioned above.
There was significant TN removal in the wet swale, with discharges of 0.78-2.54 mg/L (Table 4). In most cases, effluent TN EMCs were lower than the Class IV threshold of the EQSSW, and the exceedance probability was decreased to 8% by the wet swale (Fig. 3(f)). During the interval between events, TN removal from standing water (Fig. 7(d)) was mainly a result of the significant reduction in -N (Fig. 7(c)), whereas the ON produced by decomposition of organic detritus (Fig. 7(b)) meant there was no further decrease in TN concentrations in standing water.
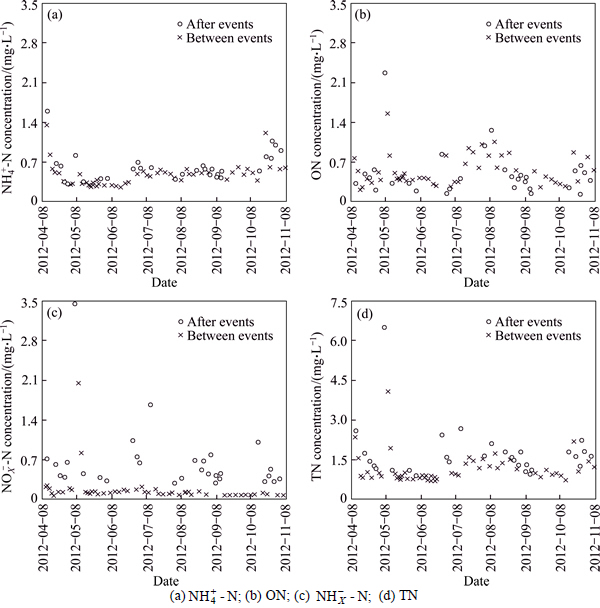
Fig. 7 Concentrations of nitrogen species in standing water between and after events:
3.2.5 Vegetation uptake
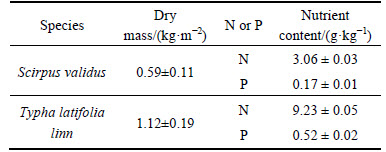
The nutrient removal ability of wet swale vegetation is similar to that of stormwater wetlands that treat stormwater runoff. Plants may play an important role in nutrient removal in wet swales by direct uptake. Over the monitoring period, the mean dry masses of above-ground biomass (Scirpus validus and Typha latifolia linn) collected from the wet swale were 0.59 and 1.12 kg/m2, respectively (Table 6). Because the influent nutrient loading was low (approximately 4.52 and 0.25 g/m2 for nitrogen and phosphorous, respectively), the nutrient uptake by the above-ground plants was lower than that in typical wetland plants [22]. The total mass of nitrogen and phosphorous accumulated in above-ground plants was 5.73 and 0.32 kg. Plant uptake removed 53.8% of the nitrogen and 51.5% of the phosphorous mass imported to the wet swale, demonstrating that plants played an important role in nutrient removal in the wet swale.
Table 6 Dry mass and nutrient content of above-ground plants (mean��std)
4 Discussion
The wet swale substantially reduced pollutant loads during the monitoring period, with reductions between 70% and 85% for the different pollutants (Fig. 8). Pollutants in the influent were removed effectively by the wet swale, and pollutant concentrations in standing water were also low between events. Only a proportion of the reduction in volume during the monitoring period was attributed to exfiltration. The results suggested that pollutant load reductions were mainly ascribed to reductions in concentrations.
Compared to the Scirpus validus planted in wet swale, the Typha latifolia linn took up the more nutrient elements and generated the more biomass, indicating that plant species with great capacity of concentrating nutrient elements and yielding biomass should be selected to promote the removal of nutrients in the wet swale.

Fig. 8 Imported and exported pollutant loads and pollutant load removal efficiency during monitoring period
A high pollutant removal efficiency is important for the Binhu New District in Hefei where the soil, because of its low permeability, cannot deal with runoff from impervious pavements. Further, the cost of constructing wet swales is lower than the cost for other infiltration methods because fewer soil amendments are needed. Therefore, in regions where soil permeability is poor and space is available, wet swales are useful tools for managing roadway runoff, especially nutrients.
5 Conclusions
1) The hydraulic performance of a full-scale wet swale was evaluated. Because evapotranspiration and exfiltration were relatively low, the mean drawdown rate of the water level in the swale was lower than 1 cm/d, and the standing water in the swale was more than 14 cm deep most of the time. The wet swale reduced the runoff volume by 50.4%.
2) The wet swale significantly reduced pollutant concentrations in the influent. The mean EMCs of TSS, TP, COD, -N,  -N, and TN in the effluent were 31, 0.10, 29, 0.52, 0.35, and 1.28 mg/L, respectively. During the monitored period, the wet swale reduced pollutant loads by 70%-85%, representing substantial reductions.
3) Plant Uptake played an important role in nutrient removal in the wet swale. Approximately half of the nutrient mass imported to the wet swale accumulated in above-ground plants in the wet swale during the monitoring period. High plant biomass should be maintained in wet swales to sustain nutrient removal.
4) Wet swales are a cost-effective option for managing runoff from roadways in regions where soil permeability is poor.
References
[1] YU S L, KUO J T, FASSMAN E A, PAN H. Field test of grassed- swale performance in removing runoff pollution [J]. Journal of Water Resources Planning and Management, 2001, 127(3): 168-171.
[2] B CKSTR
CKSTR M M. Grassed swales for stormwater pollution control during rain and snowmelt [J]. Water Science & Technology, 2003, 48(9): 123-134.
[3] BCKSTRM M. Sediment transport in grassed swales during simulated runoff events [J]. Water Science & Technology, 2002, 45(7): 41-49.
[4] BARRETT M E. Performance comparison of structural stormwater best management practices [J]. Water Environment Research, 2005, 77(1): 78-86.
[5] DELETIC A, FLETCHER T D. Performance of grassed filters used for stormwater treatment�CA field and modelling study [J]. Journal of Hydrology, 2006, 317(3/4): 261-275.
[6] STAGGE J H, DAVIS, A P, JAMIL E, KIM H. Performance of grass swales for improving water quality from highway runoff [J]. Water Research, 2012, 46(20): 6731-6742.
[7] DAVIS A P, STAGGE J H, JAMIL E, KIM H. Hydraulic performance of grass swales for managing highway runoff [J]. Water Research, 2012, 46(20): 6775-6786.
[8] HARPER H. Effects of stormwater management systems on groundwater quality [R]. Florida: Environmental Research and Design Incorporation, 1990.
[9] KOON J. Evaluation of water quality ponds and swales in the Issaquah/East Lake Sammamish Basins [R]. Washington D C: King County Surface Water Management and Washington Department of Ecology, 1995.
[10] WINSTON R J, HUNT W F, KENNEDY S G, WRIGHT J D, LAUFFER M S. Field evaluation of storm-water control measures for highway runoff treatment [J]. Journal of Environmental Engineering, 2012, 138(1): 101-111.
[11] LENHART H A. A north carolina field study to evaluate the effect of a coastal stormwater wetland on water quality and quantity and nitrogen accumulation in five wetland plants in two constructed stormwater wetlands [D]. Raleign, USA: The North Carolina State University, 2008.
[12] CARTER M R, GREGORICH E G. Soil sampling and methods of analysis [M]. Boca Raton: CRC Press, 2007.
[13] APHA, AWWA, WPCF. Standard methods for the examination of water and wastewater [S]. Washington D C: American Public Health Association, 1999.
[14] DAVIS A P. Field performance of bioretention: Water quality [J]. Environmental Engineering Science, 2007, 24(8): 1048-1064.
[15] GB 3838��2002. Environment quality standards for surface waters [S]. Beijing: China Environmental Science Press, 2002. (in Chinese)
[16] WU J S, ALLAN C J, SAUNDERS W L, EVETT J B. Characterization and pollutant loading estimation for highway runoff [J]. Journal of Environmental Engineering, 1998, 124(7): 584-592.
[17] VAZE J, CHIEW H S. Nutrient loads associated with different sediment sizes in urban stormwater and surface pollutants [J]. Journal of Environmental Engineering, 2004, 130(4): 391-396.
[18] HSIEH C H, DAVIS A P. Evaluation and optimization of bioretention media for treatment of urban stormwater runoff [J]. Journal of Environmental Engineering, 2005, 131(11): 1521-1531.
[19] CHO K W, SONG K G, CHO J W, KIM T G, AHN K H. Removal of nitrogen by a layered soil infiltration system during intermittent storm events [J]. Chemosphere, 2009, 76(5): 690-696.
[20] NIELSEN L P, CHRISTENSEN P B, REVSBECH N P, S��ENSEN J. Denitrification and oxygen respiration in biofilms studied with a microsensor for nitrous oxide and oxygen [J]. Microbial Ecology, 1990, 19(1): 63-72.
[21] BASTVIKEN S K, ERIKSSON P G, PREMROV A, TONDERSKI K S. Potential denitrification in wetland sediments with different plant species detritus [J]. Ecological Engineering, 2005, 25(2): 183-190.
[22] KADLEC R L, WALLACE S D. Treatment wetlands [M]. Florid: Taylor & Francis Group, LLC, 2009: 289-352.
(Edited by YANG Bing)
Foundation item: Project(2011ZX07303-002) supported by National Water Pollution Control and Management Technology Major Projects, China
Received date: 2015-04-20; Accepted date: 2015-09-24
Corresponding author: LI Tian, Professor, PhD; Tel: +86-21-65988421; E-mail: tianli@tongji.edu.cn
Abstract: The ability of a wet swale, constructed in an area of poor soil permeability, to manage runoff from a roadway was monitored through 27 storm events over a period of 8 months. During the monitoring period, the wet swale reduced the total runoff volume by 50.4% through exfiltration and evapotranspiration. The wet swale significantly decreased the influent pollutant concentrations, and the effluent mean concentrations of total suspended solids, total phosphorus, chemical oxygen demand, ammonium, oxidized nitrogen, and total nitrogen in the effluent were 31 mg/L, 0.10 mg/L, 29 mg/L, 0.52 mg/L, 0.35 mg/L and 1.28 mg/L, respectively. Pollutant loads were also substantially reduced from 70% to 85%. Plant uptake played an important role in nutrient removal in the wet swale. Approximately half of the nitrogen (53.8%) and phosphorus (51.5%) that entered the wet swale was incorporated in above-ground plants. It is shown that wet swales are useful for managing runoff from roads in areas of poor soil permeability.
