
J. Cent. South Univ. (2012) 19: 36-40
DOI: 10.1007/s11771-012-0969-6![]()
Mechanical properties of 3D carbon/carbon composites by
nanoindentation technique
WEI Li-ming(Τ����)1, 2, ZHANG Yue(����)3, XU Cheng-hai(���к�)1, QI Fei(���)1, MENG Song-he(���ɺ�)1
1. Center for Composite Materials, Harbin Institute of Technology, Harbin 150080, China;
2. Institute of Structural Mechanics, China Academy of Engineering Physics, Mianyang 621900, China;
3. School of Foreign Languages, Harbin Institute of Technology, Harbin 150001, China
? Central South University Press and Springer-Verlag Berlin Heidelberg 2012
Abstract:
Nanoindentation tests were conducted to investigate the near-surface mechanical properties of the individual components (fiber and matrix) for three-dimensional reinforced carbon/carbon composites (3D C/C). Optical microscope and polarizing light microscope were used to characterize the microstructure of 3D C/C. The microscopy results show that large number of pores and cracks exist at both bundle/matrix interface and pitch carbon matrix. These defects have important effect on the mechanical behavior of 3D C/C. The in situ properties for components of 3D C/C were acquired by nanoindentation technique. Relative to the matrix sample, the fiber samples have more larger values for modulus, stiffness and hardness. However, there is no significant difference of modulus and stiffness among fiber samples with different directions.
Key words:
C/C composites; mechanical properties; nanoindentation; microstructure��
1 Introduction
Carbon/carbon (C/C) composites consist of a fibrous carbon substrate in a carbonaceous matrix. It displays several advantageous properties for structural applications: low density, good strength retention at high temperature to 3 000 ��C, high thermal and chemical stability in inert environments, and high thermal shock resistance. Applications of carbon/carbon composites in high temperature environments have been explored, especially in the aerospace fields, such as rocket nozzles, nosetips of reentry vehicles, and supersonic aircraft brakes [1-4].
The near-surface properties (elastic modulus, stiffness and hardness) are important parameters in thermal and mechanical models of friction processes occurring in C/C composites. The correct determination of these in situ properties is essential for the design and safety analysis of the composites suffering severe circumstance. But the characterization of in situ performance of C/C composites using traditional measurement method is not easy to succeed. Nanoindentation technique has been the most commonly used technique to measure the near-surface mechanical properties of materials because of the ease and speed with which it can be carried out. It is possible to evaluate conveniently the elastic modulus and hardness by means of accurately measuring load and displacement data throughout an indentation [5-9]. It is a powerful and effective tool for investigating the mechanical properties of materials on a small scale. The procedure uses a nanosize tip which is pressed into the surface of a material and the force is measured as a function of the indentation depth. The mechanical behaviors of the sample can be directly obtained from the force-depth data.
In this work, nanoindentation tests using a Berkovich indenter were conducted to investigate the near-surface mechanical properties of the individual components (fiber and matrix) for 3D reinforced C/C composites including hardness, elastic modulus, and contact stiffness.
2 Materials
Material selected for this study is 3D reinforced C/C composites. The principal scheme of the 3D C/C is shown in Fig. 1. Its preform is made of dry carbon fibers and rigid carbon rods. Carbon rods were preformed from 6K high strength carbon fibers T300 impregnated with unsaturated polyester resin. The rods inserted into the corresponding holes of upper and lower plates are aligned in rectangle. The carbon rods provide the z-direction reinforcement of the 3D C/C.
The spacing between z-direction rods of 3D C/C formed channels in four directions. The x- and y-direction bundles were woven around straight z-direction rods. Two more ��45�� direction bundles were placed in the x-y plane to give a five-directional reinforcement. Fiber bundles in x, y and z-directions had different shapes and sizes. As can be seen from Fig. 2, the cross-section of z-direction bundle was nearly circular. The cross-section of y-direction bundle was relatively regular and was nearly rectangular. As can be seen from Fig.2(c), the cross-section of x-direction had very irregular shapes that could not be accurately approximated by circles and ellipses. The matrix of 3D C/C was created in the course of carbon vapor infiltration (CVI) and coal tar pitch impregnation. The product was subjected to a final graphitization treatment at high temperature of about 2 500 ��C in inert atmosphere [10]. According to our measurements, the density of 3D C/C was 1.87 g/cm3, which was 17% smaller than the ideal graphite density. A large part of this difference was due to different porosities. The fibre volume fraction was about 47%, and the porosity was about 7%.
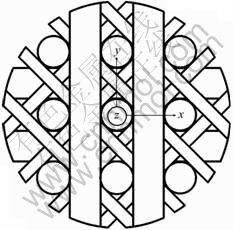
Fig. 1 Scheme of preform for 3D C/C with Cartesian coordinate system
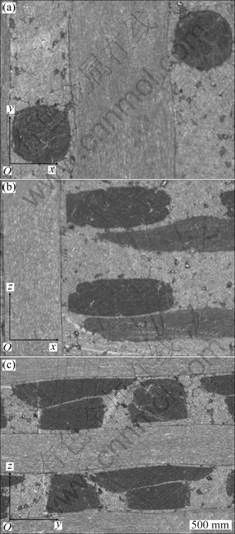
Fig. 2 Optical microscopy images of three-dimensional C/C in direction normal to axes: (a) z direction; (b) y direction; (c) x direction
3 Experimental
Nanoindentation tests were made using a MTS Nanoindenter XP at Analysis and Test Center in the Harbin Institute of Technology, China. The tip is a Berkovich-type three-sided pyramid diamond with a 65�� angle between the sides and the normal direction to the base. The applied load of the indenter was measured by an electronic microbalance with a resolution of 50 nN and the penetration depth was measured by a fiber-optic lever displacement transducer with a resolution of 0.01 nm. However, thermal fluctuations are caused by some components of the apparatus. In this work, the typical load- displacement curve was recorded and the displacement data were corrected by assuming that the temperature changing rate was constant throughout the entire test.
The samples for the indentation tests were cut from the 3D C/C block. Different direction bundles and pitch matrix samples of 3D C/C were respectively buried in epoxy resin and ground with emery paper, and finally polished with Cr2O3 solution. Each indentation location was viewed and selected using an optical microscope. For each specimen, the carbon fiber (oriented perpendicular to the cross-section of the fiber) or matrix were indented five times. For each indent, the displacement as a function of applied load was recorded until the displacement reached at least 2 000 nm, and then unloading.
Nanoindentation loading-displacement was analyzed by the Oliver-Pharr method [11]. Figure 3 shows a typical load�Cdisplacement curve and the deformation pattern of indentation process. When the indenter is driven into the material, both elastic and plastic deformations occur, generating an impression in the material that follows the geometric shape of the indenter and produces a depth referred to as hc, which is the contact depth and is defined as the depth of the indenter in contact with the sample under load. In Fig. 3, hm represents the displacement for the maximum applied load (Pm); hf is the final displacement after complete unloading; S represents the contact stiffness measured during the first moment of the unload operation. The area between the loading and unloading curve represents the energy dissipated in the coating due to plastic deformation. The hardness (H) is determined from the load�Cdisplacement curve obtained using the Berkovich indenter, and it is defined as the indentation load divided by the projected contact area of the indentation:
![]() (1)
(1)
where Aa is the projected area of contact that is deduced from an empirically determined function describing the cross-sectional area of the indenter, Aa=f(hc), at a distance hc from the tip.
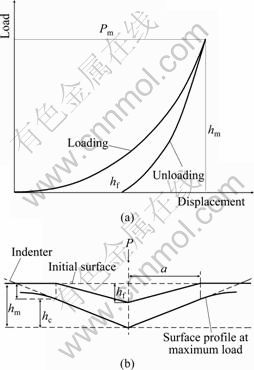
Fig. 3 Schematic representation of loading and unloading in a cycle of indentation (a), and indentation deformation at peak load and after unloading (b)
In Eq.(1), the area function is evaluated at the contact depth:
![]() (2)
(2)
where �� is a correction factor (approximately equal to 0.75 for the Berkovich indenter).
During the very initial unloading of the indenter, assume the elastic compliances of the indenter and samples are isotropic, S = dP/dh, i.e., the slope of the initial portion of the unloading curve [12]. For the indentation data studied in this work, the unloading curve is fitted to the relation described by OLIVER and PHARR to determine the contact stiffness S. The elastic modulus E for the material is determined by evaluating the reduced modulus Er of the contact, as given by
![]() (3)
(3)
where vi and Ei are the Poisson ratio and the elastic property of the diamond indenter and v is the Poisson ratio of the measured sample. The Poisson ratio for the indenter, vi, is 0.07 and v is assumed to be 0.25 for the carbon fiber and pitch matrix in this work. And the indenter modulus Ei is 1 141 GPa. In the model, contact occurs between an elastic half-space with a modulus Er and a rigid indenter elasticity theory, and then provides a relationship between the measured stiffness and the effective modulus which is applicable to an indenter of any shape [13] and given by
![]() (4)
(4)
where �� is a constant that depends on the geometry of the indenter (��=1.034 for a Berkovich indenter). By combining Eq. (3) and Eq. (4), one can thus determine the modulus of the indented material.
4 Results and discussion
4.1 Microstructure
In this work, optical microscope (OM) and polarizing light microscope (PLM) were used to characterize the microstructure of 3D C/C. In Figs. 2 (a)�C(c), the OM micrographs of 3D C/C are shown. As evidenced by the micrographs, many relatively large pores/cracks are present ranging from 30 to 100 ��m in size. Most of them are located in the pitch matrix and at the fiber bundle/matrix interface. The majority of these cavities appear to be closed, but some of them are interconnected or linked with cracks along fiber bundle/matrix interface. Those pores/cracks are formed due to shrinkage of the matrix carbon during processing treatment and volatilization during carbonization/ graphitization cycles.
PLM is a simple and reliable method to distinguish the pyrocarbon structures exactly and quantitatively. Typical micrographs for different direction specimens obtained by PLM micrographs are shown in Fig. 4. It can be seen that, fibers within bundles can tightly adjoin to each other or can be packed loosely. Pyrolytic carbon penetrates into the bundles. But a large number of imperfections within the bundles remain after densification, especially in the x-direction bundles (Fig. 4(a)). The mean diameter is 10-15 ��m for these macro-defects. Compared with the x-direction bundles, the number and size of pores are much smaller than those in the y-direction and z-direction bundles.
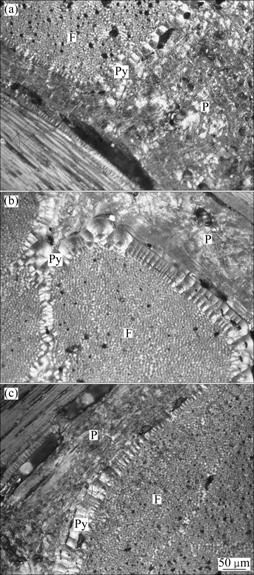
Fig. 4 PLM micrographs for different direction samples of 3D C/C (F: fibre bundles; P: pitch carbon; Py: pyrolytic carbon): (a) x direction; (b) y direction; (c) z direction
Under polarized light, different indications of the orientation of basal planes are seen in each component of the 3D C/C. Similar to that observed in the OM micrographs, many pores/cracks are also observed in the PLM micrographs. At bundle/matrix junctions, there are more large macro-cracks than intra-bundle region. As can also be seen in Fig. 4, the type of carbon matrix of 3D C/C is not same. Clearly, pyrolytic carbon matrix is located at the bundle/matrix interface, and the space between the fiber bundles is mainly filled by pitch carbon matrix.
4.2 Indentation curves
Figure 5 shows the typical load�Cdisplacement curves at applied penetration of 2 000 nm obtained in the nanoindentation test. As can be seen from Fig. 5, the behavior is nearly identical for different direction fiber specimens of 3D C/C. The performances of fibers and matrix are significantly different. Fibers of 3D C/C exhibit a clear plastic behavior during the loading. We can also notice for the penetration depth of 2 000 nm, corresponding to applied loads ranging between 100 and 120 mN for fiber specimens, and the applied load is about 40 mN for pitch matrix specimens. The slope of the unload curves for x-, y- and z-direction fiber sample of 3D C/C is almost identical.
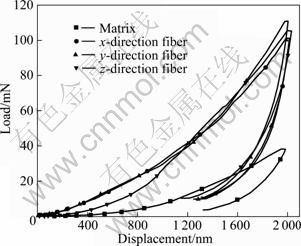
Fig. 5 Typical load�Cdisplacement curves obtained from nanoindentation tests for 3D C/C
4.3 Modulus and hardness
For each indent, the elastic modulus and hardness value are calculated by using the unloading curve. These values are obtained by averages of five experiment points of the loading data. The dispersion coefficient is calculated and reported. Hardness is calculated using Eq. (1). Table 1 lists the measured mechanical property results at penetration depth of about 2 000 nm for all of the samples in this study. In each case, the elastic modulus, hardness, and stiffness values determined for five indents of each component are averaged. The dispersion coefficient for each parameter is indicated in parentheses for each value.
Table 1 Properties of fiber and matrix samples
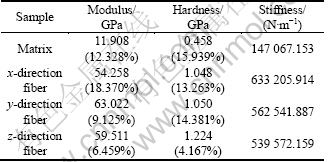
From Table 1, the elastic moduli of 3D C/C for x-direction, y-direction, z-direction fiber and pitch matrix samples are 54.258, 63.022, 59.511 and 11.908 GPa, respectively. Their hardnesses are 1.048, 1.05, 1.224 and 0.458 GPa, respectively. Relative to the pitch matrix samples, it is evident that the fiber samples with high hardness exhibit higher value of modulus and stiffness. In a way, the test values of modulus for fiber samples reflect the elastic modulus of fiber bundle. Due to the physical damage caused in the processing and pores distributing in the bundle, the elastic modulus of fiber bundle is much less than that of T300 single fiber. We can also notice that the values for each property fall within a narrow range and the dispersion coefficients are reasonable. The dispersion coefficient of the measurement for x-directional specimens of 3D C/C is 18.37%, and this greater scatter can be explained by the more pores distributing inhomogeneously in the x-direction fiber bundle (Fig. 4(a)).
The above discussion is based on the assumption that the values are calculated by applying Eq.(3) with a constant Poisson ratio of 0.25 for the fiber and matrix samples. The value is chosen based on values reported in Ref. [14] for PAN fiber of varying measured elastic modulus. Given the difficulty of measuring Poisson ratio for brittle materials, the ratio for a given component may be smaller by down to an order of magnitude, and the actual elastic modulus of fiber of 3D-C/Cs may be somewhat larger than that reported in Table 1. Even if there is only a rough estimate of Poisson ratio of 0.25��0.1, there still exists a 5% uncertainty in the calculated value of E for the material [15]. Moreover, test results of elastic modulus and hardness are affected by applied load value, deformation of indenter during indentation or tip blunting. The effects of deformation of indenter are well described by GONG et al [16] and LEMOINE et al [17]. These effects are not discussed in detail in this work.
5 Conclusions
1) The microstructure of 3D C/C was investigated by OM and PLM. It is shown that the orientation and morphology characteristics are obviously different for different direction fiber bundles. A large number of pores and cracks randomly distribute at the fiber bundle/matrix interface and pitch carbon matrix. A small amount of pyrolytic carbon matrix locates at the bundle/matrix interface.
2) The mechanical properties for components of 3D C/C were measured using a Berkovich indenter. Hardness, elastic modulus and contact stiffness were calculated and discussed. The behavior is significantly different for fiber and matrix samples. The modulus of fiber bundle is about 60 GPa, and the modulus of pitch matrix is about 12 GPa. The hardness of fiber bundle samples is larger than that of pitch matrix sample.
References
[1] XU Hui-juan, XIONG Xiang, YI Mao-zhong, HUANG Bai-yun, WANG Hui. Thermal conductivity properties of carbon/carbon composites with thin felt laminate at high temperature [J]. Journal of Central South University: Science and Technology, 2008, 39(3): 500-505. (in Chinese)
[2] GE Yi-cheng, YI Mao-zhong, TU Xin-da, PENG Ke. To-fro sliding tribological behavior of C/C composite under different loads [J]. Journal of Central South University: Science and Technology, 2010, 41(1): 114-119. (in Chinese)
[3] LEI Bao-ling, YI Mao-zhong, XU Hui-juan. RAN Li-ping, GE Yi-cheng, PENG Ke. Raman spectroscopy investigation of structural and textural change in C/C composites during braking [J]. Journal of Central South University of Technology, 2011, 18 (1): 29-35.
[4] SAVAGE G. Carbon-carbon composites [M]. London: Chapman and Hall, 1993: 101-105.
[5] FISCHER A C. Nanoindentation [M]. New York: Springer-Verlag, 2004: 2-3.
[6] JAKES J E, FRIHART C R, BEECHER J F, MOON R J, STONE D S. Experimental method to account for structural compliance in nanoindentation measurements [J]. Journal of Materials Research, 2008, 23: 1113-1127.
[7] LEE S H, WANG S Q, PHARR G M, XU H T. Evaluation of interphase properties in a cellulose fiber-reinforced polypropylene composite by nanoindentation and finite element analysis [J]. Composites: Part A-Applied Science and Manufacturing, 2007, 38: 1517-1524.
[8] KONNERTH J, VALLA A, GINDL W. Nanoindentation mapping of a wood-adhesive bond [J]. Applied Physics A-Materials Science & Processing, 2007, 88: 371-375.
[9] LI W H, SHIN K, LEE C G, WEI B C, ZHANG T H, HE Y Z. The characterization of creep and time-dependent properties of bulk metallic glasses using nanoindentation [J]. Materials Science and Engineering A, 2008, 478: 371-375.
[10] LI Rui-zhi, LI Ya-di, SU Jun-ming, CUI Hong, SU Zhe-an, ZHOU Shao-jian. Study of the properties of axial rod 4D woven C/C composite [C]// Eurocarbon��98. Strasbourg, France: 1998: 110.
[11] OLIVER W C, PHARR G M. An improvement technique for determining hardness and elastic modulus using load and displacement sensing indentation experiments [J]. Journal of Materials Research, 1992, 7: 1564�C1583.
[12] KANARI M, TANAKA K, BABA S, ETO M. Nanoindentation behaviour of a two�Cdimensional carbon�Ccarbon composite for nuclear applications [J]. Carbon, 1997, 35: 1429-1437.
[13] MARX D T, RIESTER L. Mechanical properties of carbon�Ccarbon composite components determined using nanoindentation [J]. Carbon, 1999, 37: 1679-1684.
[14] CHAMMS C C. Engineers guide to composite materials [M]. WEETON J W, PETELS D M, THOMAS K L. Ohio: American Society of Metals, 1987: 3-11.
[15] HAY J L, PHARR G M. Instrumented indentation testing [S]. ASM Handbook, 2000: 232-243.
[16] GONG Jiang-hong, MIAO He-zhuo, PENG Zhi-jian. On the contact area for nanoindentation tests with Berkovich indenter: case study on soda�Clime glass [J]. Materials Letter, 2004, 58: 1349-1353.
[17] LEMOINE P, QUINN J P, MAGUIRE P, MACLAUGHLIN J A. Comparing hardness and wear data for tetrahedral amorphous carbon and hydrogenated amorphous carbon thin films [J]. Wear, 2004, 257: 509-522.
(Edited by YANG Bing)
Foundation item: Project(61391) supported by the National Security Basic Research Program of China; Project (91016029) supported by the National Natural Science Foundation of China
Received date: 2010-12-01; Accepted date: 2011-05-23
Corresponding author: MENG Song-he, Professor, PhD; Tel: +86-451-86417560; E-mail: mengsh@hit.edu.cn
Abstract: Nanoindentation tests were conducted to investigate the near-surface mechanical properties of the individual components (fiber and matrix) for three-dimensional reinforced carbon/carbon composites (3D C/C). Optical microscope and polarizing light microscope were used to characterize the microstructure of 3D C/C. The microscopy results show that large number of pores and cracks exist at both bundle/matrix interface and pitch carbon matrix. These defects have important effect on the mechanical behavior of 3D C/C. The in situ properties for components of 3D C/C were acquired by nanoindentation technique. Relative to the matrix sample, the fiber samples have more larger values for modulus, stiffness and hardness. However, there is no significant difference of modulus and stiffness among fiber samples with different directions.
