

![]()

Trans. Nonferrous Met. Soc. China 22(2012) 2370-2378
Effect of flow stress��strain relation on forming limit of 5754O aluminum alloy
WANG Hai-bo1, WAN Min2, YAN Yu1
1. College of Mechanical and Electrical Engineering, North China University of Technology, Beijing 100144, China;
2. School of Mechanical Engineering and Automation, Beihang University, Beijing 100191, China
Received 9 July 2012; accepted 8 August 2012
Abstract:
A modified Swift type flow stress��strain relation was presented in order to describe the uniaxial tension test curve reasonably. The FLD-strain (forming limit diagram made up of limit strain) of 5754O aluminum alloy sheet was calculated based on the two flow stress��strain relations using Yld2000-2d yield function. By comparing the theoretical and experimental results, it is found that the calculated FLD-strain based on the modified Swift flow stress��strain relation can reasonably describe the experimental results. However, though the common Voce flow stress��strain relation can describe the deformation behavior during homogenous deformation phase accurately, the FLD-strain calculated based on it is obviously lower than the experimental result. It is concluded that the higher the hardening rate of sheet metal is, the higher the forming limit is. A method for determining the reasonable flow stress��strain relation is recommended for describing the material behavior during inhomogenous phase and the forming limit of sheet metal.
Key words:
aluminum alloy; forming limit; sheet metal; flow stress��strain relation; inhomogenous deformation;
1 Introduction
Forming limit diagram plays an important role on the analysis of plastic forming of sheet metals and has become an indispensable criterion for performance analysis and failure prediction [1-4]. The groove instability theory (called M-K theory for short) proposed by MARCINIAK and KUCZYNSKI [5] is the most representative theory for calculating the forming limit of sheet metals. The whole plastic deformation process of sheet metals is from the initial yield point to the failure point which includes the homogeneous and inhomogeneous deformation processes. So in order to obtain reasonable forming limit by a theoretical method, the proper yield function and instability theory should be adopted [2]. The yield function is for describing the anisotropic deformation behavior while the instability is for judging when the deformation process stops, namely, when the fracture occurs [2,6-9]. Besides the anisotropic deformation behavior, strain hardening behavior during plastic deformation also exits [10-13]. A reasonable flow stress��strain relation should also be adopted to describe the strain hardening behavior during the whole plastic deformation process [13,14]. So when calculating the forming limit of sheet metals, besides the instability theory and yield function [2,14,15], an accurate flow stress��strain relation should also be chosen. The common flow stress��stain relations belong to Hollomon type, Swift type and Voce type, etc. The constants of the flow stress��strain relations are obtained by fitting the uniaxial tensile test data in homogeneous deformation phase. In general, a theoretical flow stress��strain relation describing the homogeneous deformation phase reasonably should be adopted for the theoretical analysis or the numerical simulation of sheet metal forming including the calculation of forming limit [16]. When calculating the forming limit of sheet metals, the plastic deformation behaviors in the whole deformation process including homogeneous and inhomogeneous deformations are needed. But the flow stress��strain relation is obtained only by fitting the experimental data in homogeneous deformation phase since the experimental data in inhomogeneous deformation phase cannot be obtained. When calculating forming limit of sheet metal, we do not know whether the strain hardening behavior in inhomogeneous deformation phase is described reasonably or not. So the accuracy of the calculated forming limit cannot be ensured. Many studies have been carried out on the effect of yield function and instability on forming limit of sheet metals [10,17-22]. Nevertheless, few studies about the effect of the flow stress��strain relation on the forming limit of sheet metals have been carried out.
In this study, the forming limit of 5754O aluminum alloy is calculated based on M-K instability theory. When calculating the forming limit, the proper yield function which describes the anisotropic behavior under different loading paths is adopted. In addition, two types of flow stress��strain relations are used for the calculation of forming limit. The effect of the flow stress��strain relations on the calculated forming limit of sheet metals is discussed.
2 Constitutive relation
2.1 Yield function
5754O aluminum alloy sheet was used in this study and the mechanical properties of it are listed in Table 1.
In this study, Yld2000-2d yield function proposed by BARLAT et al [23] was adopted to calculate the forming limit of 5754O aluminum alloy.
Yld2000-2d yield function is given by:
![]() (1)
(1)
where exponent m is a material coefficient and
![]() (2)
(2)
where f is the sum of two isotropic functions, which are symmetric with respect to ![]() and
and ![]()
![]() and
and ![]() are the principal values of the matrices, X�� and X��.
are the principal values of the matrices, X�� and X��.
 (3)
(3)
Components of X�� and X�� are obtained from the following linear transformation of the Cauchy stress:
X��=L���, X��=L��� (4)
where
 (5)
(5)
 (6)
(6)
In Eq. (4), �� is Cauchy stress, and in Eqs. (5) and (6) ��1, ��, ��8 are eight anisotropy coefficients. In this study, m=8 since 5754O aluminum alloy is an FCC material.
In order to describe the observed anisotropy changes of 5754O aluminum alloy sheet during the deformation, the constants (��1, ��, ��8) of Yld2000-2d yield function were presented as a polynomial function of the equivalent plastic strain ![]() according to the plastic work equivalent theorem shown in Eq. (7).
according to the plastic work equivalent theorem shown in Eq. (7).
![]() (7)
(7)
The polynomial coefficients (calculated with the method developed [16]) of the material parameters (��1, ��, ��8) of the Yld2000-2d yield function are shown in Table 2.
Then Yld2000-2d yield function can describe the anisotropic behaviors more accurately [12], as shown in Fig. 1. Figure 2 shows the relations between a few constants (��1, ��2, ��7 and ��8) and the equivalent plastic strain as examples.
2.2 Flow stress��strain relation
Swift and Voce type relations are two common flow stress��strain relations. In this study, a new flow stress��strain relation is presented by modifying Swift type relation. Then three kinds of flow stress��strain relations are adopted for describing the strain hardening behavior.
The Voce flow stress��strain relation is expressed as:
![]() (8)
(8)
Table 1 Mechanical properties of material 5754O aluminium alloy sheet

Table 2 Coefficients of ��1-��8 as polynomial function of equivalent plastic strain
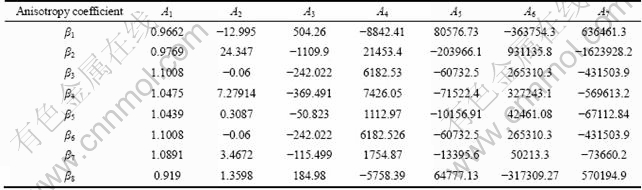
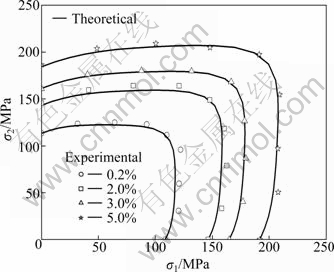
Fig. 1 Experimental and theoretical plastic work contours (based on Yld2000-2d yield function)
The Swift flow stress��strain relation is expressed as:
![]() (9)
(9)
The Swift type flow stress��strain relation is modified by adding a material constant for describing the experimental data more accurately which is expressed as:
![]() (10)
(10)
In Eqs. (8)-(10), ��0, q, b, k, ![]() n and c are material constants.
n and c are material constants.
The material constants of the three flow stress��strain relations are obtained by fitting the experimental data under uniaxial tensile test.
The material constants for the three flow stress��strain relations are shown in Table 3.
The three flow stress��strain relations are compared with the experimental flow stress��strain relations in Fig. 3. As shown in Fig. 3, the Voce and modified Swift flow stress��strain relations can describe the strain hardening behavior reasonably while the original Swift relation cannot especially when the strain is greater than 0.15.
In order to quantitatively evaluate the theoretical flow stress��strain relations, an error function, ��, is introduced for each stress��strain relation:
 (11)
(11)
where n is the number of the experimental points; ![]() and
and ![]() are the experimental stress and the corresponding theoretical stress, respectively. For each experimental strain
are the experimental stress and the corresponding theoretical stress, respectively. For each experimental strain ![]() the experimental stress is obtained from the experimental stress��strain curve while the theoretical stress is calculated based on the theoretical flow stress��strain relation.
the experimental stress is obtained from the experimental stress��strain curve while the theoretical stress is calculated based on the theoretical flow stress��strain relation.
The values of the error �� for the three flow stress��strain relations are shown in Table 4. As indicated in Table 4, the errors of the Voce and the modified Swift stress��strain relation are very small while the error of the original Swift flow stress��strain relation is relatively large. The error of the original Swift flow stress��strain relation is obviously larger than that of the Voce or the modified Swift stress��strain relation.
Then the Voce and the modified Swift flow stress��strain relations which describe the experimental flow stress��strain curve reasonably are adopted for calculating the forming limit of 5754O aluminum alloy.
3 Calculation method for forming limit
The most famous instability theory which is used widely is M-K instability theory proposed by MARCINIAK and KUCZYNSKI [5]. In M-K instability theory, virtual thickness imperfections are introduced as grooves simulating defects in an otherwise uniform sheet material, as shown in Fig. 4. The deformation field is computed inside the groove as a result of the applied loading outside the groove. Failure is considered to occur when the ratio of the deformation in the groove relative to the nominal deformation (outside the groove) is greater than a critical value. As shown in Fig. 4, a and b denote normal and groove areas, respectively. The modified M-K theory [2] is used when calculating the forming limit, namely, it is assumed that there is an initial angle between the groove and the major principal stress direction under each loading condition. Under each loading condition, the minimum value of the calculated forming limits is regarded as the forming limit when the initial angle varies from 0�� to 90��. The stress analyses of the areas a and b in the modified M-K model are shown in Fig. 5. In Fig. 5, ��1, ��11, ��2, ��22, ��12 and ��21 are the stress components in the normal area Among them, ��1 and ��11 are the major principal stresses; ��2 and ��22 are the minor principal stresses; ��12 and ��21 are the shear stresses. ��nn, ��tt, ��tn and ��nt in Fig. 5 are the stress components in the groove area. Among them, ��nn and ��tt are the major principal stresses; ��tn and ��nt are the minor principal stresses. For the area a we have
![]() (12)
(12)
![]() (13)
(13)
![]() (14)
(14)
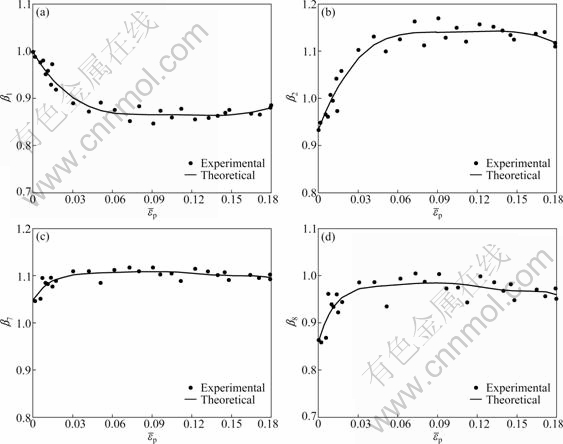
Fig. 2 Functional relations between ��1 (a), ��2 (b), ��7 (c), ��8 (d) and ![]()
Table 3 Material constants for two kinds of flow relations
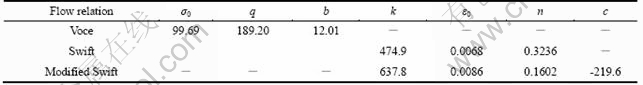
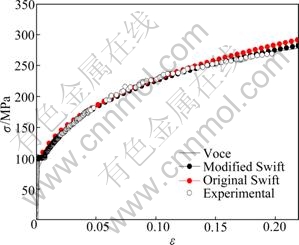
Fig. 3 Theoretical and experimental uniaxial tension stress��strain relation along rolling direction
Table 4 Error of flow relations
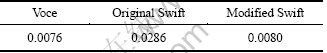
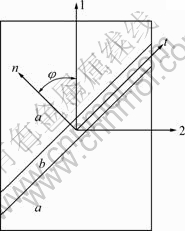
Fig. 4 Sheet metal with initial thickness imperfections (M-K model)
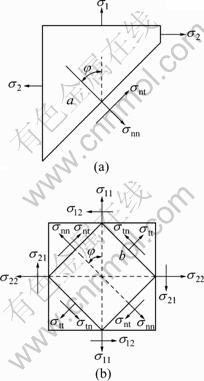
Fig. 5 Stress analysis for M-K model: (a) Normal area; (b) Groove area
For the area b,
![]() (15)
(15)
![]() (16)
(16)
![]() (17)
(17)
where n and t are the normal and tangential directions of the groove respectively. According to the force equilibrium of the section between the areas a and b, we have
![]() (18)
(18)
Then we have
![]() (19)
(19)
and
![]() (20)
(20)
 (21)
(21)
where ![]() and
and ![]() denote the initial thickness of the normal and groove areas before deformation, respectively; t a and t b denotes the true thickness during deformation of the normal and groove areas, respectively; ��3 is the strain in the direction of thickness.
denote the initial thickness of the normal and groove areas before deformation, respectively; t a and t b denotes the true thickness during deformation of the normal and groove areas, respectively; ��3 is the strain in the direction of thickness.
Set ![]() where f0 is the initial thickness imperfection.
where f0 is the initial thickness imperfection.
From Eqs. (12) to (17), we have
![]()
![]() (22)
(22)
The angle of the groove, ��, is updated during deformation as:
![]() (23)
(23)
where ![]() and
and ![]() are the principal strain increments in the plane of the area a.
are the principal strain increments in the plane of the area a.
The compatibility equation between the areas a and b is
![]() (24)
(24)
where
![]()
There are many methods to determine the instability point. Generally, the instability point is determined when the ratio of the strain increments outside the groove to those inside the groove is smaller than a certain value [2,9]. In this study, the instability is determined when the ratio of the equivalent strain increments outside the groove to those inside the groove is smaller than 0.01 (![]() ).
).
4 Comparison between theoretical and experimental FLD-strain
With the forming limit calculation process [2,15], the theoretical FLD-strain of 5754O aluminum alloy under linear strain paths is calculated based on the equivalent plastic strain-dependent Yld2000-2d yield function using the Voce and the modified Swift stress��strain relations.
The experimental FLD-strain under linear loading paths is obtained with punch bulging test by HAN [24]. The specimens for the experimental FLD-strain are shown in Fig. 6 and the dimensions of them are shown in Fig. 7. For each specimen, when the fracture occurred, the test was stopped. The deformed specimens in the punch bulging test are shown in Fig. 8 [24].
The calculated and experimental FLD-strains under linear loading paths are compared in Fig. 9. As shown in Fig. 9, the calculated FLD-strain based on the modified Swift flow stress��strain relation can describe the experimental results reasonably when the thickness imperfection f is from 0.991 to 0.997. However, the calculated FLD-strain based on Voce flow relation is lower than the experimental results even the thickness imperfection f is high to 0.9999.

Fig. 6 Specimens for experimental FLD-strain
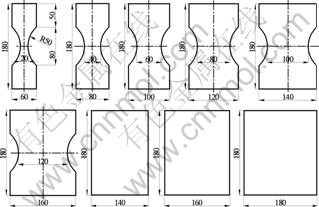
Fig. 7 Dimensions of specimens for experimental FLD-strain (mm)

Fig. 8 Deformed specimens in punch bulging test
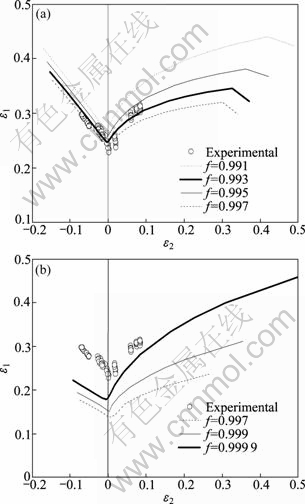
Fig. 9 Comparison of experimental and theoretical FLD-strain: (a) Based on modified Swift; (b) Based on Voce
As shown in Fig. 3, both the Voce and the modified Swift flow stress��strain relations can describe the uniaxial tension test curve accurately. But the calculated FLD-strains based on the Voce and the modified Swift flow stress��strain relations are obviously different. The material constants of the two flow stress��strain relations are obtained just by fitting the experimental data in homogenous deformation process since the experimental data in inhomogenous deformation phase cannot be obtained. Therefore, the accuracy of the Voce and the Swift flow stress��strain relations on describing the deformation behavior in inhomogenous deformation cannot be ensured. And yet, the calculation process of forming limit includes the homogenous and inhomogenous deformation processes. The Voce and the modified swift flow stress��strain relations are compared further in Fig. 10. As shown in Fig. 10, the two flow stress��strain relations coincide with each other in the
homogenous deformation phase while they bifurcate after the fracture point. With the increase of deformation, it can be seen that the modified Swift flow stress��strain relation has a higher slope than the Voce relation. In other words, the material hardening rate based on the modified Swift flow stress��strain relation is higher than that based on the Voce relation. The higher material hardening rate may result in a higher forming limit [25], so that the calculated forming limit based on the modified Swift flow relation is higher than that based on the Voce flow relation. Therefore, it is concluded that when calculating the forming limit, the proper flow stress��strain relation should be adopted besides the proper yield function and instability theory.
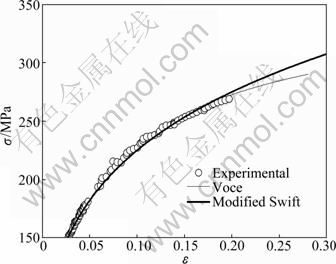
Fig. 10 Comparison between Voce and Modified Swift stress��strain relations
As shown in the above, even though the accurate anisotropic yield function is adopted, the flow stress��strain relation plays an important role on the forming limit. Though both the above two flow stress��strain relations can describe the deformation behavior in the homogenous phase, the resulted forming limits based on them are very different. Therefore, when calculating the forming limit of sheet metals, the proper flow stress��strain relation should be adopted besides the proper yield function.
As shown in Fig. 9, the limit strain (including the strain in homogenous and inhomogenous deformation phase) close to the fracture point is about 0.3. The homogenous deformation behavior of the material used in this study at such a deformation amount cannot be obtained by conventional experimental method. When the theoretical calculation or the numerical simulation is carried out, if the actual deformation amount is greater than the maximal deformation obtained by conventional experimental method (e.g. uniaxial tension test), the deformation behavior after this maximal deformation will be described with assumption since the constants of the flow stress��strain relation are obtained from the data in the homogenous deformation phase. So the conventional tension test (e.g. uniaxial tension test) is not applicable for determining the proper flow stress��strain relation for describing the deformation behavior and forming limit at a large deformation amount.
In this study, a method for determining the proper flow stress��strain relation is recommended. First, the flow stress��strain relation describing the deformation behavior in homogenous deformation phase is selected by fitting the experimental data from the uniaxial tension test. Then the forming limits under a certain loading path (e.g. uniaxial tension) which can be carried out easily are calculated based on the selected flow relation with the accurate yield function and instability theory. Finally, the calculated forming limits are compared with the experimental forming limits. Then the flow stress��strain relation which can describe the deformation behavior in homogenous and inhomogenous deformation phase reasonably can be determined. Here, the experimental forming limit which can be obtained easily is recommended, such as the forming limit under uniaxial tension or plane strain tension, which can be obtained by stretching the specimen to fracture and measuring the strain close to the fracture point.
5 Conclusions
1) The Voce and the modified Swift flow stress��strain relations coincide well with the experimental uniaxial tension curve while the original Swift relation does not.
2) Though the accurate anisotropic yield function is used, the flow stress��strain relation also plays an important role on the calculated forming limit. The FLD-strain calculated based on the modified Swift flow stress��strain relation can describe the experimental results reasonably while that calculated based on the Voce flow stress��strain relation can not. The theoretical FLD-strain calculated based on it is obviously lower than the experimental result.
3) After the homogenous deformation phase, the modified Swift flow stress��strain relation has a higher hardening rate than the Voce relation which leads to the forming limit based on the modified Swift relation higher than that based on the Voce relation.
4) When the theoretical or the numerical work is carried out for the whole deformation process of sheet metal, the proper flow stress��strain relation should be adopted besides the proper yield function and instability theory. The method with the measure of the limit strain in order to choose the reasonable flow stress��strain relation describing the deformation behavior during the whole deformation process (including the homogenous and the inhomogenous deformation) of sheet metal is recommended.
References
[1] ZHAO L, SOWERBY R, SKLAD M P. A theoretical and experimental investigation of limit strains in sheet metal forming [J]. International Journal of Mechanical Sciences, 1996, 38(12): 1307-1317.
[2] WANG Hai-bo, WAN Min. Forming limit of sheet metals based on mixed hardening model [J]. Science in China Series E: Technological Sciences, 2009, 52(5): 1202-1211.
[3] MA Gao-shan, WAN Min, WU Xiang-dong. Forming limit diagram and calculating model for 5A90 Al-Li alloy sheet at elevated temperature [J]. The Chinese Journal of Nonferrous Metals, 2008, 18(4): 717-721. (in Chinese)
[4] MA Gao-shan, WAN Min, WU Xiang-dong. Theoretical prediction of FLDs for Al-Li alloy at elevated temperature based on M-K model [J]. The Chinese Journal of Nonferrous Metals, 2008, 18(6): 980-984. (in Chinese)
[5] MARCINIAK Z, KUCZYNSKI K. Limit strain in the process of stretch forming sheet metal [J]. International Journal of Mechanical Sciences, 1967, 9(2): 609-620.
[6] YOSHIDA K, KUWABARA T, KURODA M. Strain path- dependence of the forming limit stresses in a sheet metal [J]. International Journal of Plasticity, 2007, 23(3): 361-384.
[7] PHILIP E, VAN B A, VAN P H. Marciniak�Ckuczynski type modeling of the effect of through-thickness shear on the forming limits of sheet metal [J]. International Journal of Plasticity, 2009, 25(12): 2249-2268.
[8] YAO H, CAO J. Prediction of forming limit curves using an anisotropic yield function with prestrain induced backstress [J]. International Journal of Plasticity, 2002, 18(8): 1013-1038.
[9] CAO J, YAO H, KARAFILLIS A, BOYCE M C. Prediction of localized thinning in sheet metal using a general anisotropic yield criterion [J]. International Journal of Plasticity, 2000, 16(9): 1105-1129.
[10] YOSHIDA K, KUWABARA T. Effect of strain hardening behavior on forming limit stresses of steel tube subjected to nonproportional loading paths [J]. International Journal of Plasticity, 2007, 23(7): 1260-1284.
[11] WANG Hai-bo, WAN Min, WU Xiang-dong, YAN Yu. Subsequent yield loci of 57540 aluminum alloy sheet [J]. Transactions of Nonferrous Metals Society of China, 2009, 19(5): 1076-1080.
[12] WU Xiang-dong, WAN Min, WANG Wen-ping. Establishment and analysis of equivalent stress-equivalent strain curves of sheet metal [J]. Materials Science & Technology, 2009, 17(2): 236-238. (in Chinese)
[13] SONG Yu-quan, CHENG Yong-chun, WANG Xi-wen. Experimental measurement and elaborate analysis of strain hardening exponent in tensile deformation [J]. Science in China Series E: Technological Sciences, 2001, 44(4): 365-376.
[14] WANG Hai-bo, WAN Min, WU Xiang-dong, HAN Fei. Forming limit of sheet metals based on different hardening models [J]. Chinese Journal of Mechanical Engineering, 2007, 43(8): 60-65. (in Chinese)
[15] WANG Hai-bo. Yielding and hardening behavior and forming limit for sheet metal under complex loading paths [D]. Beijing: School of Mechanical Engineering and Automation, Beihang University, 2009: 96-98. (in Chinese)
[16] WANG Hai-bo, WAN Min, WU Xiang-dong, YAN Yu. The equivalent plastic strain-dependent Yld2000-2d yield function and the experimental verification [J]. Computational Material Sciences, 2009, 47(1): 12-22.
[17] FRIEDMAN J P. Effects of plastic anisotropy and yield criteria on prediction of forming limit curves [J]. International Journal of Mechanical Sciences, 2000, 42(1): 29-48.
[18] BUTUC M C, BANABIC A, BARATA R, GRACIO J J, DUARTE J F, JURCO P, COMSA D S. The performance of Yld96 and BBC2000 yield functions in forming limit prediction [J]. Journal of Materials Processing Technology, 2002, 125-126(9): 281-286.
[19] WANG L, LEE T C. The effect of yield criteria on the forming limit curve prediction and the deep drawing process simulation [J]. Journal of Machine Tools and Manufacture, 2006, 46(9): 988-995.
[20] BANABIC D, DANNENMANN E. Prediction of the influence of yield locus on the limit strains in sheet metals [J]. Journal of Materials Processing Technology, 2001, 109(1-2): 9-12.
[21] STEFAN C S. Theoretical considerations upon the MK model for limit strains prediction: The plane strain case, strain-rate effects, yield surface influence, and material heterogeneity [J]. European Journal of Mechanics A-Solids, 2010, 29(6): 938-950.
[22] DASAPPA P, INAL K, MISHRA R. The effects of anisotropic yield functions and their material parameters on prediction of forming limit diagrams [EB/OL]. http://dx.doi.org/10.1016/j.ijsolstr.2012.04. 021.
[23] BARLAT F, BREM J C, YOON J W, CHUNG K, DICK R E, LEGE D J, POURBOGHRAT F, CHOI S H, CHU E. Plane stress yield function for aluminum alloy sheets-part I: Theory [J]. International Journal of Plasticity, 2003, 19(9): 1297-1319.
[24] HAN Fei. Post-yield behavior and stress forming limit of plastic deformation for aluminum alloy sheet [D]. Beijing: Beihang University, 2008: 74-76. (in Chinese)
[25] YOSHIDA K, SUZUKI N. Forming limit stresses predicted by phenomenological plasticity theories with anisotropic work- hardening behavior [J]. International Journal of Plasticity, 2008, 24(1): 118-139.
����Ӧ��-Ӧ���ϵ��5754O���Ͻ����μ���Ӱ��
������1���� ��2���� ��1
1. ������ҵ��ѧ ���繤��ѧԺ������ 100144��2. �������պ����ѧ ��е���̼��Զ���ѧԺ������ 100191
ժ Ҫ��Ϊ�˺����������������������ߣ�������һ��������Swift������Ӧ����Ӧ���ϵ��������������Ӧ����Ӧ���ϵ������Yld2000-2d���������5754O���Ͻ��ij��μ���Ӧ��ͼ(FLD-strain)��ͨ���Ա����ۺ�ʵ���������ֻ���������Swift�͵�Ӧ����Ӧ���ϵ�������FLD-strain�ܹ�����������ʵ��������Ȼ���õ�Voce��Ӧ����Ӧ���ϵ�ܹ���ȷ���������ȱ��νεı�����Ϊ�������ڸ�Ӧ����Ӧ���ϵ�����FLD-strain���Ե���ʵ������������������ϵ�ǿ����Խ������Ӧ�ij��μ���ҲԽ�ߡ�Ϊ�����������ڷǾ��ȱ��νεı�����Ϊ�ͳ��μ��ޣ�������һ������ȷ������������Ӧ����Ӧ���ϵ�ķ�����
�ؼ��ʣ����Ͻ𣻳��μ��ޣ��������ϣ�����Ӧ����Ӧ���ϵ���Ǿ��ȱ���
(Edited by LI Xiang-qun)
Foundation item: Project (51005010) supported by the National Natural Science Foundation of China
Corresponding author: WANG Hai-bo; Tel: +86-10-88801821; E-mail: rock_haibo@126.com
DOI: 10.1016/S1003-6326(11)61473-8
Abstract: A modified Swift type flow stress��strain relation was presented in order to describe the uniaxial tension test curve reasonably. The FLD-strain (forming limit diagram made up of limit strain) of 5754O aluminum alloy sheet was calculated based on the two flow stress��strain relations using Yld2000-2d yield function. By comparing the theoretical and experimental results, it is found that the calculated FLD-strain based on the modified Swift flow stress��strain relation can reasonably describe the experimental results. However, though the common Voce flow stress��strain relation can describe the deformation behavior during homogenous deformation phase accurately, the FLD-strain calculated based on it is obviously lower than the experimental result. It is concluded that the higher the hardening rate of sheet metal is, the higher the forming limit is. A method for determining the reasonable flow stress��strain relation is recommended for describing the material behavior during inhomogenous phase and the forming limit of sheet metal.
