

J. Cent. South Univ. (2021) 28: 2140-2157
DOI: https://doi.org/10.1007/s11771-021-4758-y

Ground-borne vibration generated by high-speed train viaduct systems in soft-upper/hard-lower rock strata
XING Meng-ting(������)1, 2, WANG Ping(��ƽ)1, 2, ZHAO Cai-you(�Բ���)1, 2,WU Xue(��ѩ)1, 2, KANG Xiu-shan(����ɽ)3
1. Key Laboratory of High-Speed Railway Engineering (Ministry of Education),Southwest Jiaotong University, Chengdu 610031, China;
2. School of Civil Engineering, Southwest Jiaotong University, Chengdu 610031, China;
3. China Construction Third Engineering Bureau Co.Ltd, Wuhan 430000, China
 Central South University Press and Springer-Verlag GmbH Germany, part of Springer Nature 2021
Abstract:
An experimental study and theoretical analysis were carried out to explore the ground-borne vibration generated by elevated high-speed railway in rock strata. Taking a typical rail line constructed on rock area in China as the research object, a set of field tests was performed on Rizhao-Lankao High-Speed Railway, the bridge and ground vibrations were measured as trains passed at 330-340 km/h, then the transferring law and spatial distribution under individual frequencies were investigated. The experiment results indicate that the bridge frequency spectrum exhibited relatively high-frequency vibration peaks caused by short-wavelength irregularity; ground vibration farther than 30 m away can be amplified with a higher frequency and numerous components. Furthermore, the wave propagation equation of a stratified rock strata was established based on direct-stiffness method to explore the vibration attenuation rules via frequency-domain analysis. It is found that the rock area has a weaker correlation between vibration transmissibility and frequency, thicker and harder rock strata loss their vibration attenuation capacity. It can be concluded that the high-speed railways induced vibration on rock strata shows a wide frequency band and large amplitude, the design of reducing vibration aimed at specific frequency is important according to next more detailed numerical study.
Key words:
rock stratum; vibration and wave; elevated high-speed railways; in situ test; transferring law��
Cite this article as:
XING Meng-ting, WANG Ping, ZHAO Cai-you, WU Xue, KANG Xiu-shan. Ground-borne vibration generated by high-speed train viaduct systems in soft-upper/hard-lower rock strata [J]. Journal of Central South University, 2021, 28(7): 2140-2157.
DOI:https://dx.doi.org/https://doi.org/10.1007/s11771-021-4758-y1 Introduction
Railway viaducts are important traffic systems that have recently emerged during the rapid development of high-speed railways (HSRs) in many countries. As a densely-networked country, China has numerous HSR lines that extend over 31000 km, and a substantial amount of this area is elevated. The emergence and increase of railways lines have provided a rapid and convenient traffic medium with great social and economic benefits. However, the vibration and noise induced by running trains in railway systems inherently act as environmental pollution that can cause direct or indirect annoyance to humans, disturbance to sensitive instrumentation, and even damage to buildings [1]. With the rapidly growing complaints about ground vibration, the railway-induced vibration problem has attracted substantial attention as an important environmental issue. Researchers have previously conducted numerous field experiments to investigate the related vibration characteristics. Moreover, several indicators have been proposed to evaluate the influences of vibration. Various methodologies were developed to predict vibration levels, and many mitigation measures by which to control vibration have been put forward.
Ground-borne railway vibration is a multi-field coupling system that involves the vehicle, track, substructure, and soil. The wheel/rail interaction as a train runs along a vertically stratified track will be transmitted downward to the ground, and causes two environmental problems. The first is a low-frequency vibration in the range of 1-80 Hz, which can be perceived by residents as a whole-body vibration. The second is a higher-frequency vibration in the range of 16-250 Hz, which can be radiated as ground-borne noise inside buildings [2]. Field test research is an integral component of study of the ground-borne vibration issue, as the measured data obtained by experiments expand the understanding of environmental vibration characteristics in both the time and frequency domains. This is helpful for the provision of validation for theoretical or numerical prediction models. Although some research provided experimental data for the validation of developed models, the experimental results have often not been further explored [3-5]. CONNOLLY et al [6, 7] collected experimental ground vibration data from different sites in Europe. These data provided new insights into the characteristics and uncertainties related to ground-borne railway vibration prediction, but the research was not conducted at comprehensive test sites that involve all the relevant components. CORREIA et al [8, 9] investigated the ground characterization, the track characterization, and railway-induced vibration in a field test of a Portuguese railway network. The results were helpful to the in-depth understanding of the ground-borne vibration problem, and reliable experimental data were collected for validation. Unfortunately, the data recorded for the ballasted railway on an embankment are not sufficient for extrapolation to other types of rail transit.
Compared to subgrade sections and underground lines, ground vibration induced by elevated HSR trains is not fully understood, especially from the perspective of field tests. JU et al [10] conducted on-site measurements of ground vibration on a railway bridge caused by an operating train of the Taiwan High Speed Rail (THSR), and performed frequency-domain analysis on the test data. XIA et al [11] carried out tests of ground and building vibrations caused by elevated rail transit, which determined the relationships between ground vibration and vehicle speed. ZHAO et al [12] measured the ground vibration levels of an HSR train passing at a speed of 120 km/h, and compared the impacts of different track vibration-reduction measures based on the test results. However, the vehicle speeds involved in these previous empirical studies of environmental vibration were usually not high, and the vibration test data for elevated bridge sections involving trains moving at higher speeds were insufficient. LI et al [13] conducted field tests on elevated railways running at 250-385 km/h and analyzed the time- and frequency-domain characteristics of ground vibration data, thereby providing a reference for further research on the prediction and control of the ground vibration of elevated railways. However, the properties of the ground soil were unfortunately not considered.
The influences of the soil (a main transmission path for vibrations) conditions on railway-induced ground-borne vibration, layered soil-pile-structure interactions, and HSR lines on soft ground have been extensively explored [14-16]. However, train-track-bridge-soil coupling vibration systems have usually been over-simplified, and the effects of hard soil and pile-soil interactions on ground vibration have not been thoroughly studied. Various coastal cities in China (e.g., Qingdao, Shenzhen, Xiamen) are located on rock strata with a shallow depth of bedrock, which is quite different from the geological conditions of other cities [17, 18]. To date, research on railway environmental vibration has generally been aimed at such media, while the traffic induced environmental vibration in rock media has been rarely reported. The propagation and attenuation characteristics of medium- and high-frequency vibrations excited by the wheel-rail in a rock medium remain unclear, and measurements and theoretical research are limited. The vibrations with a higher frequency, a wider frequency band, and a higher amplitude resulting from HSR trains excited by high-speed driving will be transmitted to the ground along the track and the substructure, which may cause environmental vibration and secondary noise. Therefore, due to the bottleneck of environmental vibration research as compared with more accurate and faster prediction methods, there exists a need to comprehensively consider various influencing factors and analyze the environmental vibration characteristics of unique research objects. This research would provide actual reference value for the line construction, evaluation standards, and vibration control of related projects.
In this study, the Rizhao-Lankao HSR constructed on shallowly buried strata of typical bedrock is considered. A field test of a simply-supported beam bridge section with a length of 32 m was carried out during the joint test phase of the line, and the vibration responses of the bridge and ground when an HSR train passed at a speed of 330-340 km/h were determined. This study aims to provide experimentally measured data on vibration sources in railways constructed on lesser-studied rock media and ground vibration induced by HSR trains on elevated bridges. The analyses of the environmental vibration characteristics and propagation law of vibrational waves in layered rock strata provide a basis for numerical simulations and guidance for vibration control.
The remainder of this paper is organized as follows. In Section 2, results of in-situ experimental investigations at a Chinese test site. Then, Section 3 reports the bridge vibration levels recorded at different positions, as well as the analysis of measured vibration signals in the time and frequency domains. Section 4 presents the ground vibration levels recorded in the vertical direction up to 60 m from the track centerline. In Section 5, the wave propagation equation of a rock stratum is established based on the direct-stiffness method to explore the vibration propagation laws in the rock medium via frequency-domain analysis. Discussion and conclusions are presented in Sections 6 and 7, respectively.
2 Field experiment
2.1 Timoshenko beam model considering bending-torsion coupling
A field experiment was carried out on China Rizhao-Lankao HSR to investigate the vibration source and attenuation characteristics of an HSR viaduct located on a rock area. The overall length of the section of this rail line from Rizhao to Qufu is about 235 km, along which there are eight stations. The overall length of the section of this rail line from Rizhao to Linyi is about 100 km, along which there are eight stations. The measurement site was between the Rizhao station and Linyi station, and was about 20 km from the Rizhao station.
For the selected viaduct section, the high-speed train consists of 8 ��CRH380A�� vehicles, each of which consist of 4 motor cars and 4 trailers. During the experiment, the running trains were empty, and the axle load was 12 t. The Rizhao-Lankao HSR is a double-line railway with a track spacing of 5 m; the speed of running trains is between 330 and 340 km/h; and the average speed is 335 km/h. The characteristic lengths of a CRH380A vehicle are shown in Figure 1. The main parameters of the test train are listed in Table 1. The characteristic frequencies of the ground vibration generated by the train at a specified speed are defined in Eq. (1):
 (1)
(1)
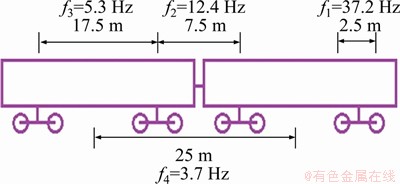
Figure 1 Characteristic lengths of CRH380A vehicle
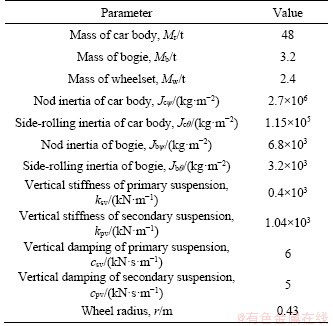
Table 1 Main parameters of CRH380A vehicle
where v represents train speed, km/h; and Li is the characteristic length of the train; f1=37.2 Hz, f2=12.4 Hz, f3=5.3 Hz, f4=3.7 Hz.
The track structure of the experimental high-speed line is a Chinese CRTS III ballastless slab track on a viaduct, as illustrated in Figure 2.
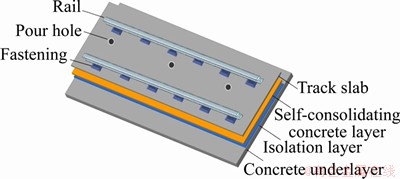
Figure 2 Structural components of Chinese CRTS III ballastless slab track on viaduct
The test bridge and soil layers are shown in Figure 3. The bridge is composed of several simply-supported box girders with a standard span of 32 m. Solid piers with heights of approximately 5 m are supported by eight cast-in-place bored piles. The pier, pier cap, and pile are made of C40 concrete. The test site is a six-layer structure located on the two element strata of soil and rock, and can be characterized as soft in the upper area and hard in the lower area.
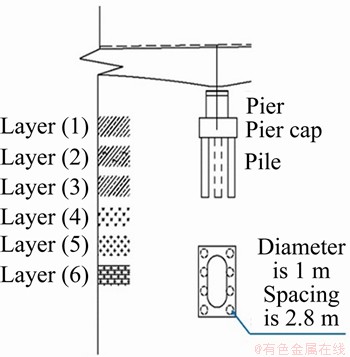
Figure 3 Soil layers and test bridge
2.2 Test equipment
An INV3062SC data acquisition system with a DASP-V11 software system was used in the test. NV 9828 ICP acceleration sensors were installed on steel plates with diameters of 5 cm that were fixed to the bridge and the ground. The sensitivity of the vibration sensors was 500 mV/g, and the measurement range range was 10g. A portable power supply was prepared to recharge the acquisition system and the computer. The sampling frequency was 2048 Hz, and each sampling time was no less than 8 s. A background vibration test was also considered to eliminate the interference to the measured data.
2.3 Test scheme
A mid-span section and pier section were set on the viaduct, as illustrated in Figure 4. A box girder measurement point (B1) and 6 ground measurement points (G1-G6) with respective distances of 0, 7.5, 15, 30, 45 and 60 m from the track centerline of the right high-speed line were arranged at the mid-span. Four measurement points (B2-B5) were respectively arranged at the box girder, bearing, and middle and lower areas of the pier section.
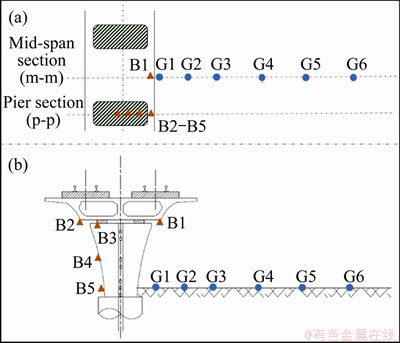
Figure 4 Test scheme
3 Vibration source
3.1 Time-domain characteristic of vertical bridge vibration acceleration
As presented in Figure 5, one set of data from the bridge measurement points was taken as a typical case, and the vertical acceleration time-history curve of each component of the bridge was analyzed. The periodic and continuous loading phenomenon of each carriage can be identified by the time-history curve created from each bridge measurement point. The eight carriages of the HSR train correspond to the eight sections of energy concentration in the figure. The total duration ranged from 2.3 to 4.8 s, and the vibration time was about 2.5 s. According to the distance between the front and rear wheelsets of the HSR train, which was 232.5 m, the vehicle speed was calculated to be v=334.8 km/h. Additionally, when the HSR train entered or left the test section of the bridge, there was a small amount of vibration for a period of time due to the presence of background vibration.

Figure 5 Time-domain vertical bridge accelerations:
As shown in Figures 5(a) and (b), for the measurement points on bottom slabs of the box girder, the amplitude at the mid-span section was significantly higher than that at the bridge pier section, and the time-domain peak particle acceleration (PPA) values were 1.059 and 0.6391 m/s2, respectively. This can be attributed to the large mid-span deflection of bridges.Figures 5(b)-(e) present the vertical accelerations of the measurement points at different heights on the bridge pier section. Along the vertical transmission path of the vibration at the bridge pier section, namely ��bridge deck��support��pier center��pier bottom��, it is evident that the vibration energy exhibited obvious attenuation characteristics under the action of bridge damping, and the PPA at the bottom of the bridge pier was 0.14 m/s2, which is about 0.2 times the acceleration at the bridge deck.
To further analyze the transmission characteristics of the vibration caused by the operation of the HSR train in the vertical space of the bridge, the PPA values of 10 sets of bridge data were calculated, as presented in Figure 6. The acceleration amplitude was found to attenuate rapidly during the transmission from the bottom of the box girder to the middle of the pier via the support, whereas the acceleration decreased slowly from the middle to the bottom of the pier, which was mainly related to the elasticity of the support. Based on the statistical average of the 10 sets of data, the PPA at the bottom of the bridge deck was calculated to be 0.645 m/s2, which is about 5 times that at the bottom of the bridge pier. The PPA of the support was 0.314 m/s2, which is twice that at the bottom of the bridge pier. The PPA of 0.174 m/s2 at the middle of the bridge pier is on the same order of magnitude as that at the bottom of the bridge pier.
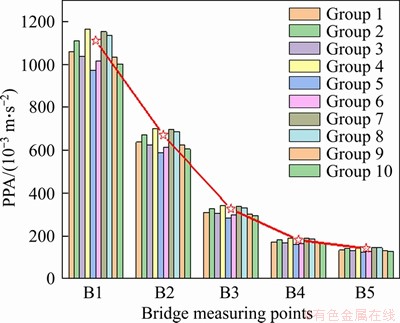
Figure 6 Bridge vibration results
3.2 Frequency-domain characteristic of vertical bridge vibration acceleration
Based on the average of the 10 sets of data, the amplitude spectra from 1 to 800 Hz of all five measured points at different positions are presented in Figure 7. As can be observed, below the frequency of 200 Hz, the acceleration amplitude at each position was large, and the PPA of the entire frequency band appeared. With the increase of the frequency, the vibration response was small at frequencies above 200 Hz. Under the action of the structural damping of the bridge and the elasticity of the support, the acceleration amplitude along the vertical transmission path decreased rapidly. The bottom of the box girder and the support had a large vibration response in the high-frequency range of 400-800 Hz, exhibiting a higher amplitude and wider spectral distribution with peak frequencies of 431 Hz, 674 Hz, etc. This may have been caused by the irregularity of the short-wavelength track with the corresponding wavelength range of 0.14-0.22 m.
Hence, after the wheel-rail dynamic excitation caused by the operation of the HSR train passing through the initial filtering effects of fasteners, track slabs, base plates, and other track components, the vibration response during the transmission to the box girder not only had a PPA concentration within 200 Hz, but also presented a higher frequency vibration of about 650 Hz with a higher amplitude at the bottom plate of the bridge. Under high-speed driving conditions, the rails are not sufficiently polished and the wheels are not smooth, and the short-wavelength excitation of the wheel-rail will generate a massive wheel-rail vertical impact force. Thus, the wheel-rail system vibration tends to have a high frequency and wide range. This high-frequency and wide-range dynamic excitation affects the dynamic characteristics of the track structure, and is also transmitted to the bridge structure after the initial filtering effect of the track components. Therefore, the bridge will exhibit a higher-frequency vibration peak, and the vibration energy will continue to produce a secondary filtering effect in the bridge system.
4 Attenuation law
4.1 Time-domain characteristic of vertical ground vibration acceleration
Figure 8 presents the vertical acceleration time-history curve of each measurement point on the ground within 60 m from the centerline of the track. The vibration response of each measurement point on the ground was also found to exhibit non-stationary characteristics, and there was a local concentration characteristic in the time domain corresponding to the impact load of the wheel and of the HSR train. However, compared with the time history curves of the near-field measurement points, in which the periodic peak values of the wheelset positions can be clearly distinguished, the periodic peak values of the HSR train wheelsets at the far-field measurement points are not evident. This may be because the amplitudes of the far-field measurement points were small, and would therefore have been greatly affected by the background vibration. It might be caused by the influence of the two adjacent bridge piers, and there was a vibration phase difference between different piers.
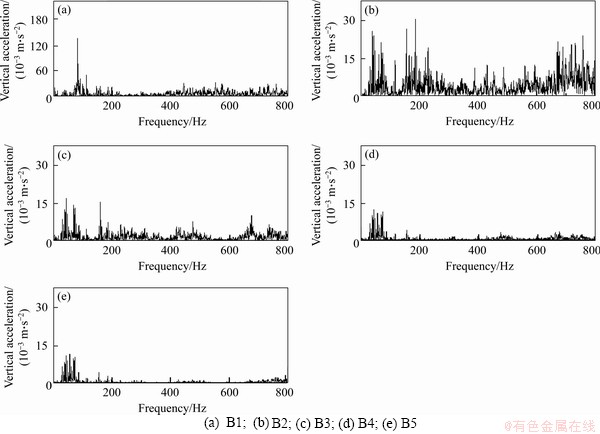
Figure 7 Frequency spectra of vertical bridge vibration accelerations:
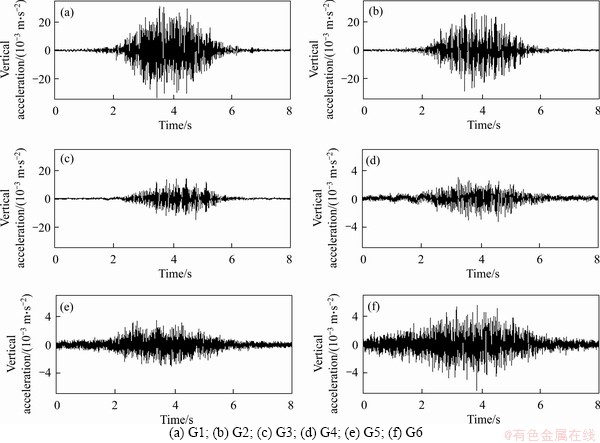
Figure 8 Time-domain vertical ground vibration accelerations:
As shown in Figures 9, the amplitude of ground vibration was higher within 30 m of the bridge pier, and the PPA values of G1, G2 and G3 were 0.031, 0.028 and 0.015 m/s2, respectively. In contrast with the vibration response at the bottom of the bridge pier, the PPA at G1 was reduced to 0.2 times the acceleration of the bridge pier, which is on the same order of magnitude as the energy dissipation of the damping of the bridge structure.
Under the interaction of the bridge pile foundation and the surrounding rock and soil, a tertiary filtering effect based on friction energy was manifested; while this weakened the vibration energy to a certain extent, the amplitude was small.
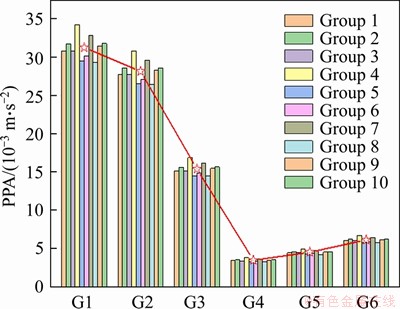
Figure 9 Ground vibration results
To further analyze the attenuation characteristics related to the distance of the vibration source after the HSR train-induced vibration was transmitted to the ground, the PPA values of the 10 sets of data on the ground were calculated, as shown in Figure 9. The attenuation curve of the relationship between the PPA and the distance obtained from the maximum vibration acceleration of each measurement point revealed that, within 30 m from the bridge pier, the vibration peak exhibited an obvious attenuation trend. From the perspective of the vibration attenuation speed, vertical vibration was found to have a relatively slow attenuation speed in the distance range of 0-7.5 m, and the acceleration is 0.0031 m/s2. In the range of 7.5-30 m from the bridge pier, the attenuation speed was faster, with an acceleration attenuation of 0.0246 m/s2.
However, at distances farther than 30 m from the pier, the vibration peak tended to increase slowly, and the phenomenon of vibration amplification appeared. The average PPA values of G4, G5 and G6 were 0.0035, 0.0046 and 0.0062 m/s2, respectively. In other words, the increase in acceleration from 30 to 60 m away from the pier was 0.0027 m/s2, which is roughly on the same order of magnitude as the attenuation in the range of 0-7.5 m.
4.2 Frequency-domain characteristic of vertical ground vibration acceleration
Figure 10 presents the amplitude spectra of the ground vibration measurement points from 1 to 100 Hz and the corresponding background vibration while considering the strong disturbance environment in the field area.
By comparing the vibration of the measurement points with the background amplitudes, it is evident that the acceleration amplitudes of the near-field points were larger, and the influence of the background vibration was almost negligible. However, with the increase of distance, the acceleration amplitudes of the far-field points decreased, and the background vibration with a small vibration magnitude may have also affected the spectral characteristics of the ground measurement points. Therefore, when analyzing the vibration levels and peak frequencies of far-field measurement points, the influence of the background vibration should be considered to ensure the validity of the test data.
As presented in Figure 10, within 7.5 m from the bridge pier, the measurement points G1 and G2 were found to have higher amplitudes in the main frequency band of 20-90 Hz, and the PPA values of 4, 13, 26, 30, 39, 48, 57, 75 and 83 Hz appeared. There also existed acceleration values at 19 Hz close to zero. Which corresponded to the lowest vibration level of the bridge at 20 Hz, as mentioned previously. Based on the ground vibration spectral analysis, the mechanism that could not be summarized in the time domain can be effectively explored. Based on the dominant frequency distribution of the ground measurement points, the resonance frequency laws of the bridge pier and the surrounding soil mass vibration caused by the periodic loading of the HSR train can be summarized as follows: 1) Via a simplified formula [19], the resonance frequency of the unsprung mass of the HSR train on the elastic support track was calculated to be about 50 Hz, and the value of 48 Hz in the figure coincides with the peak frequency of the wheel-rail force. 2) There were multiple spectral peak points in the ground acceleration curve; the values of 4, 13, and 38 Hz in the figure can be respectively regarded as the resonance frequencies caused by the periodic loading of the length of the car yard, the fixed spacing between the front and rear bogies of adjacent vehicles, and the fixed wheelbase. Among them, the excitation frequencies of the fixed spacing between the front and rear bogies of adjacent vehicles and the fixed wheelbase are the main contributors to the vibration response amplitudes of the ground measurement points. 3) The high-order vibration modes of the bridge components may cause resonance at frequencies of 57 Hz and above. 4) The distance excitation frequency modulates the vibration response spectrum, and the amplitude of the ground acceleration is zero when f=(k+0.5) f3(k=3) [20].
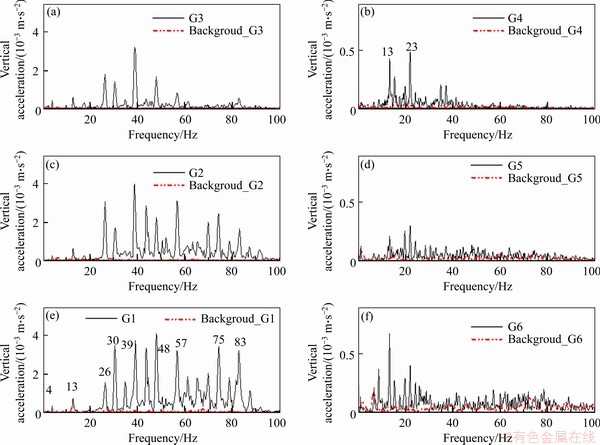
Figure 10 Ground vibration FFT spectra
Regarding the frequency-domain transfer characteristics, the vibration energy was found to gradually attenuate with the increase of distance, and the attenuation rate of high-frequency vibration was higher than that of low-frequency vibration. The acceleration amplitudes of the measurement points G1, G2, G3 and G4 were relatively large at frequencies below 50 Hz, and the PPA of the entire analysis frequency band appeared, which was the main frequency band of ground vibration. In contrast, with the increase of the frequency, the vibration response amplitudes of frequencies above 50 Hz were quite small. Nevertheless, the measurement points farther than 30 m from the pier exhibited a trend of abundant high-frequency components and an increasing acceleration amplitude in the 50-80 Hz frequency band. Due to the attenuation of high-frequency components, the proportion of low-frequency components increased, and the main frequencies of the far-field ground measurement points moved to low frequencies. The measurement point G6 at 60 m exhibited multiple low-frequency PPAs, such as at 13 and 23 Hz; 23 Hz may be the manifestation of the previously-mentioned dominant frequency at different distances under the dispersion characteristics of layered soil. It can be concluded that the inherent properties of the rock medium significantly affected the frequency-domain amplitude and frequency distribution of the far-field ground vibration response.
The vibration energy after the secondary filtering effect of the bridge was transferred to the soil, and the tertiary filtering effect was first carried out under the coupling action of the bridge pile foundation and the upper soil strata. Under the geometric and material damping of the upper soil strata, most of the frequency spectrum components above 50 Hz were dissipated. And due to the large total vibration of the soil under the rock medium geological condition, the near-field ground measurement points exhibited the vibration characteristics of a small amplitude and low frequency. It can be inferred from this that high-frequency components tend to be abundant at ground measurement points farther than 30 m from the far-field. This may be closely related to the soft-upper/hard-lower strata with a dual soil-rock structure where the test line is located. Under this unique geological condition, the performance of the layered soil varies greatly. The material damping of the lower rock strata is quite small, which is caused by the multiple refraction and reflections due to the interface effect when elastic waves propagate to the soil-rock interface and the interface of each rock stratum at a certain incident angle. The elastic waves with specific wavelengths have high reflected energy and low transmitted energy, resulting in increased vibration in certain frequency bands at different far-field ground measurement points.
4.3 Frequency-domain characteristic of vertical ground vibration acceleration
Because the measured acceleration amplitude was small, this section defines the transmission ratio R to intuitively reflect the spatial distribution characteristics of the vibration energy on the ground perpendicular to the direction of the HSR line. R represents the ratio between the vertical accelerations of the measurement point on the ground and the measurement point at the bottom of the pier, as given by Eq. (2):
 (2)
(2)
where aground is the vertical acceleration of the measurement point on the ground, m/s2; and apier is the vertical acceleration of the measurement point at the bottom of the pier, m/s2. When R is negative, the vibration energy is attenuated after being transmitted to the ground through the soil; otherwise, the vibration energy is strengthened after being transmitted through the soil to the ground.
The main frequency bands of the ground measurement points at different distances from the vibration source were found to be different. To further explore the spatial distributions and transmission characteristics of the vibration source on the ground after attenuation and those after being filtered by the pile foundation and rock/soil, four frequencies (30, 39, 57 and 75 Hz) were selected for analysis based on the peak frequencies of the near-field points. Additionally, based on the peak frequencies of the far-field points, the frequencies 13 and 23 Hz were selected for analysis. The spatial distribution of a single frequency acceleration amplitude on the ground was analyzed, as presented in Figure 11. Due to the dispersion characteristics of the layered soil, the single-frequency transmission ratio appeared as a waveform in the spatial domain. For medium and high frequencies above 30 Hz, the vibration energy exhibited an overall attenuation trend with the increase of the distance, and the maximum attenuations at 30, 39, 57 and 75 Hz reached 8.9, 2.9, 4.0 and 2.5 dB, respectively. However, for low frequencies below 23 Hz, the vibration was hardly attenuated with the spatial distance, and was strengthened outside the 30 m range. Because the acceleration amplitudes of multiple frequencies at G5 and G6 slowly increased, the vibration amplification phenomenon was reflected in the time domain via frequency superposition. By further observation of the transmission ratio from G1 to the bottom of the pier, it was found that only the vibration at 30 Hz was reduced to 3 dB, and there was almost no attenuation at other frequencies. The coupling relationship between the pile foundation-rock system was weak, and the ground vibration level near the center of the HSR line was relatively higher.
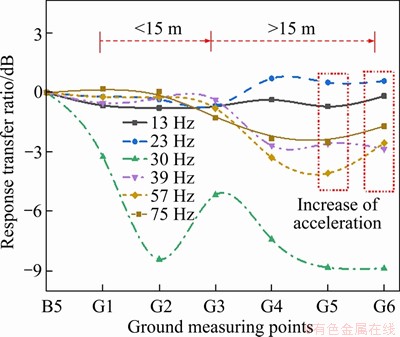
Figure 11 Spatial distribution of response transfer ratio of each single-frequency acceleration
The two propagation attenuation paths of vibration were the radiation attenuation caused by the different distances from the vibrating body, and the damping attenuation caused by the different dynamic characteristics of the layered soil. According to the change trend of the transfer ratio curve within 15 m and away from the ground, it is considered that the near-field area was dominated by radiation attenuation, while the far-field vibration was significantly affected by damping attenuation. The rock strata were found to have a weak filtering effect on vibration, and such a geological condition will contain more high-frequency components under the short-wavelength irregularity excitation of the HSR. The frequency spectrum of the far-field area was therefore abundant. Thus, for the evaluation of the environmental vibration of an HSR on rock strata, both the near-field area and the dominant frequency band of the vibration source should be combined to measure the far-field vibration level. It is suggested that the vibration environment evaluation scope under such geological conditions should be expanded to at least 60 m, and should be present on both sides of the railway centerline.
4.4 Vibration evaluation
The ��Urban Area Environment Vibration Standard�� (GB 10070-88) [21] and the ��Urban Rail Transit-induced Building Vibration and Secondary Radiation Noise Limits and Measurement Methods Standards�� (JGJ/T 170-2009) [22] are the current standards in China used to evaluate the environmental vibration level of rail transit, and their focuses are different. Aiming at reflecting the human body��s response to vibration, VLZ,max is adopted in GB10071-88 to evaluate the intensity of the vibration source and the ground vibration level. To reflect the impact of HSR train operation on building vibration, the maximum vibration attenuation level (VALmax) is used in GJ/T 70-2009 [26] to evaluate the indoor vibration level. At present, there is much confusion surrounding the calculation of different evaluation indicators, which affects the evaluation of environmental vibration levels. This may even further affect the planning and design of HSR lines. In this section, the calculation methods of VLZ,max and VALmax, and the differences between the two, are discussed.
VLZ,max adopts 1 s weighting. The vertical time-history signals are divided into several waveforms for analysis, and each waveform undergoes 1/3 octave band analysis to determine the frequency division vibration level corresponding to each center frequency. The Z vibration level of the waveform can be calculated according to Eq. (3), and the change of the Z vibration level with time can be calculated in turn.
 (3)
(3)
where VLZ is the Z-weighted vibration acceleration level, dB; Li is the vibration acceleration level of each frequency, dB; and ai is the weighting factor of each frequency band, dB. The maximum value of the Z vibration level during the test period was VLZ,max.
In this work, VALmax was calculated by the Z-weighted vibration level of the measured vertical vibration acceleration signals, and the average Z-weighted VALmax of the effective data collected from the 10 train trips were used as the evaluation indicator. Because there were multiple measurement points, then the arithmetic mean of all vibration measurement points was taken as the vibration evaluation value.
In the calculation process, the overlap coefficient has a certain degree of influence on VLZ,max and VALmax, and the frequency weighting curve has a significant impact on VLZ,max [23]. To reflect the influence of the environmental vibration of elevated sections of HSRs in rocky areas more accurately, the overlap coefficient was set to 3/4, and the weighting factors at the different frequencies of whole-body vibration specified in ISO 2631-1: 1997 [24] were corrected to obtain the Z vibration level. The two evaluation indicators were then used to evaluate the vibration level.
A set of valid test data at the ground measurement points was taken as a typical case, and the change of the Z vibration level with time was analyzed, as shown in Figure 12. It presents the curves of the change of vibration intensity with time, from which it can be seen that the Z vibration levels at the far-field measurement points reached the maximum values earlier than those at the near-field measurement points. The values of VLZ,max at the ground measurement points G1, G2, G3, G4, G5 and G6 were 74.0 dB at 4.75 s, 70.1 dB at 4.25 s, 62.5 dB at 4.75 s, 51.9 dB at 3.5 s, 58.3 dB at 2.75 s, and 61.6 dB at 2.75 s, respectively.

Figure 12 Trend of VLZ as function of time
Figure 14 presents the 1/3 octave spectrum of acceleration at each ground measurement point. The vibration responses at different ground positions presented relatively consistent frequency distribution characteristics. This consistency is reflected in the appearance of PPA around 63-100 Hz. The values of VALmax at the ground measurement points G1, G2, G3, G4, G5 and G6 were 75.6 dB at 80 Hz, 73.3 dB at 63 Hz, 70.0 dB at 63 Hz, 50.2 dB at 80 Hz, 51.3 dB at 100 Hz, and 55.35 dB at 100 Hz, respectively.
According to the calculation results, the values of VLZ,max and VALmax at the same location on the ground were different, and the difference at the ground measurement points G1, G2, G3, G4, G5 and G6 was -1.6 dB, 3.2 dB, 7.5 dB, -1.7 dB, -7.0 dB, and -6.3 dB, respectively. Hence, it is difficult to reflect the true vibration level with only a single evaluation indicator. In the evaluation of environmental vibration intensity, it is necessary to simultaneously consider the spatial location and vibration frequency, and to establish multi-dimensional evaluation parameters.
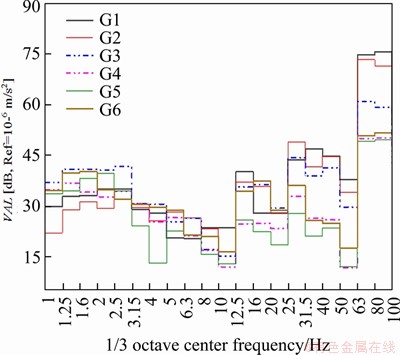
Figure 13 Z-weighted vibration level
5 Vibration wave propagation in layered rock medium
5.1 Vibration transmission system of layered rock medium
To further study the transmission excitation of vibration waves in a rock medium, the direct-stiffness method based on the transfer matrix approach was adopted to establish a model of the vibration transmission system of a rock stratum, and the ground response of layered media due to harmonic loading was obtained [25-27]. As the railway-induced vibration related to the impact on receivers is mainly in the vertical direction, the in-plane wave propagation (P-SV waves) is analyzed in this paper. In the wavenumber-frequency domain, the fundamental wave propagation equation corresponding to P-waves and SV-waves can be given by Ref. [26].

 (4)
(4)
where superscript ��~�� denotes the quantity in the frequency-domain wave; ISV and IP are the incident wave potentials that can be collected in subvector  and RSV and RP are the reflected wave potentials that can be collected in subvector
 Via an inverse Fourier transform of the horizontal wavenumber kx to the horizontal coordinate x, and from the frequency �� to the time t, the wave potentials in the time-space domain, namely ��(x, z, t) and ��(x, z, t), can be respectively written as follows:

 (5)
(5)
The transformed displacement can be expressed as:


 (6)
(6)
In the equation, the part of the displacement vector associated with the P-wave is parallel to the wave propagation vector, and the part associated with the S-wave is perpendicular to the wave propagation vector.
Because only the outgoing waves propagating in the positive Z-direction are considered, the displacement response of a rock medium with n-1 layers on a half-space can be expressed as:

 (7)
(7)
where  is a complex symmetrical stiffness matrix of the rock medium, and the stress equilibrium between two layers i-1 and i can be written as follows.
 (8)
(8)
5.2 Dynamic response of field test section
According to the geological conditions determined from the geological survey data, the soil of the test site was simplified to a homogeneous three-layer structure consisting of, from top to bottom, a soft soil stratum, a moderately-weathered soft rock stratum, and slightly-weathered and non-weathered hard rock stratum. The rock and soil were considered as an isotropic and homogeneous elastoplastic body, and the model parameters are listed in Table 2. By applying a unit harmonic load at 0 m on the ground, F(t)=cos(2��ft)��(x-vt), the propagation characteristics of elastic waves in the rock strata in the frequency band of 1-100 Hz were analyzed.
Figure 14 presents the spatial distribution of the ratio of the displacement amplitudes of each observation point on the ground and the original excitation point within 60 m from the vibration source, as well as its variation with the load frequency. The figure plots the vibration transmissibility of the rock-soil system computed for vertical displacements (VTuz), which is defined as:
 (9)
(9)
where 
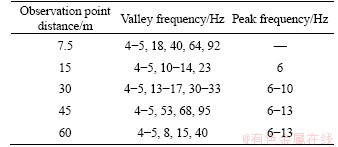
As shown in Figure 14, the curves exhibit obvious valleys at specific frequencies or frequency bands, at which points the displacement response amplitudes were small, the vibration level was low, and the system attenuation capacity was strong. On the contrary, there are evident peaks at specific frequencies or frequency bands, at which points the displacement response amplitudes were larger, the vibration level was higher, and the system attenuation capacity was weak. The sensitive frequencies at different spatial positions are listed in Table 3.
Combined with Figure 14 and Table 3, at a periodic loading frequency of 4-5 Hz, the ground vibration attenuation was evident, and the spatial distribution was relatively consistent. In contrast to the position at 15 m, there were multiple valleys of attenuation frequencies at the observation point at 7.5 m, whereas the time-domain acceleration amplitude reflected in the actual on-site measurement did not show a vibration enhancement zone at 15 m; this is mainly related to the dominant frequency of the vibration source. Based on the single-frequency vibration response transfer characteristics revealed in the experiment, the six dominant single frequencies of 13, 23, 30, 39, 57 and 75 Hz were selected for further investigation, and the spatial distribution of vibration transmissibility under rock strata conditions was analyzed. For the near-field measurement points within 30 m, attenuation valleys appeared at the dominant single frequencies of 13, 23 and 30 Hz at the 15 and 30 m measurement points. The test results reflect that the vibration attenuation amplitude at 30 Hz was the largest, whereas the attenuation valleys at the 7.5 m measurement point deviated from the dominant single frequencies. Therefore, the overall vibration energy exhibited a significant attenuation characteristic with the increase in distance, which is consistent with the measured results. However, for the far-field measurement points beyond 30 m, attenuation peaks of the 45 and 60 m measurement points both appeared at 13 Hz, i.e., the geotechnical system had a weak attenuation capacity for this sensitive frequency, and the 30-m measurement point had an attenuation valley at 13 Hz. Therefore, it can be effectively verified that the vibration amplification phenomenon at the G5 and G6 measurement points revealed in the test results was caused by the low-frequency attenuation characteristics of the rock-soil vibration transmission system in the far-field area.
Table 2 Properties adopted for the soil of field test section
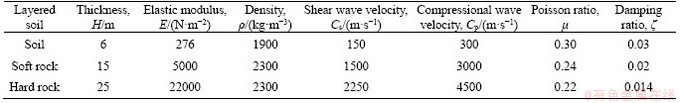
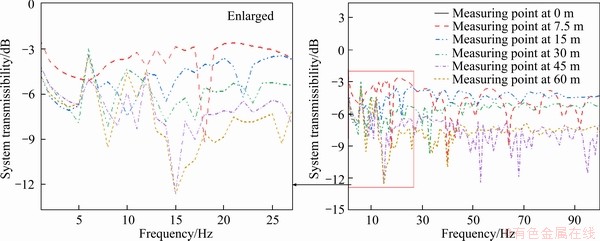
Figure 14 Spatial distribution of vibration transmissibility under different loading frequencies
Table 3 Sensitive frequencies of observation points
5.3 Different geological conditions
To further explore the transmission characteristics of the layering and lithology of the rock strata and soil mass in response to vibration waves, 6 different geological conditions were set up based on the measured sections of the project (Case 1), which were combined with the characteristics of the overlying soil strata in the rocky and weathered rock areas. The specific settings are reported in Table 4.
For Cases 1, 2 and 3, the geological condition was a soft-upper/hard-lower dual soil-rock structure. There was a soil stratum of a certain thickness above the shallow bedrock, which is a condition with significant differences in mechanical characteristics. For Cases 4, 5 and 6, the geological conditions were a rock strata structure. According to the weathering characteristics of the rock, two levels of soft rock and hard rock, as well as the rock strata distribution condition with different burial depths of hard rock, were considered. The transmissibility of different systems at each observation point varied with the load frequency, as presented in Figure 15.
For the observation point at 0 m, the overall vibration transmission attenuation capacity under the geological condition of the soil strata was much greater than that under the rock geology. When the geological condition was the dual soil-rock strata, the transmissibility exhibited significant fluctuation characteristics with the frequency. By comparing Case 1 and Case 2, it is evident that when the thickness of the upper soil strata was constant, as the lower rock layer was harder, the total attenuation decreased. The fluctuation trends of the transmission curves were basically the same, though there was a slight difference in the attenuation amplitude at a specific frequency. A comparison of Case 2 and Case 3 reveals that when the lower rock strata were consistent, with the increase of the thickness of the upper soil strata, there was a significant difference between the fluctuation trends of the transmission curves, the attenuation amplitudes of frequencies above 8 Hz all increased, and the decrease in the 18-34 Hz frequency band was the most evident.
However, when the geological condition was the rock strata, the vibration transmissibility fluctuated little with changes in the frequency. According to Cases 4, 5 and 6, as the upper strata became harder, the difference in transmission at each frequency was less significant. The curve of Case 6 is close to a straight line, and the curve of Case 4 only has a valley frequency at 30 Hz.
Table 4 Vibration transmission system under different geological conditions
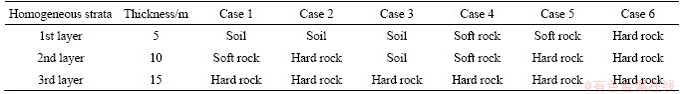
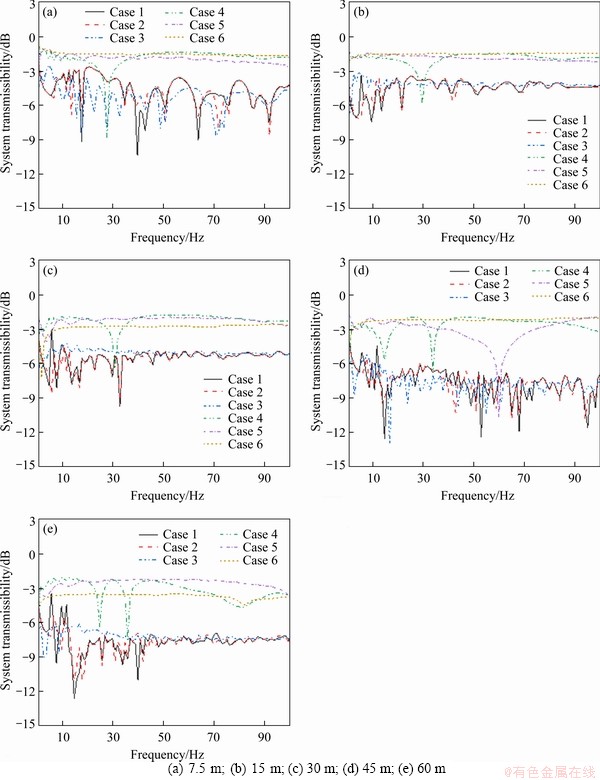
Figure 15 Vibration transmissibility at different positions:
The vibration transmission characteristic curves of the 15 and 30 m measurement points are roughly the same. For the dual soil-rock strata, the system transmissibility fluctuated with the frequency in the low-frequency range, and hardly changed in the middle- and high-frequency range. Under the geological condition of the thick upper soil stratum, the vibration attenuation capacity of the soil was weak, and the ground vibration may have exhibited an increased amplitude at this spatial position, which is consistent with the environmental vibration amplification found in the soil strata area; in contrast, the rock strata condition was consistent with the variation at the 7.5 m distance in the experiment. However, the transmission characteristics of the system at a longer spatial distance varied substantially. For the measurement point at 45 m, Case 4 presents two valleys in the mid- to low-frequency range of 15-33 Hz, a valley appears at 60 Hz in Case 5, and the curve of Case 6 is close to a straight line. For the measurement point at 60 m, two valleys appear in the mid- to low-frequency range of 25-35 Hz in Case 4, and there is a valley at a high frequency around 80 Hz.
In summary, the transmission characteristics of vibration in a rock medium are quite different from those in general soil strata. When the rock strata are thicker, the grade is harder, the attenuation difference of the soil system under every single frequency is smaller, and the vibration attenuation capacity becomes weaker. At this time, the amplitude of the vibration source at each frequency has an equally important effect on the ground vibration response, and focus should not be placed only on the dominant frequency band. The environmental vibration under such geological conditions has two major characteristics, namely a wide frequency band and a large amplitude, and new evaluation indicators must be identified to assess the vibration level and carry out research on vibration control strategies in a wider frequency band.
6 Discussion
To study the environmental vibration characteristics of a rock medium in an elevated section of an HSR, the high-frequency vibration characteristics of the wheel-rail system under short-wave excitation should be considered. Moreover, the vibration source intensity characteristics of the track and the bridge structure under the filtering effect should be analyzed. Then, by exploring the transmission law of vibration waves in the pile foundation and rock/soil, the ground vibration response characteristics will be revealed, and the influencing scope and level of environmental vibration due to rail transit in such areas will be clarified, thereby allowing for the development of specific control methods. In this work, the vibration source intensity characteristics and ground vibration response of an elevated bridge on rock strata were preliminarily investigated, mainly via field tests, and the test results were analyzed by the soil vibration system transmission model, which is not sufficiently comprehensive. Therefore, in follow-up research, there is a need to establish a vibration prediction method of elevated rail transit on rock strata based on the present research to reasonably reflect the rock medium characteristics and the pile-rock coupling relationship. This is also required to fully consider the geometric track irregularities and transmission attenuation laws of high-frequency vibration caused by short-wavelength wheel-rail excitation along the ��track��bridge��pile foundation��layered rock strata�� path. Via theoretical and numerical research, the environmental vibration characteristics of rail transit in related areas can be revealed, and vibration evaluation methods can be improved to guide the design of vibration control measures.
7 Conclusions
In this work, to explore the environmental vibration characteristics of the rock medium in elevated sections of HSRs, China��s Rizhao-Lankao HSR, which is located in a typical rock strata area, was selected for field tests and research. The vibration source intensity and ground vibration response of the bridge were measured. The actual engineering geological conditions were taken as a reference, and a model of the vibration transmission system of layered rock strata was established. Additionally, the spatial distributions of the displacement amplitude and frequency-domain transmissibility of different types of strata systems under harmonic loads were discussed. The following conclusions can be drawn:
1) The vibration caused by the interaction of the wheel-rail system under the excitation of an HSR train, which is characterized by a large frequency range and large amplitude, exhibited evident attenuation characteristics in the bridge structure along the vertical transmission path of ��bridge deck��support��pier center��pier bottom��. The PPA of the bottom measurement point of the pier was reduced to 0.2 times that of the bridge deck, and the high-frequency excitation force caused by the short-wavelength irregularity of the wheel and rail had a greater impact on the bottom plate of the box girder and support. The bridge components had relatively high-frequency vibration peaks, and the dominant frequency bands were close to the middle and high frequencies.
2) Under the coupling action of the bridge pile foundation and the surrounding rock and soil, a tertiary filtering effect based on friction energy occurred, which weakened the amplitude of the vibration energy. Nevertheless, due to the weak coupling relationship of the pile-rock system, the acceleration amplitude at the ground measurement point 0 m from the track centerline remained large. The amplitude of ground vibration farther than 30 m from the pier was amplified, and there were many high-frequency components. VLz,max and VALmax are the two types of evaluation standards of the environmental vibration level of rail transit, and the difference between them was found to be as high as 7.5 dB; this will affect the evaluation results, and can even further affect the planning and design of the HSR lines. Thus, it is necessary to evaluate the vibration intensity via a combination of the spatial position and the vibration frequency, and to establish multi-dimensional evaluation parameters of environmental vibration caused by HSRs.
3) The soil of the test site was simplified into a homogeneous three-layer structure comprising a soil stratum, a soft rock stratum, and a hard rock stratum, and a layered rock strata vibration transmission system was established. The displacement responses of observation points at different spatial positions on the ground were found to exhibit a fluctuating trend with the frequency. The ground vibration level is determined by the dominant frequency components of the input vibration source and the frequency-domain attenuation characteristics of the transmission medium. The vibration amplification phenomenon of the G5 and G6 measurement points at 45 and 60 m revealed by the actual measurement results could also be verified by the spatial distribution law of the single-frequency system transmissibility. Therefore, for the propagation of vibration waves in rock strata, the sensitive frequencies or frequency bands of vibration attenuation must first be clarified.
4) By analyzing the influences of the layering and lithology of rock strata and soil on the vibration wave attenuation law, it was found that the system transmission characteristics of strata with the dual soil-rock structure and the only-rock strata were quite different. When the rock strata were thicker, the correlation between the system transmission characteristics of the harder rock medium was found to be weaker, as was the frequency, and the vibration attenuation capacity decreased. The ground vibration response was characterized by a wide frequency band and large amplitude.
Contributors
WANG Ping provided the concept of manuscript. XING Meng-ting analyzed the calculated results and wrote the first draft of the manuscript. ZHAO Cai-you conducted the literature review and edited the draft of manuscript. WU Xue and KANG Xiu-shan analyzed the measured data. All authors replied to reviewers�� comments and revised the final version.
Conflict of interest
XING Meng-ting, WANG Ping, ZHAO Cai-you, WU Xue and KANG Xiu-shan declare that they have no conflict of interest.
References
[1] Department of Transportation Federal Railroad Administration. High-speed ground transportation noise and vibration impact assessment [R]. Washington, D.C.,1998.
[2] NTOTSIOS E, THOMPSON D, HUSSEIN M. The effect of track load correlation on ground-borne vibration from railways [J]. Journal of Sound and Vibration, 2017, 402: 142-163. DOI: 10.1016/j.jsv.2017.05.006.
[3] YANG Na, GUO Ting, SUN Guo-zhong. Train-induced vibration on elevated railway station [J]. Journal of Central South University, 2013, 20(12): 3745-3753. DOI: 10.1007/ s11771-013-1903-2.
[4] MOHAMMED M M, ROSLAN H, FIRAS S. Assessment of rapid impact compaction in ground improvement from in situ testing [J]. Journal of Central South University, 2013, 20(3): 786-790. DOI: 10.1007/s11771-013-1549-0.
[5] GUPTA S, DEGRANDE G, LOMBAERT G. Experimental validation of a numerical model for subway induced vibrations [J]. Journal of Sound and Vibration, 2009, 321(3-5): 786-812. DOI: 10.1016/j.jsv.2008.10.014.
[6] CONNOLLY D, GIANNOPOULOS A, FORDE M C. Numerical modelling of ground borne vibrations from high speed rail lines on embankments [J]. Soil Dynamics and Earthquake Engineering, 2013, 46: 13-19. DOI: 10.1016/ j.soildyn.2012.12.003.
[7] CONNOLLY D P, KOUROUSSIS G, WOODWARD P K, GIANNOPOULOS A, VERLINDEN O, FORDE M C. Scoping prediction of re-radiated ground-borne noise and vibration near high speed rail lines with variable soils [J]. Soil Dynamics and Earthquake Engineering, 2014, 66: 78-88. DOI: 10.1016/j.soildyn.2014.06.021.
[8] CORREIA DOS SANTOS N, BARBOSA J, CALCADA R, DELGADO R. Implementation of a three dimensional time domain formulation for the prediction of vehicle induced vibrations [C]// The Tenth International Conference on Computational Structures Technology. 2010.
[9] CORREIA DOS SANTOS N, BARBOSA J, CALCADA R, DELGADO R. Track-ground vibrations induced by railway traffic: Experimental validation of a 3D numerical model [J]. Soil Dynamics and Earthquake Engineering, 2017, 97: 324-344. DOI: 10.1016/j.soildyn.2017.03.004.
[10] JU S H, LIN H T, CHEN T K. Studying characteristics of train-induced ground vibrations adjacent to an elevated railway by field experiments [J]. Journal of Geotechnical & Geoenvironmental Engineering, 2007, 133(10): 1302-1307.
[11] XIA H, CHEN J G, XIA C Y. An experimental study of train-induced structural and environmental vibrations of a rail transit elevated bridge with ladder tracks [J]. Journal of Rail & Rapid Transit, 2010, 224(3): 115-124.
[12] ZHAO Cai-you, WANG Ping, XING Meng-ting, YI Qiang, WANG Liu-cong. Reduction of ground-borne vibrations from rail lines on viaducts by means of elastic anti-vibration mats [J]. Journal of Rail & Rapid Transit, 2019, 233(5): 550-565.
[13] LI Xiao-zhen, ZHANG Zhi-jun, ZHANG Xun. Using elastic bridge bearings to reduce train-induced ground vibrations: An experimental and numerical study [J]. Soil Dynamics and Earthquake Engineering, 2016, 85: 78-90. DOI: 10.1016/ j.soildyn.2016.03.013.
[14] THOMSON W T. Transmission of elastic waves through a stratified solid medium [J]. Journal of Applied Physics, 1950, 21(2): 89-93. DOI: 10.1063/1.1699629.
[15] KIM D S, LEE J S. Propagation and attenuation characteristics of various ground vibrations [J]. Soil Dynamics and Earthquake Engineering, 2000, 19(2): 115-126. DOI: 10.1016/S0267-7261(00)00002-6.
[16] GUPTA S, STANUS Y, LOMBAERT G, DEGRANDE G. Influence of tunnel and soil parameters on vibrations from underground railways [J]. Journal of Sound and Vibration, 2009, 327(1, 2): 70-91. DOI: 10.1016/j.jsv.2009.05.029.
[17] ZHANG Bo, LI Shu-cai, ZHANG Dun-fu, XUE Yi-guo, WANG Xi-ping. Research on rock environments vibration response induced by metro trains in rock media [J]. Chinese Journal of Rock Mechanics and Engineering, 2011, 30(S1): 3341-3347. (in Chinese)
[18] ZHANG Bin, WANG Jian-li, WANG Jian, ZHANG Qi-le, ZHANG Ning. Test analysis of Qingdao rock site vibration transmission characteristics under metro train excitations [J]. Urban Rapid Rail Transit, 2018, 31(3): 40-45. (in Chinese)
[19] AUERSCH L. Ground vibration due to railway traffic��The calculation of the effects of moving static loads and their experimental verification [J]. Journal of Sound and Vibration, 2006, 293(3-5): 599-610. DOI: 10.1016/j.jsv.2005.08.059.
[20] GB 10070-99. National Environmental Protection Agency. Standard of environmental vibration in urban area [S]. Beijing: Press of China Standards, 1989.
[21] JGJ/T 170-2009. Ministry of Housing and Urban-Rural Development of the People��s Republic of China. Standard for limit and measuring method of building vibration and secondary noise caused by urban rail transit [S]. Beijing: China Architectures and Building Press, 2009.
[22] LU W, YAO K, WANG S, et al. Comparison of frequency weighting curves in two versions of ISO 2631-1 [C]// Proceedings of the Chinese Society of Environmental Science. Beijing, 2009: 294-298.
[23] ISO 2631/1-1997. Mechanical vibration and shock��Evaluation of human exposure to whole-body vibration-Part 1: General requirement [S].
[24] THOMSON W T. Transmission of elastic waves through a stratified solid medium [J]. Journal of Applied Physics, 1950, 21(2): 89-93. DOI: 10.1063/1.1699629.
[25] RIZZI S A, DOYLE J F. Spectral analysis of wave motion in plane solids with boundaries [J]. Journal of Vibration and Acoustics, 1992, 114(2): 133-140. DOI: 10.1115/1.2930241.
[26] KAUSEL E, ROESSET J M. Stiffness matrices for layered soils [J]. International Journal of Rock Mechanics and Mining Sciences & Geomechanics Abstracts, 1983, 20(1): A7. DOI: 10.1016/0148-9062(83)91665-0.
(Edited by ZHENG Yu-tong)
���ĵ���
��ʯ�����ܸ�����·���������Լ����ݹ���
ժҪ�������Ե��ͻ���dz��ز����������Ϊ�о���������·�������Խζ�ij32 m��֧��������չ���ֳ����ԡ�����ʱƵ�����������͵�������Ӧ���з������о��˵��Բ���������������µĴ��ݹ�����˥�����ԡ���������������Ŷս�Զ��30 m��Χ֮��ĵ�����ֵ���ַŴ�������ʯ���ʸ�����·�������п�Ƶ�Ρ����ֵ������������-�Ҷ�Ԫ�ṹ�ز�����ʯһԪ�ṹ�ز��ϵͳ�������Բ���ϴ��Ҳ�Խ�ȼ�Խ��Ӳ����ʯ���ʳ�����������Ƶ�ʵ�������ԣ���˥�������½���
�ؼ��ʣ���ʯ���ʣ����벨���ܸ�����·���ֳ�ʵ�⣻���ݹ���
Foundation item: Project(2016YFE0205200) supported by the National Key Research and Development Program of China; Projects(U1734207, 51978585) supported by the National Natural Science Foundation of China
Received date: 2020-08-20; Accepted date: 2021-06-15
Corresponding author: ZHAO Cai-you, PhD, Associate Professor; Tel: +86-15902893274; E-mail: zcy848279@163.com; ORCID: https://orcid.org/0000-0003-1659-0327
Abstract: An experimental study and theoretical analysis were carried out to explore the ground-borne vibration generated by elevated high-speed railway in rock strata. Taking a typical rail line constructed on rock area in China as the research object, a set of field tests was performed on Rizhao-Lankao High-Speed Railway, the bridge and ground vibrations were measured as trains passed at 330-340 km/h, then the transferring law and spatial distribution under individual frequencies were investigated. The experiment results indicate that the bridge frequency spectrum exhibited relatively high-frequency vibration peaks caused by short-wavelength irregularity; ground vibration farther than 30 m away can be amplified with a higher frequency and numerous components. Furthermore, the wave propagation equation of a stratified rock strata was established based on direct-stiffness method to explore the vibration attenuation rules via frequency-domain analysis. It is found that the rock area has a weaker correlation between vibration transmissibility and frequency, thicker and harder rock strata loss their vibration attenuation capacity. It can be concluded that the high-speed railways induced vibration on rock strata shows a wide frequency band and large amplitude, the design of reducing vibration aimed at specific frequency is important according to next more detailed numerical study.
