
Trans. Nonferrous Met. Soc. China 24(2014) 3221-3256
New atom movement mechanism for tracking path on disordering AuCuI ( ) compound
You-qing XIE1,2,3, Hong-jian PENG4, Xin-bi LIU1,2,3, Xiao-bo LI5, Yao-zhuang NIE6
1. School of Materials Science and Engineering, Central South University, Changsha 410083, China;
2. Powder Metallurgy Research Institute, Central South University, Changsha 410083, China;
3. State Key Laboratory of Powder Metallurgy, Central South University, Changsha 410083, China;
4. School of Chemistry and Chemical Engineering, Central South University, Changsha 410083, China;
5. College of Materials Science and Engineering, Xiangtan University, Xiangtan 411105, China;
6. School of Physics and Electronics, Central South University, Changsha 410083, China
Received 13 July 2014; accepted 9 October 2014
Abstract:
Taking experimental path on disordering AuCuI composed of
  and
and  stem alloy genes as an example, three discoveries and a method were presented. The ability of AuCuIto keep structure stabilization against changing temperature is attributed to the fact that the and potential well depths greatly surpass their vibration energies, which leads to the subequilibrium of experimental path. A new atom movement mechanism of AuCuIto change structure for suiting variation in temperature is the resonance activating-synchro alternating of alloy genes, which leads to heterogeneous and successive subequilibrium transitions. There exists jumping order degree, which leads to the existence of jumping Tj-temperature and an unexpected so-called ��retro-effect�� about jumping temperature retrograde shift to lower temperatures upon the increasing heating rate. A set of subequilibrium holographic network path charts were obtained by the experimental mixed enthalpy path method.
Key words:
intermetallics; alloy gene; order/disorder transformation; resonance activating-synchro alternating mechanism; thermodynamic properties; equilibrium and subequilibrium holographic network path charts;
1 Introduction
Four philosophic propositions of system sciences were proposed, which are the systematic structure diversity, systematic properties diversity, systematic correlativity (or entirety) and systematic openness propositions [1], and the systematic metal materials science (SMMS) framework was established [2]. Now, we have proposed a systematic kinetics proposition: ��A system has not only the ability to keep structure stabilization against a changing environment, but also a mechanism to change structure for suiting variation in environments��. It is a philosophic foundation for establishing kinetics of systems. Its scientific connotation can be deeply understood via studying kinetic behaviors on disordering AuCuI ( ), which has been considered a classic paragon with complete order-disorder transition path studied by different experimental techniques and various theories for about a century. However, four foundational questions have been remained without clear-cut answers: 1) Why does the AuCuI() compound keep its order degree unchanging until so much higher Tonset-temperature (about 600 K)? 2) What mechanism controls kinetic behaviors on disordering AuCuI(
 )? 3) How to explain the forming process of the statistic periodic antiphase (SPAP) AuCuII [3,4]? 4) How to explain the retro-effect about the jumping Tj-temperature appearing an unexpected retrograde shift to lower temperatures upon the increasing heating rate [5-7]. These questions are concerned with stable and metastable (or equilibrium and subequilibrium) order-disorder transition paths, as well as atom movement mechanism for studying diffusion, phase transformations and ageing reactions in solids. However, up to now, researchers have got used to recognizing the experimental phenomena observed during very slow variation in temperature to be thermodynamic equilibrium, such as the middle jumping Tj-temperature is erroneously considered the terminal Tc-critical temperature of order-disorder equilibrium transition [8], and then to treat experimental phenomena by equilibrium thinking mode, lacking an essential definition of thermodynamic equilibrium order-disorder transition.
Due to the discoveries of alloy gene (AG) sequences and their informational transmission mode and establishments of the alloy gene arranging (AGA)-Gibbs free energy partition function, holographic alloy positioning (HAP) system and equilibrium holographic network phase (EHNP) diagrams of AuCu-type sublattice system [1], our knowledge of relations of order degree (��), state (q) and temperature (T) for a given component alloy has been changed from single causality to systematic correlativity. In this work, a new atom movement mechanism was discovered, equilibrium and subequilibrium holographic network path (EHNP and SHNP) charts on disordering AuCuI were established and the four questions mentioned above were explained.
2 EHNP charts of thermodynamic properties
The essential on disordering AuCuI is that the  and
and  stem alloy genes are split into the
  and
and  sequences in the disordered state. The essential definition of equilibrium order-disorder transition is defined as that ��the AG-Gibbs energy levels
  ,
, and AG-concentrations
 occupied at the
  - and
- and  -energy levels can respond immediately and change synchronously with each small variation in temperature and proceed along the minimal Gibbs energy path��. It gives an equilibrium thermodynamic standard for studying subequilibrium transition and is useful in understanding the development and preservation of subequilibrium structures and their attendant properties, although it can not be reached in practice. The systematic correlativity between different properties and between various properties and structures for a given component alloy in equilibrium path may be described by a set of the EHNP q-T-�� charts. An EHNP chart consists of curves linked by the network (q, T, ��)-points, where the q-state denotes the AG-concentrations
  ,
,  , mixed Gibbs energy
  , mixed characteristic Gibbs energy
  , (i.e., chemical potential), mixed enthalpy
  , mixed potential energy
  , mixed volume
  , configurational entropy Sc, configurational entropy energy TSc, generalized vibration free energy Xv, generalized vibration energy Uv, generalized vibration entropy Sv, generalized vibration entropy energy TSv, heat capacity cp, thermal expansion coefficient �� and activities (��Au, ��Cu). Now, the minimum mixed Gibbs energy
  path and corresponding
  path have been obtained by the iso-order degree (or isothermal) Gibbs energy equilibrium path method (Fig. 1). Then, a set of EHNP charts of thermodynamic properties have been calculated by the AGA-Gibbs free energy partition function (Fig. A.1, Figs. A.3-A.13, Fig. A.18 in Appendix A). The common behaviors of equilibrium transitions are as follows: 1) The order�� disorder transition upon heating and disorder��order transition upon cooling proceed along the same minimal mixed Gibbs energy path, without a so-called hysteresis phenomenon; 2) The path is continuous and has no jumping phenomenon. These are the equilibrium transition criteria. The EHNP charts provide standards for establishing experimental SHNP charts on disordering AuCuI.
3 SHNP charts of thermodynamic properties
The essential definition of subequilibrium order��disorder transition is that the AG-Gibbs energy levels can respond immediately with each small variation in temperature, but the AG-concentrations (probabilities) occupied at the AG-Gibbs energy levels can not change synchronously, even by extremely heating rate, that leads to its higher Gibbs energy path than equilibrium path. This transition needs a special atom movement mechanism together with superheated driving Gibbs energy. It is often the case that the structures and properties of subequilibrium state alloys are more desirable than those associated with equilibrium state alloys. We have obtained the experimental mixed enthalpy  path on disordering AuCuI , based on the assessment of experimental data [3,9]. The subequilibrium order degree
  path has been obtained by the experimental path method based on the iso-order degree mixed enthalpy
  equilibrium path chart (Figs. 1(b)-(d) and Fig. A.2 in Appendix A). Namely, the experimental path is translated into the subequilibrium path, through the equilibrium path chart. Then, a set of the SHNP charts of thermodynamic properties are calculated by the AGA-Gibbs free energy partition function and shown in Figs. A.3 to A.18 in Appendix A. These charts are calculated by the temperature step ��T=1 K and order degree step ����=0.00001. The common behaviors of the SHNP charts are as follows: 1) The order degree keeps unchanged in a broad temperature range from 0 K to 593 K by slow heating rate (Fig. 1(d)); 2) There exists complex variation in order degree, during the temperature range from onset temperature (Tonset) to jumping Tj-temperature, that is only about 100 K interval; 3) Upon increasing heating rate, the Tonset -temperature increases, and the Tj-temperature decreases, i.e., so called retro-effect; 4) The
  path at any temperature is higher than the equilibrium path, even after the Tj-temperature (Fig. 1(c)). Their difference (
 ) is the superheated driving Gibbs energy of the subequilibrium alloy, i.e., thermal hysteresis Gibbs energy; 5) There exists a thermal hysteresis Gibbs energy loop between the order�� disorder and disorder��order transitions, that is not concerned in this work. These behaviors demonstrate that all experimental order��disorder paths by any heating rate belong to subequilibrium ones.
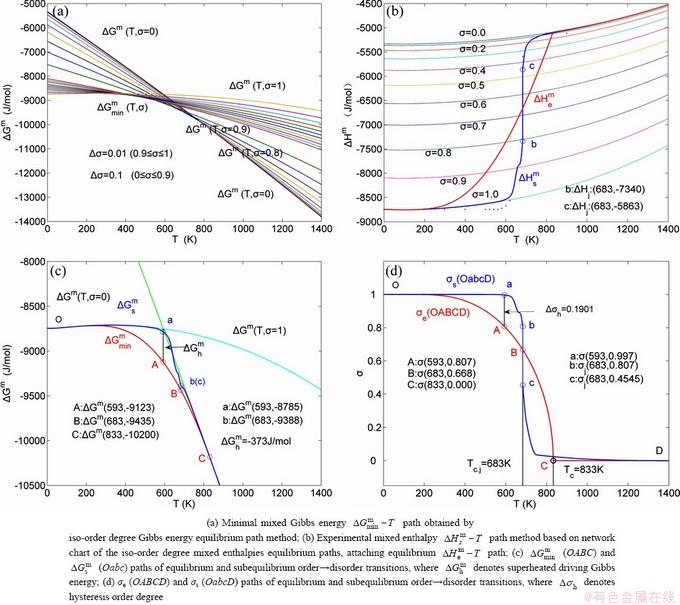
Fig. 1 EHNP and SHNP charts on disordering AuCuI( )
)
4 EHNP and SHNP charts of AG- concentrations
��Properties are determined by structures��. The description of alloy phase structures has been translated from a probability of the constituent atom concentrations to a probability of the alloy gene concentrations, due to discovery of the alloy genes. The EHNP and SHNP charts of thermodynamic properties on disordering AuCuI are respectively determined by the EHNP and SHNP charts of the AG-concentrations. The AG-concentration  and
and  paths on disordering AuCuI may be described by two modes: 1) three-dimensional
  and
and  SHNP charts, from which two-dimensional iso-order degree
  and
and  paths can be obtained, where and are the probabilities occupied at the and energy levels in the AG-arranging band structure (Figs. 2(a), (b), (c), (d)); 2) three-dimension
  and
and  SHNP charts, from which two-dimensional
  and
and  paths can be obtained, where the and are the probabilities occupied at the lattice sites in the AG-arranging crystal structure (Figs. 2(e), (f), (g), (h)). The AG-concentration EHNP charts are shown in Fig. B.1 in Appendix B. Their systematic correlativity is listed in Tables B.1 and B.2 in Appendix B. From the EHNP and SHNP charts of the AG-concentrations, we have obtained the following common knowledge: 1) The essence of order��disorder transition of the AuCuI is that the and stem alloy genes are split into the - and -sequences; 2) The equilibrium order��disorder transition is a continuous one. The subequilibrium order��disorder transition is a discontinuous one.
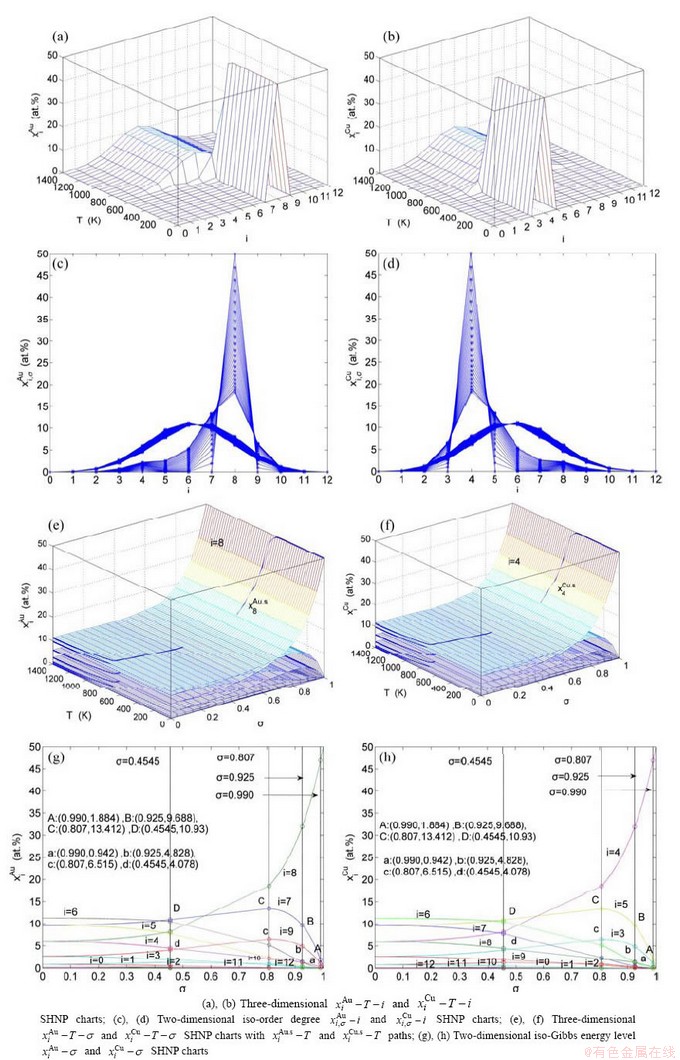
Fig. 2 AG-concentration SHNP charts on disordering AuCuI
5 Ability of structure stabilization
Any system has ability to keep structure stabilization against a changing environment. We have discovered that the ability of AuCuI to keep structure stabilization against changing temperature is attributed to the fact that the AG-potential well depths greatly surpass superheated driving Gibbs energy and AG-vibration energies. When 0 K��T<>onset, it is the unchanged period of the AuCuI. Its behaviors are as follows: 1) There exists no variation in order degree until Tonset (593 K)-temperature (Figs. 1(c) and (d)). Namely, there exists no positional exchange between and alloy genes, which are still occupied at the  and
and  energy levels, respectively; 2) The superheated driving Gibbs energy (
 ) between the equilibrium (OABC) and subequilibrium (Oabc) paths increases with rising temperature. Their difference is -373 J/mol at 593 K (Fig. 1(c)), which is too small to exchange AG-positions; 3) The generalized vibration energies of and alloy genes increase with rising temperature, but their values are much smaller than their potential well depths (Tables C.1 to C.6 in Appendix C). At 593 K, the
  and
and  ratios are about 1/27. It means that only depending on superheated driving Gibbs energy and vibration energy, the and alloy genes can not surmount potential barriers to alternate positions.
6 Resonance activating (RA)-synchro alternating (SA) mechanism
Any system has a mechanism to change structure for suiting variation in environments. According to the peculiar orders of the AG- and concentrations at the beginning period on disordering AuCuI, we have discovered the 3(RA-SA) mechanism, which is that three AG-pairs in a cell-scale region occur resonance to accumulate vibration energies and synchronistically alternate their lattice positions to change their energetic states (see Appendix D). The RA-SA mechanism together with superheated driving Gibbs energy  and jumping order degree, as well as atom-vacancy alternating (AVA) mechanism, control kinetic behaviors of the heterogeneous subequilibrium successive transition periods on disordering AuCuI.
1) When Tonset(593 K) and
and  stem alloy genes are split respectively into the


 and
and 


 and
and  through the 3(RA-SA) mechanism with two manners (Figs. 3(a) and (b), Figs. 4(a) and (b), Fig. D.5 in Appendix D); (2) Their peculiar orders in concentrations obtained by the 3(RA-SA) mechanism are respectively:
  >
> >
> and
and  >
> >
> , although the
  signal alloy gene of 3(RA-SA) mechanism is further away from than and
  , and the
  signal alloy gene of 3(RA-SA) mechanism is further away from than and
  (Figs. 3(a) and (b), Tables B.1 and B.2 in Appendix B); (3) There exists cell-scale (nucleation) heterogeneity in the growing period of the AuCu(H) alloy. Namely, the early-3(RA-SA) cell region with more 3(RA-SA) cells, middle-3(RA-SA) cells region with less 3(RA-SA) cells and late-AuCuI cell region without 3(RA-SA) cell co-exist in the AuCu(H) alloy (Fig. 4(c)).
2) When 620 K and
and  of the
  and
and  -jumping alloy genes begin to display the emergent phenomenon, which is defined as that their concentrations are larger than the ones of the corresponding alloy genes in the disorder state: >
 ,>
,> ; (2) As Ts=650 K and ��s=0.925, the concentrations
  and
and  of the
  - and
- and  -jumping alloy genes begin to display the emergent phenomenon: >
  , >
, > (Figs. 3(c) and (d), Tables B.1 and B.2 in Appendix B). (3) During this period, there exists region-scale (nucleus growing) heterogeneity: the original early-3 (RA-SA) cell regions with more 3(RA-SA) cells grow into the early-(SPAP- AuCuII) regions, the original middle-3(RA-SA) cell regions with less 3(RA-SA) cells grow into the middle-(RA-SA) cell regions with more 3(RA-SA) cells and the original late-AuCuI cell regions grow into the late-(RA-SA) cell regions with less 3(RA-SA) cells (Fig. 4(d)). Namely, the AuCu(H) region and SPAP-AuCuII region co-exist, and two distinct X-ray diffraction patterns may be observed at the ��s=0.925 [3]. This subequilibrium alloy with region-scale heterogeneity is called the ��pseudo-two-phases (PTP)�� AuCu alloy with the AuCu(H) regions and the SPAP-AuCuII regions. The use of the phrase ��PTP�� is intended to convey the impression that they are two heterogeneous subequilibrium regions with the same composition, different order degrees, and belong to the ordered AuCu-type sublattice phase, and that their mean properties may be calculated by the AG-Gibbs partition function of the ordered AuCu-type sublattice phase. However, their relationship cannot be described by different equilibrium thermodynamic functions of two phases.
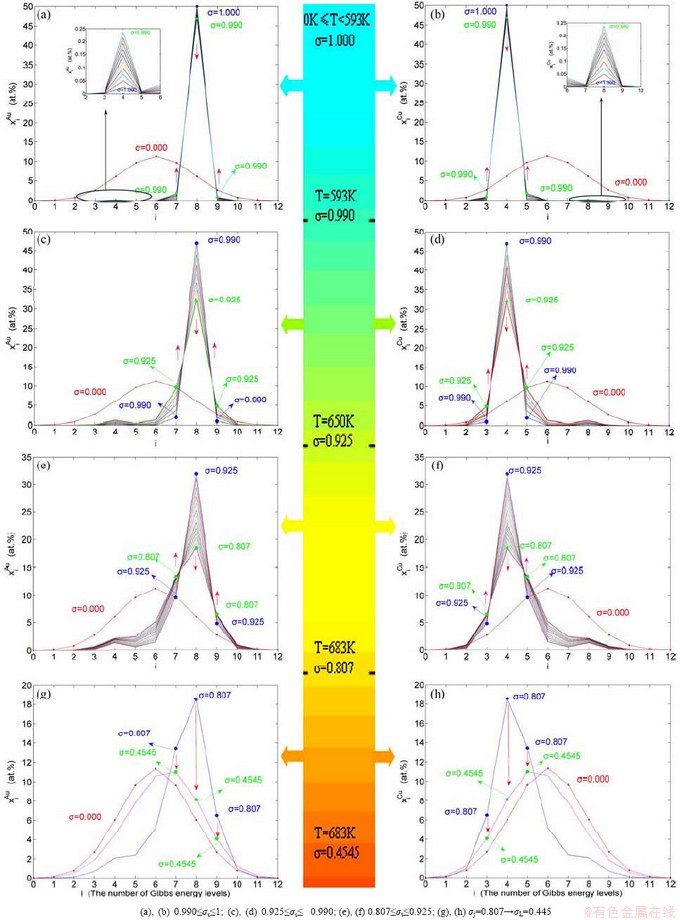
Fig. 3  and
and  concentrations for tracking path on disordering AuCuI
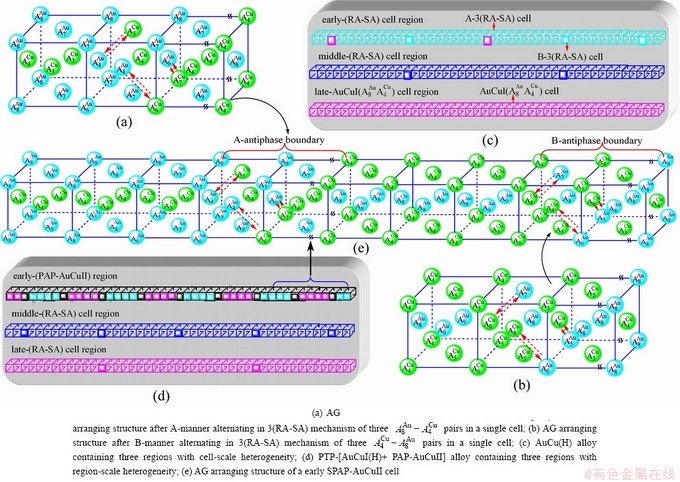
Fig. 4 3(RA-SA) mechanism and schemes of cell-scale and region-scale heterogeneities on disordering AuCuI
When 650 K��T��683 K and 0.925>��>0.807, it is the mature period of the SPAP-AuCuII alloy. During this period, the AuCu(H) regions are transferred into the SPAP-AuCuII regions (Figs. 3(e) and (f)). Therefore, the SPAP-AuCuII alloy containing early-, middle- and late-SPAP-AuCuII regions periods is a statistic periodic antiphase structure stacking of incommensurate tetragonal cells containing more and alloy genes and antiphase boundary n(RA-SA) cells containing less and alloy genes along b axis. It has no strict long periodic cell. The number M of cells between two successive antiphase boundaries is only an average, which is about 5.
4) When 0.807�ݦ�s��0.786, it is the jumping period of the SPAP-AuCuII alloy. In this period, there are the maximum concentration emergent phenomena of jumping alloy genes associated with jumping order degrees of the alloy. The jumping Tj-temperature is determined by the jumping order degree together with superheated driving Gibbs energy. As ��j=0.807, and display the maximum emergent phenomenon: ==6.515%. As ��=0.786, and display the ��maximum emergent phenomenon��, = =13.458% (Figs. 3(g) and (h)). Therefore, there exists an experimental jumping ��j-order degree The ��j,1=0.807 and ��j,2=0.786 are called the first and second jumping order degrees, respectively. The and  are in close vicinity to , the and are in close vicinity to . They may be called the jumping alloy genes. As the ��s-order degree is less than the ��j-order degree, the disordering begins to translate from a single splitting of the and stem alloy genes to a universal splitting of the stem and jumping alloy genes, which is an essential condition to happen a discontinuous jump change from the high order degree SPAP-AuCuII to the low order degree AuCu(L) via complex n(RA-SA) mechanism and induced fission mechanism, as well as AVA mechanism.
Therefore, the jumping Tj-temperature is arisen from jumping order degree at the beginning split of the jumping alloy genes. At the jumping temperature Tj=683 K, the SPAP-AuCuII alloy with high order degree (��j=0.807) jumps into the AuCu(L) alloy with low order degree (��=0.4545) (Fig. 1(d), Figs. 3(g) and (h), Tables B.1 and B.2 in Appendix B). After the Tj-temperature, the AuCu(L) alloy continuously transforms into the disordered AuCu (D) alloy by various n(RA-SA) mechanisms and AVA mechanism. The Tj -temperature measured under dynamic heat treatment shows an unexpected retrograde shift to lower temperatures upon increasing the heating rate. This retro-effect has been explained by jumping order degree (see next section). Therefore, the heterogeneous subequilibrium successive transitions on disordering stoichiometric AuCuI by slow heating rate are as follows: AuCuI ��AuCu(H)��PTP-AuCu��SPAP-AuCuII�� AuCu (L)��AuCu(D), of which the kinetic behaviors are closely related to heating rates.
7 Essence of retro-effect
Figure 5 shows that the temperature dependent ��(T) curves of the derivatives of the resistance R(T) functions obtained by dynamic in situ resistometry can describe dynamic behaviors on disordering AuCuIwith increasing heating rates.
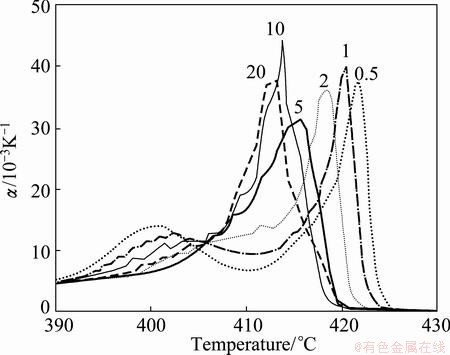
Fig. 5 Temperature dependence of  curves for heating rates
  =20, 10, 5, 2, 1 and 0.5 K/min [5]
1) The beginning temperature Tonset on disordering AuCuI increases, and it is a normal effect.
2) The top temperature TH of the first ��H(T) peak associated with the AuCu(H)��SPTP-AuCu transition (at about ��s=0.925) increases.
3) The top jumping Tj-temperature of the second ��j(T) peak associated with the SPAP-AuCuII(H)�� AuCu(L) transition (occurred at about ��j=0.807) decreases, the temperature interval between the TH and Tj temperatures reduces, and the width (integrated area) of ��j(T) peak increases. It is a so-called retro-effect.
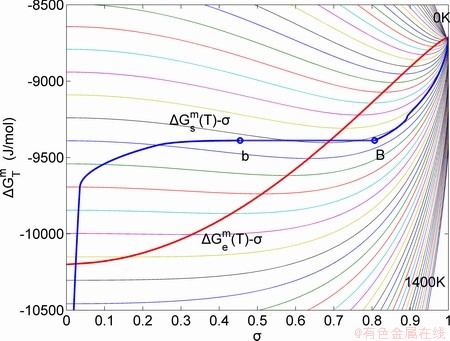
Fig. 6 Partly isothermal  network path charts with equilibrium
  path and subequilibrium
  path on disordering AuCuI() drawn by steps
  =25 K,
  =0.001
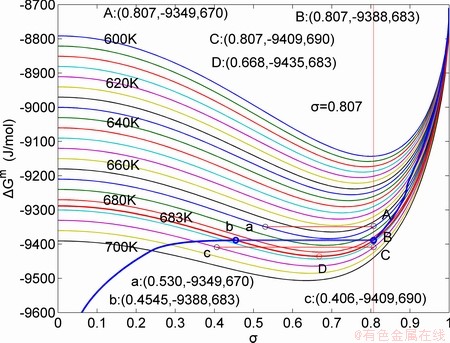
Fig. 7 Influence of heating rate on jumping  -temperature and form of jumping peak
The retro-effect of the jumping Tj-temperature is arisen from the jumping ��j-order degree. Its kinetic behaviors may be explained by the jumping order degree ��j=0.807 together with superheated driving Gibbs energy, based on the isothermal mixed Gibbs energy  equilibrium network path chart (Figs. 6 and 7):
1) The position D(0.668, 683, -9435.46) on the isothermal  equilibrium path indicates ��D=0.668, TD=683 K,
  =-9435.46 J/mol, which is the stable state standard of the AuCu alloy with the minimal mixed Gibbs energy at 683 K.
2) The jumping position B(0.807, 683, -9388) on the  subequilibrium path with heating vB-rate indicates ��B=0.807, Tj,B=683 K,
  =-9388 J/mol. It is the metastable state of the AuCu alloy at the 683 K, because
  (-9435.46 J/mol)< (-9388 J/mol).
3) As the heating rate vA>vB, the jumping position A(0.807, 670, -9349) on the subequilibrium path with heating vA-rate should be higher than the jumping position B(0.807, 683, -9388), i.e., Tj,A(670 K) <>j,B(683 K), because it has less stability (i.e., larger superheated driving Gibbs energy) than the B-position:  (-9349 J/mol)>(-9388 J/mol). Its part width (or integrated area) before the Tj,A-temperature of the second jumping peak increases, because the more order degree partly checked during the AuCuI(H)�� PTP-[AuCuI(H)+PAP-AuCuII] period occurs transition, in order to meet the essential jumping condition ��j=0.807. As the heating rate v=20 K/min, the first jumping peak cannot be observed.
4) As the heating rate vC<>B, the jumping position C(0.807, 690, -9409) should be lower than the jumping position B(0.807, 683, -9388), i.e.,  (690 K)>
 (683 K), because it has higher stability (i.e., smaller superheated driving Gibbs energy) than B-position:
  (-9409 J/mol)<
 (-9388 J/mol). Its part width before the
  -temperature of the second jumping peak should decrease, because the less order degree partly checked during the AuCuI(H)��PTP- [AuCuI(H)+PAP-AuCuII] period occurs transition, in order to meet the necessary jumping condition
  =0.807.
5) Due to balances between A and a, B and b, C and c positions, their order degrees in the low ordered AuCu(L) alloys are respectively  (0.530),
  (0.4545) and
  (0.4060). Therefore, the part width after the
  -temperature of the second jumping peak increases with increasing heating rate.
8 Discussion
8.1 Discussion on alloy gene
While forming alloy by pure elements, it is a fact without dispute that the component atomic states are split into the atomic state sequence due to influence of the nearest coordinative configurations. Therefore, in the FCC-based lattice Au-Cu system, the central characteristic atom  and
and  sequences respectively in the basic coordination cluster
 and
and  sequences should be taken as basic structure unit sequences. Here, I is the coordinative number and is equal to 12, i is the number of Cu-atoms and can change from 0 to 12. A characteristic atom is the smallest structure unit of alloy phase level. A biological gene is defined as a basic structure unit to carry and transmit genetic information. Analogously, with the biological gene, an alloy gene is defined as a characteristic atom to carry and transmit structure and properties information: the coordinative configuration of its coordinative cluster, the potential energy (E(0)) and volume (V(0)) separated out from the potential energies and volumes of pure elements and intermetallics, as well as disordered alloys obtained by experimental methods [1,10,11] or by quantum mechanical abinitio calculation (QMAC) method [12], and then the valence electron structure (��i(0)), cohesive energy (Ec.i), potential energy curve (W(r)), Debye temperature (��i) and bulk modulus (Bi), as well as a set of temperature-dependent thermodynamic properties: the generalized vibration heat capacity (
 ), which includes Debye vibration heat capacity (
 ) and attaching vibration heat capacity (
 ); the generalized vibration energy
  , which includes Debye vibration energy
  and attaching vibration energy
  ; the generalized vibration entropy
  , which includes Debye vibration entropy
  and attaching vibration entropy
  ; the enthalpy (Hi(T)), which includes a temperature-independent potential energy (E(0)) and generalized vibration energy
  ; the generalized vibration free energy
  , which includes the generalized vibration energy and generalized vibration entropy energy
  ; and the Gibbs energy (Gi(T)), which may be described by potential energy (Ei(0)) and generalized vibration free energy
  or by enthalpy (Hi(T)) and generalized vibration entropy energy . The attaching vibration energy includes contributions of electron excitation energy, energy of formation of holes and variations of potential energy E(0) and thermal expansion work (PV(T)) of volume with temperature, which are obtained by the AG-valence bond theory and thermodynamics of characteristic crystals [1,13], which includes valence bond theory of pure metals [14-16]. Therefore, the alloy gene, characteristic atom and characteristic crystal are synonym.
Up to now, scientists of QMAC-community have still adopted ��quantum state electrons�� as structure units to carry energies and space distribution information; and scientists of calculation of phase diagrams (CALPHAD) community have got used to taking ��component atoms��, ��component atom pairs�� and ��component atom clusters�� as structure units to carry interaction energies. The limitations of the currently used solution models in QMAC and CALPHAD communities are attributed to the fact that these structure units carry very few information.
The ��materials genome�� was given a rather vague definition in US president Obama��s announcement about the ��Materials Genome Initiative�� to accelerate advanced materials discovery and deployment in the United States [17]. Recently, the CALPHAD-founder and his cooperator argued that ��the materials genome should be defined as a set of information (database) allowing prediction of a materials structure, as well as its response to processing and usage conditions�� [18]. Obviously, this ��material genome�� to represent a set of information (databases) has nothing in common with the biological genome to represent basic structure units to carry and transmit genetic information.
8.2 Discussion on Gibbs free energy function
In the alloy gene arranging (AGA)-statistic thermodynamics of the SMMS framework, the AGA-Gibbs free energy function  is derived from the AGA-Gibbs free energy partition function, which describes the relation of AG-characteristic Gibbs free energy Gi(T)-levels and AG-concentrations
  and
and  occupied at the Gi(T)- levels. The Gi(T) is a complex function, i.e.,
  If the vibration energy is neglected, the AGA-Gibbs free energy partition function becomes the AGA-potential free energy partition function, from which only the AGA-potential free energy function
  can be derived [12]. The equilibrium minimal mixed Gibbs free energy path on disordering AuCuI
  compound, which is the standard path for studying subequilibrium
  path, can be obtained only by function, not by function.
In the QMAC-thermodynamics, the QMAC-Gibbs free energy function is obtained by combining the QMAC-potential energies of some pure metals and intermetallics with the cluster variation method [19]. Because the vibration energy is neglected and the basic structure units are the ��component atom clusters�� for calculating effective cluster interaction parameter and configurational entropy, which are questionable, the QMAC-Gibbs free energy function is the potential free energy function and can not give the equilibrium mixed Gibbs free energy path.
In the CALPHAD-thermodynamics, the CALPHAD- Gibbs free energy function contains a number of unknown parameters. These parameters may be adjusted until the G-function is capable of representing the chosen information well. For the Au-Cu system, the chosen information about that the assessed experiment  path on disordering AuCu compound is erroneously considered the equilibrium path, the experimental jumping Tj-temperature is erroneously considered the assessed Tc-critical temperature of the order-disorder equilibrium transition, and that the composition-dependent Tj(x)-experimental temperatures are erroneously considered as the composition-dependent Tc(x)- critical temperatures. Therefore, the CALPHAD- Gibbs free energy function for Au-Cu system, the calculated and paths on disordering AuCu compound and the assessed Au-Cu phase diagram obtained by fitting to these erroneous knowledge information are crude [20,21]. Therefore, the CALPHAD-field was criticized by both experimentalists and theoreticians. ��The former thought that it was based on questionable data and the latter that the theoretical analysis was too crude [19].�� We think that the QMAC and CALPHAD communities have still adopted erroneous knowledge to experimental data and have not found the materials genome having analogy to biological genome for establishing materials gene arranging Gibbs free energy partition function. The QMAC- and CALPHAD-Gibbs free energy functions were established by ��component atoms��, ��component atom pairs�� and ��component atom clusters�� to carry very few information, which are incomplete structure unit sequences [12].
8.3 Discussion on equilibrium and subequilibrium paths
According to the AGA-Gibbs free energy function and the essential definition of equilibrium order-disorder transition, the calculated equilibrium path is a standard for studying subequilibrium path: 1) All subequilibrium paths calculated based on experimental paths obtained by various heating and cooling rates are higher than path. 2) The concept of thermal hysteresis effect has been spread. The thermal hysteresis driving Gibbs energy at each temperature on the path may be calculated: ��Gh(T)=��Gmin(T)-��Gs(T). We have discovered that all experimental order��disorder paths by any heating rates belong to subequilibrium ones, even by extremely heating rates, because the AG-potential well depths greatly surpass superheated driving Gibbs energy and AG-vibration energies. For example, Tonset=593 K,  =-378357 J/mol,
  =13619 J/mol,
  =364738 J/mol,
  =-343136 J/mol,
  =12655 J/mol,
  =330480 J/mol,
  =-373 J/mol. It means that this transition needs a special atom movement mechanism together with superheated driving Gibbs energy. 3) The Tc-critical temperature of the equilibrium order-disorder transition may be defined as the cross point of the and
  lines. 4) We can prove that the so-called equilibrium paths calculated by the QMAC- and CALPHAD-Gibbs free energy functions, which are obtained through fitting to erroneous knowledge information about that the assessed experimental path is erroneously considered the equilibrium path and that the assessed experimental jumping Tj-temperature is erroneously considered the Tc-critical temperature, are higher than the path calculated by AGA-Gibbs free energy function.
The calculated and  and path charts of equilibrium and subequilibrium order��disorder transitions are of great significance: 1) The essential definitions of equilibrium and subequilibrium order�� disorder transitions have been given. 2) The A-manner 3(RA-SA) and B-manner 3(RA-SA) mechanisms have been discovered. The 3(RA-SA) cells are the nuclei of disordering AuCuI compound. The SPAP-AuCuII may be explained by nucleation heterogeneity of the A- and B-manner 3(RA-SA) mechanisms and their growing heterogeneity of the complex n(RA-SA) mechanism. 3) The single splitting of the and stem alloy genes have been discovered. 4) The emergent phenomenon and jumping
  order degree of the and jumping alloy genes have been discovered. The essence of the jumping Tj-temperature is that the disordering begins to translate from a single splitting of the and stem alloy genes to the universal splitting of the jumping alloy genes together with the stem alloy genes. The retro-effect of the jumping Tj-temperature may be explained by the jumping order degree together with superheated driving Gibbs energy. These advantages are attributed to that the AGA-Gibbs free energy partition function is established based on two rules: 1) The structural units used for calculating configuration entropy should be in agreement with the structural units used for calculating corresponding energy levels. 2) The configuration entropy of each ordered alloy can change continually from the configuration entropy of the maximum order degree
  state to one of the ideal disordered state, which needs not to induct any parameter. It means that we should take the ideal disordered state as the standard. However, these two rules are often neglected in the QMAC- and CALPHAD-thermodynamic models of alloy phases.
9 Conclusions
1) The essential definitions of equilibrium and subequilibrium order-disorder transitions are proposed, based on the AG-Gibbs energy partition function of AuCu-type ordered sublattice system. The essential on disordering AuCuI() is that the and stem alloy genes are split into the and sequences in the disordered state.
2) The minimum mixed Gibbs energy  path and order degree
  path are established by the iso-order degree (or isothermal) Gibbs energy equilibrium path method. Then, a set of the EHNP charts of thermodynamic properties are calculated by the AGA-Gibbs free energy partition function.
3) The subequilibrium order path is obtained by the experimental mixed enthalpy path method based on the iso-order degree mixed enthalpy equilibrium path chart. Then, a set of the SHNP charts of thermodynamic properties are calculated by the AGA-Gibbs free energy partition function.
4) The and stem alloy genes are responsible for consisting AuCu compound, the and signal alloy genes are responsible for finding atom movement mechanism, and the and jumping alloy genes are responsible for arising jumping Tj-temperature, according to the AG-concentrations for tracking path on disordering AuCuI.
5) The heterogeneous subequilibrium successive transitions on disordering AuCuI are determined as: AuCuI��AuCu(H)��PTP- AuCu��SPAP-AuCuII��AuCu(L)��AuCu(D), of which the kinetic behaviors related to heating rates are controlled by the RA-SA mechanism, superheated driving Gibbs energy and jumping ordering degree, as well as atom-vacancy mechanism in the high temperature.
6) We have discovered the RA-SA mechanism leading to cell-scale and region-scale heterogeneities of subequilibrium alloy phases, and the jumping order degree leading to the jumping Tj-temperature and its retro-effect.
Appendixes
A Equilibrium and subequilibrium holographic network path (EHNP and SHNP) charts on disordering AuCuI( )
)
A.1 Method and results of EHNP charts
The  EHNP chart with the minimal mixed Gibbs energy and corresponding equilibrium order degree paths on disordering stoichiometric AuCuI() have been obtained (Fig. A.1). Then, a set of EHNP charts of thermodynamic properties have been calculated (Figs. A.3-A.13). These charts are calculated by the temperature step ��T=1 K and order degree precision in ����=��0.0001. This method is called the equilibrium mixed Gibbs energy path method, which includes the equilibrium iso-order degree
  paths method (Fig. A.1) and the equilibrium isothermal
  paths method (Figs. 6 and 7).
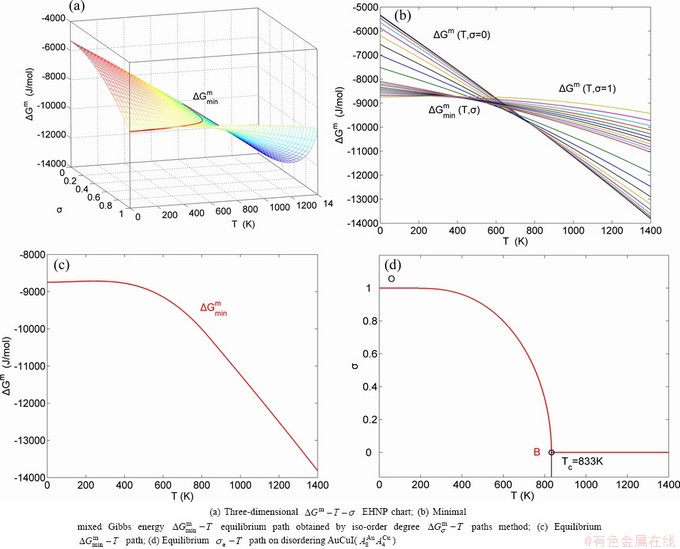
Fig. A.1 Minimal mixed Gibbs energy equilibrium path method
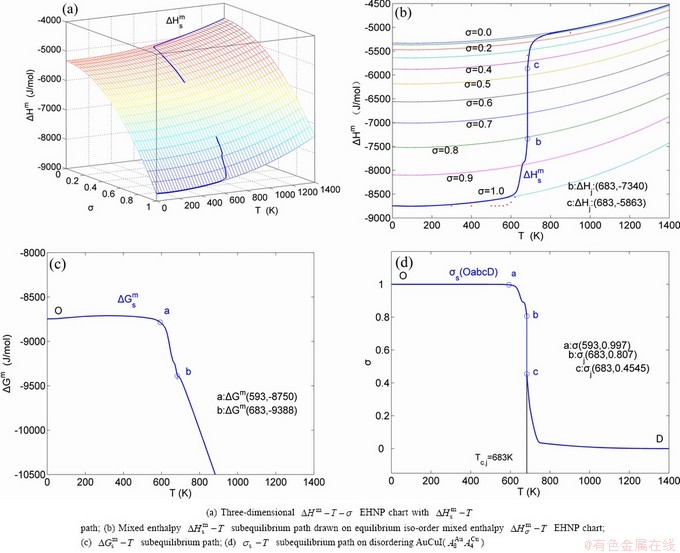
Fig. A.2 Experimental mixed enthalpy  -T path method
A.2 Experimental mixed enthalpy  path method and results of SHNP charts
Because the AG-generalized vibration energies are much smaller than their potential well depths (Appendix C), the AG-Gibbs energies (,) can respond immediately and change synchronously with each small variation in temperature, but the AG-concentrations ( ,
, ) occupied at - and -energy levels can not change synchronously. Therefore, all of measured paths on disordering AuCuI() belong to subequilibrium, even extremely slow heating rate. Now, we have obtained the subequilibrium order degree
  path by ��the experimental mixed enthalpy
  path method��. In this method, the experimental curve is drawn up on the equilibrium iso-order degree mixed enthalpy EHNP charts (Fig. A.2), and then the ��s-T path can be obtained. According to the ��s-T path, a set of SHNP charts of thermodynamic properties have been calculated by the AG-Gibbs energy partition function of the AuCu-type sublattice system (Figs. A.3 to A.18). These SHNP charts may be also obtained by other experimental thermodynamic properties path methods, such as the experimental mixed volume
  -T path method, based on the equilibrium iso-order degree mixed volume
  -T EHNP chart. These methods may be called the AG-tracking method.
Fig. A.3 EHNP charts with EHNP and SHNP curves of first order thermodynamic properties on disordering AuCuI()
Fig. A.4 EHNP charts with EHNP and SHNP curves of first order thermodynamic properties on disordering AuCuI()
Fig. A.5 EHNP charts with EHNP and SHNP curves of first order thermodynamic properties on disordering AuCuI()
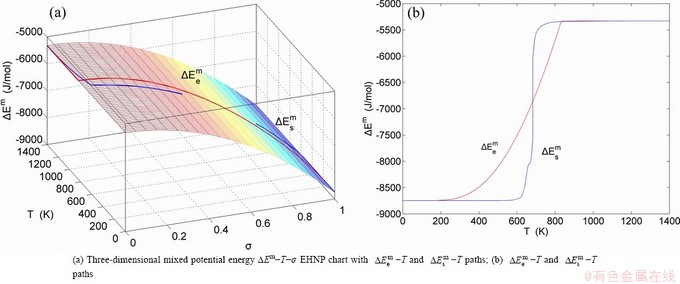
Fig. A.6 EHNP charts with EHNP and SHNP curves of first order thermodynamic properties on disordering AuCuI()
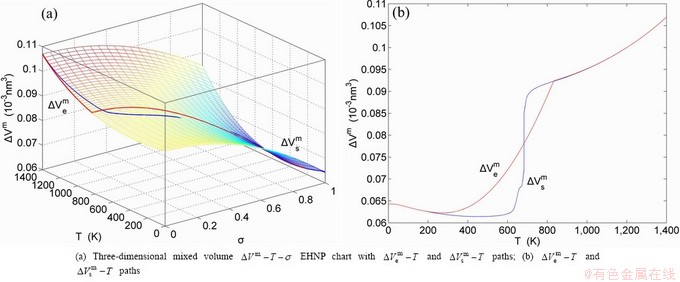
Fig. A.7 EHNP charts with EHNP and SHNP curves of first order thermodynamic properties on disordering AuCuI()
Fig. A.8 EHNP charts with EHNP and SHNP curves of first order thermodynamic properties on disordering AuCuI()
B EHNP charts of AG-concentration  and
and  on disordering AuCuI(
 )
)
The AG-concentration and on disordering AuCuI() may be described by two modes: 1) Three-dimensional and EHNP charts, from which two-dimensional iso-order degree and paths can be obtained, where the and are the probabilities occupied at the and energy levels in the AG-arranging band structure (Figs. B.1(a), (b), (c) and (d)); 2) Three-dimensional -T-�� and - T-�� EHNP charts, from which two-dimensional - �� and paths can be obtained, where the and are the probabilities occupied at the lattice sites in the AG-arranging crystal structure (Figs. B.1(e), (f), (g) and (h)). The AG-concentration SHNP charts are shown in Fig. 2. Their systematic correlativities are listed in supplementary Tables B.1 and B.2.
Fig. A.9 EHNP charts with EHNP and SHNP curves of first order thermodynamic properties on disordering AuCuI()
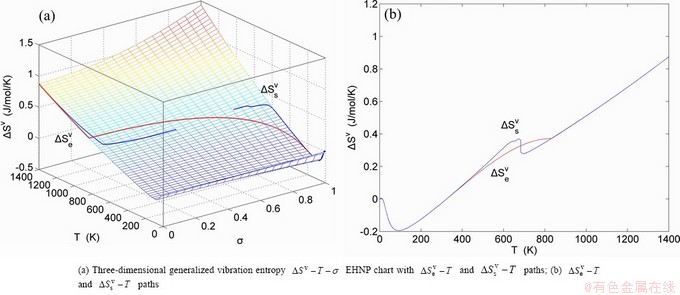
Fig. A.10 EHNP charts with EHNP and SHNP curves of first order thermodynamic properties on disordering AuCuI()
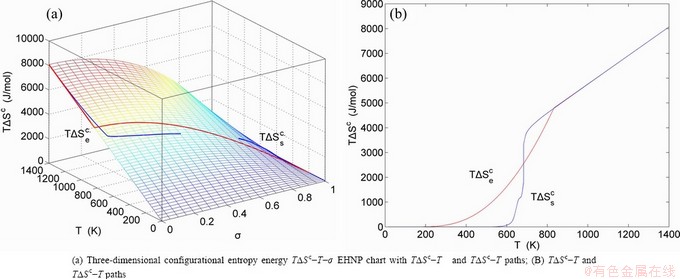
Fig. A.11 EHNP charts with EHNP and SHNP curves of first order thermodynamic properties on disordering AuCuI()
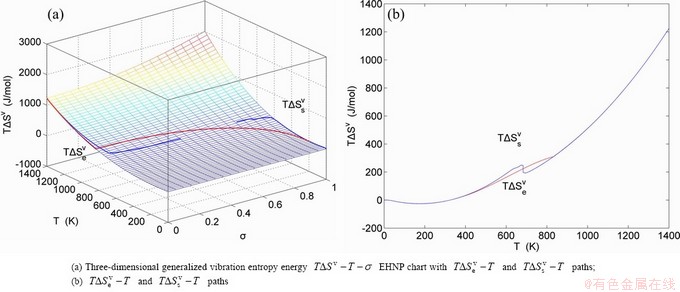
Fig. A.12 EHNP charts with EHNP and SHNP curves of first order thermodynamic properties on disordering AuCuI()
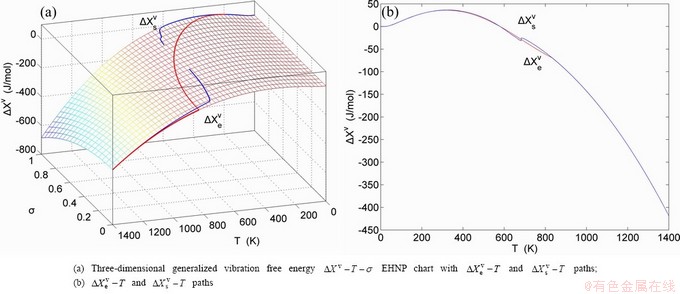
Fig. A.13 EHNP charts with EHNP and SHNP curves of first order thermodynamic properties on disordering AuCuI()
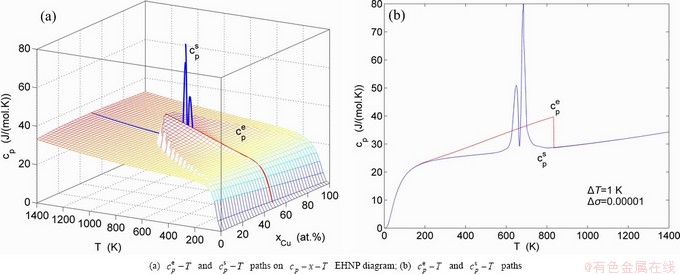
Fig. A.14 Second order thermodynamic properties (specific heat capacity and thermal expansion coefficient) on disordering AuCuI()
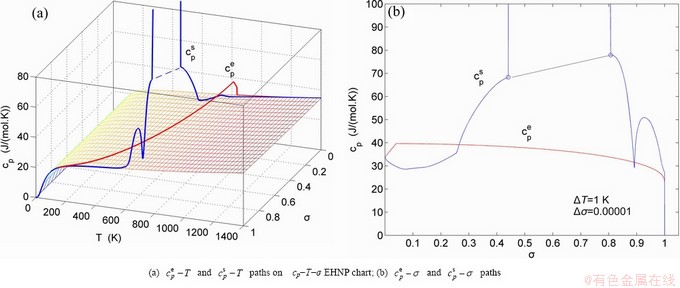
Fig. A.15 Second order thermodynamic properties (specific heat capacity and thermal expansion coefficient) on disordering AuCuI()
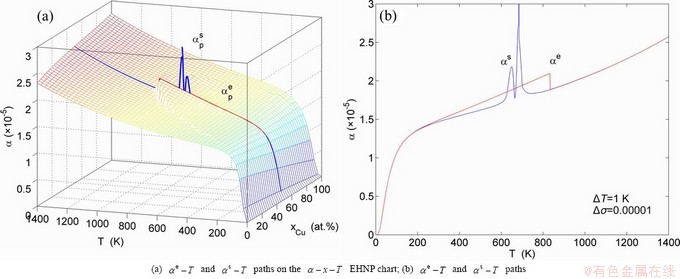
Fig. A.16 Second order thermodynamic properties (specific heat capacity and thermal expansion coefficient) on disordering AuCuI()
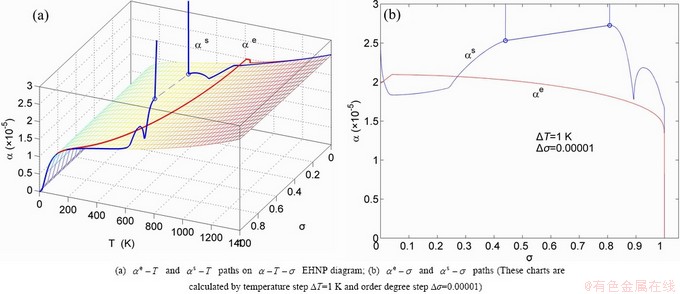
Fig. A.17 Second order thermodynamic properties (specific heat capacity and thermal expansion coefficient) on disordering AuCuI()
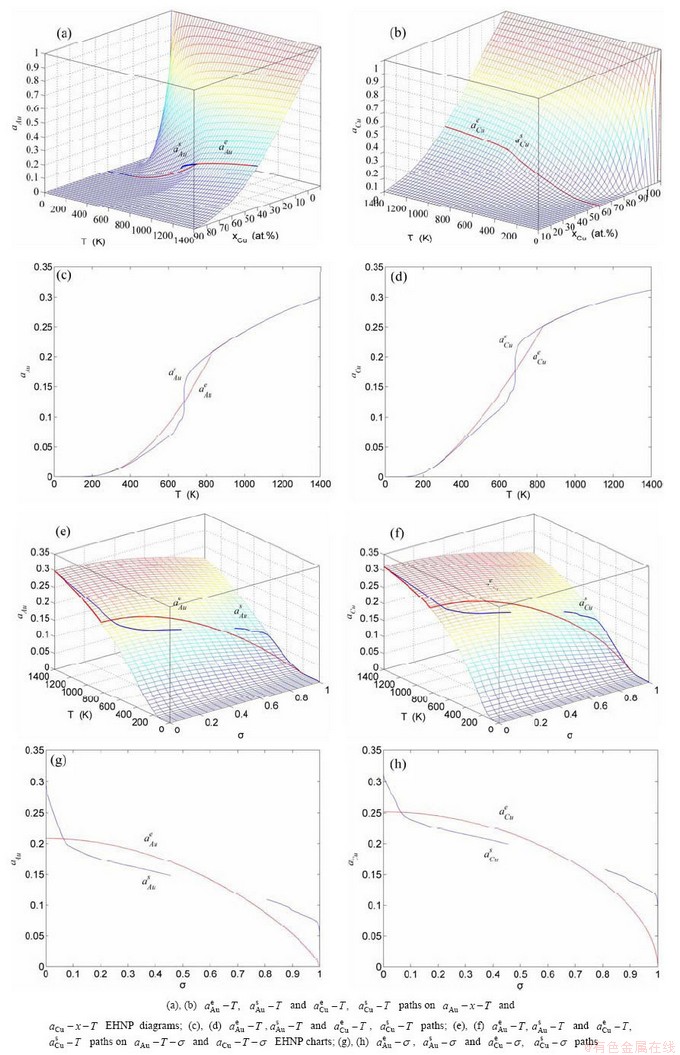
Fig. A.18 Activities on disordering AuCuI()
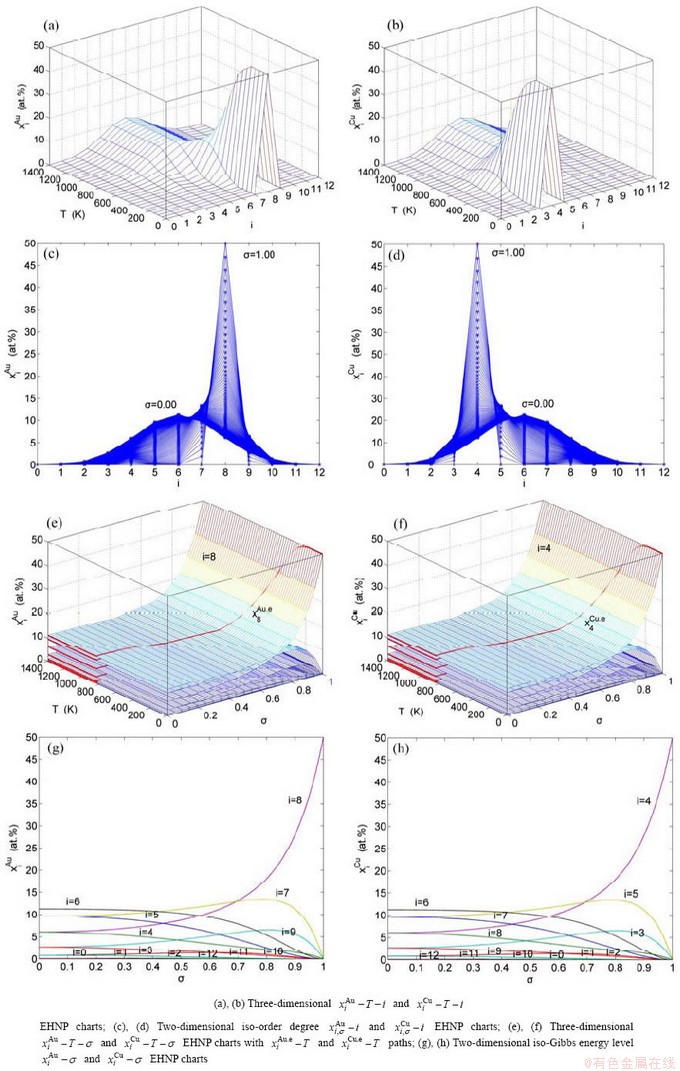
Fig. B.1 AG-concentration EHNP charts on disordering AuCuI()
Table B.1 Systematic correlativity of equilibrium transition temperature Te, subequilibrium transition temperature Ts, order degree �� and  alloy gene concentrations (
 ) on disordering AuCuI(
 ) compound
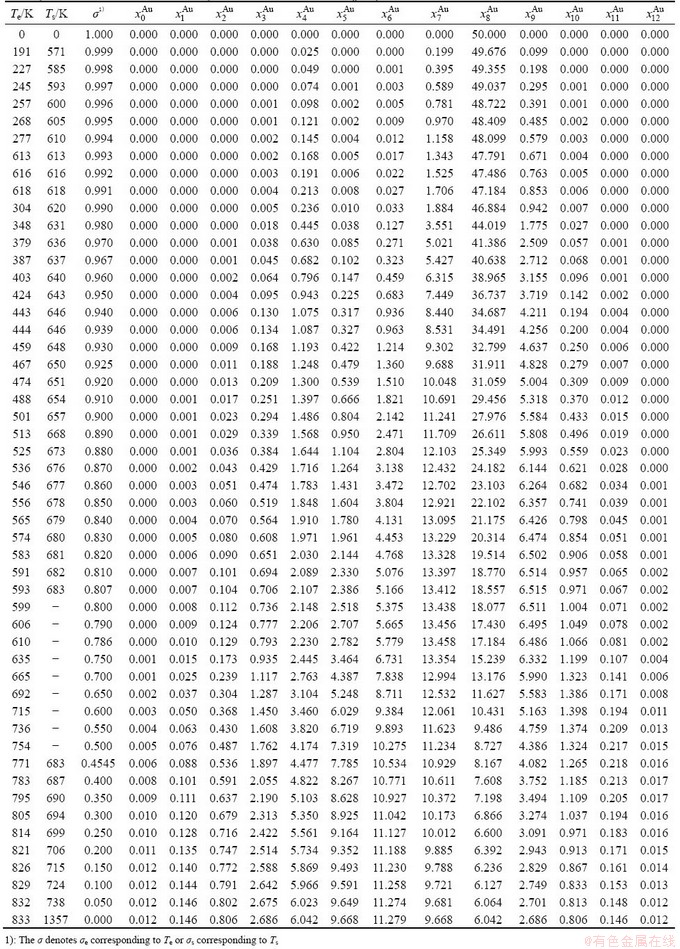
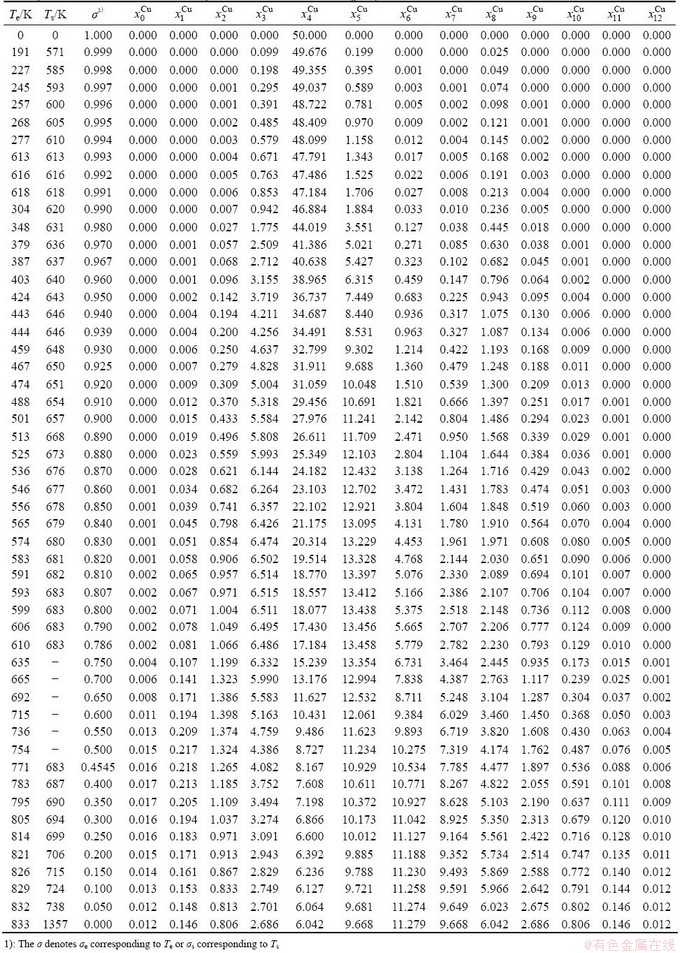
Table B.2 Systematic correlativity of equilibrium transition temperature Te, subequilibrium transition temperature Ts, order degree �� and  alloy gene concentrations (
 ) on disordering AuCuI() compound
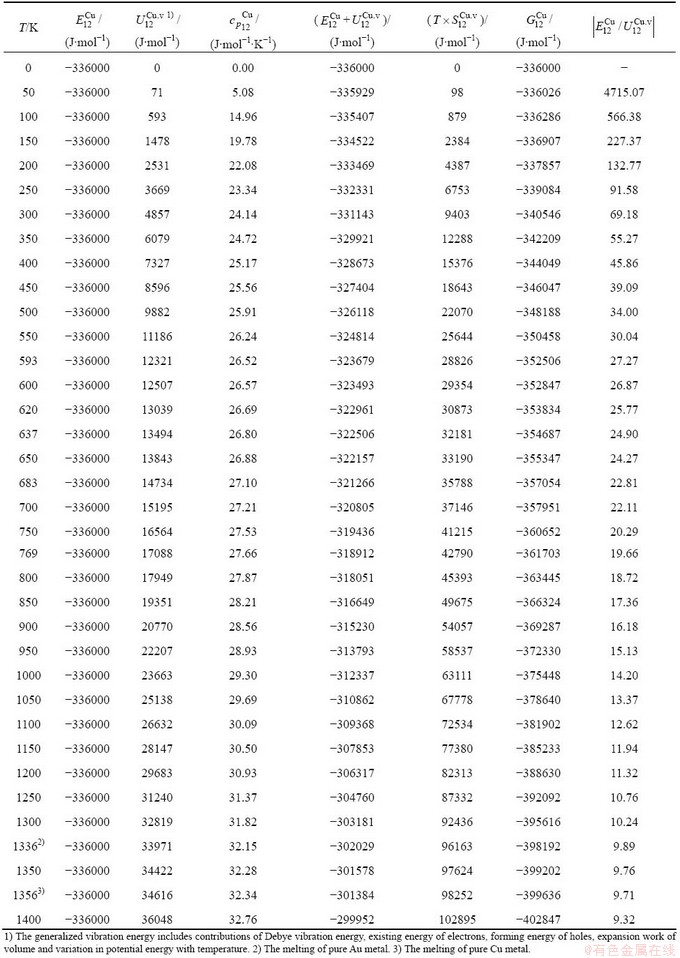
C Ability to keep stable structure against changing temperature for Au-Cu system
The ability to keep stable structure against the changing temperature for Au-Cu system is attributed to the fact that the generalized vibration energies of the - and -alloy genes are much smaller than their potential well deeps, which may be described by the ratio of potential energy to generalized vibration energy of alloy genes.
The potential energy  and
and  generalized vibration energy
  and
and  specific heat capacity
  and
and  , enthalpy
  =
= +
+ and
and  =
= +
+ , vibration entropy energy (
 ) and (
 ), characteristic Gibbs energy
  ,
,  and the ratio
  ,
,  of the and alloy genes have been obtained from the AG-database of Au-Cu system. The results show that the generalized vibration energies of - and -alloy genes are much smaller than their potential well depths (Tables C.1 to C.6, Fig. C.1). It means that only depending on vibration energies, the alloy genes cannot surmount potential barriers to alternate positions, if without a specific mechanism. It should be pointed out that the generalized vibration energies of alloy genes include Debye vibration energies and attaching vibration energies, which contain contributions of the existing energies of electrons, forming energies of holes, expansion works of volumes and variations in potential energies with temperature, because the thermodynamic properties of - and -alloy genes are separated out from the experimental mixed enthalpy
  and mixed volume
  paths.
D. Resonance activating (RA)-synchro alternating (SA) mechanism
D.1 Stem alloy genes
In the  - and -sequences of the Au-Cu system, there are stem alloy genes, which are the

 and
and 

 Their characters are as follows.
1) The pure  -metal and
  -metal consist of the and stem alloy genes, respectively. The Au3Cu compound consists of the and
  stem alloy genes. Its formula is
  The AuCu compound consists of the and stem alloy genes. Its formula is . The AuCu3 compound consists of the and stem alloy genes. Its formula is
  .
.
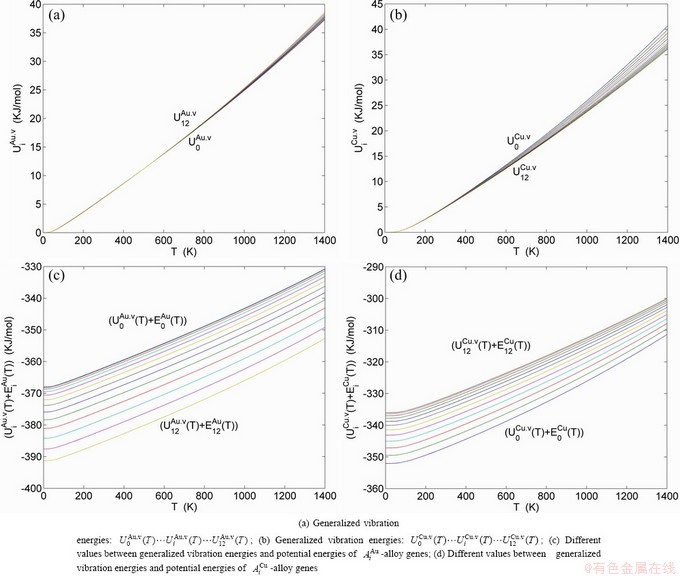
Fig. C.1 Potential energy and general vibration energies of alloy  - and
- and  -alloy gene sequences
Table C.1  ,
,  ,
,  (+), (
 ),
), ,
, of
of  -alloy gene

Table C.2  ,
,  ,
,  (+), (
 ),
), ,
, of
of  -alloy gene
Table C.3  ,
,  ,
,  , (+), (
 ),
),  ,
,  of
of  -alloy gene
Table C.4  ,
,  ,
,  , (+), (
 ),
), ,
, of
of  -alloy gene
Table C.5  ,
,  ,
,  , (+), (
 ),
), ,
, of
of  -alloy gene
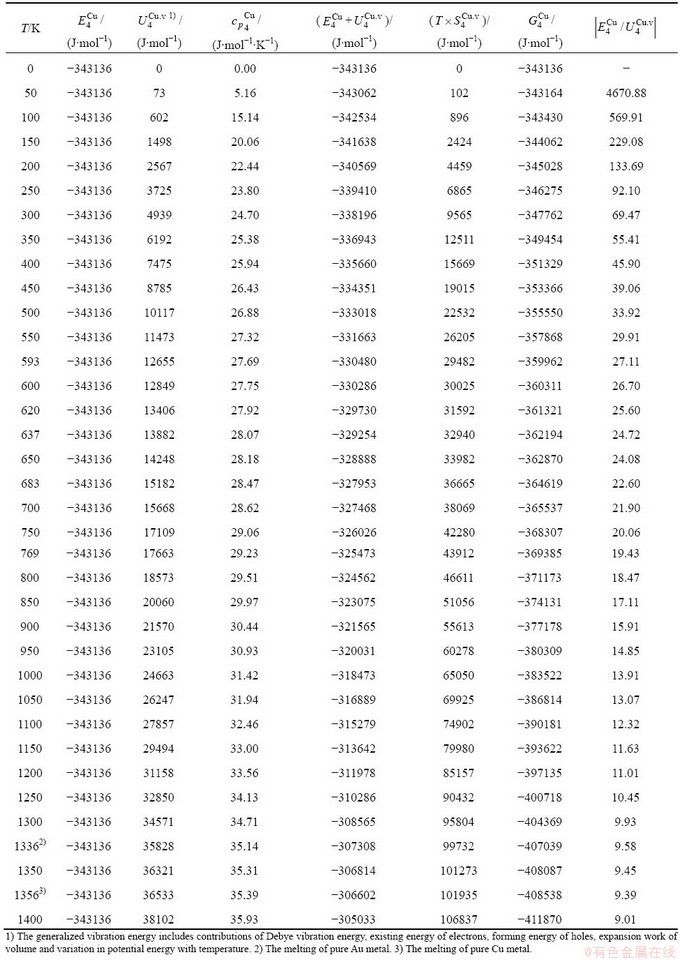
Table C.6  ,
,  ,
,  , (+), (
 ),
), ,
, of
of  -alloy gene
2) The essence of the order��disorder transition of the compound is that the and stem alloy genes are split into the - and -sequences, otherwise, the essence of the disorder��order transition of the stoichiometric disordered AuCu alloy is that the - and -sequences are degenerated into the and stem alloy genes. The  and compounds possess oneself of analogous essence to compound.
3) The and stem alloy genes are the signal alloy genes of the n(RA-SA) mechanism in the beginning period on disordering compound. In this period, there are very peculiar orders of the splitting off alloy genes: >>, >>, the is farther away from the than and  , and the is farther away from the
  than and (Tables B.1 and B.2). Namely, the Gibbs energy level difference (
 -
- ) is larger than (
 -) and (
 -), and (
 -
- ) is larger than (
 -) and (
 -). The and stem alloy genes are signal alloy genes of the n(RA-SA) mechanism in the beginning period on disordering compound (Fig. D.1), and the and stem alloy genes are signal alloy genes of the n(RA-SA) mechanism of the beginning period on disordering compound (Fig. D.2).
D.2 Choice among n(RA-SA) mechanisms
It is generally accepted that the atom movement, which is necessary for any atom-arranging structural changes of alloys, occurs by atom jumps to vacant neighboring lattice sites, that may be called atom-vacancy alternating (AVA) mechanism. The n(RA-SA) mechanism has more functions than the AVA mechanism at low temperature.
We have studied the n(RA-SA) mechanisms in the beginning period on disordering AuCuI compound, where n equals one, two, three and four AG- pairs of the - type in a single cell of AuCuI. The results demonstrate that the 3(RA-SA) mechanism of three - pairs is the most suitable to simulate AG-concentration order in the beginning period on disorderding the AuCuI.
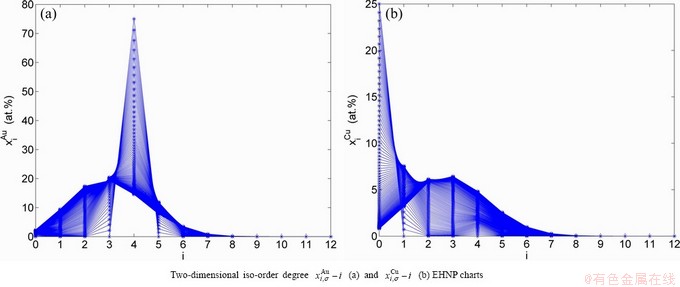
Fig. D.1 AG-concentration EHNP charts on disordering  compound
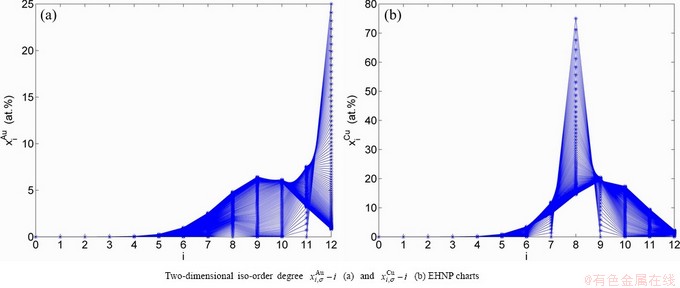
Fig. D.2 AG-concentration EHNP charts on disordering  compound
At the order degree ��=0.990 (Tables B.1 and B.2), the order in AG-concentrations is (atomic fraction, %):
 (D.1)
(D.1)
According to 1(RA-SA) mechanism of one pair of the - type in a single cell of the AuCuI (Fig. D.3, Tables D.1 and D.2), the order of AG- concentrations in the 1(RA-SA)-cell cluster consisting of a central 1(RA-SA)-cell and its 26 neighbouring cells is as follows (atomic fraction, %):
After A-manner alternating 1(RA-SA) mechanism (Fig. D.3(a)),
 (D.2)
(D.2)
After B-manner alternating 1(RA-SA) mechanism (Fig. D.3(b)),
 (D.3)
(D.3)
Because they have the same probability, their mean results are
 (D.4)
(D.4)
These results demonstrate that the 1(RA-SA) mechanism cannot be suitable to simulate AG-concentration order in the beginning period on disordering AuCuI().
2) According to 2(RA-SA) mechanism of two pairs of the - type in a single cell of the AuCuI (Fig. D.4, Tables D.1 and D.2), the order in AG-concentrations in the 2(RA-SA)-cell cluster consisting of a central 2(RA-SA)-cell and its 26 neighbouring cells is as follows (atomic fraction, %):
After A-manner alternating 2(RA-SA) mechanism (Fig. D.4(a)),
 (D.5)
(D.5)
After B-manner alternating 2(RA-SA) mechanism (Fig. D.4(b)),
 (D.6)
(D.6)
Table D.1 Number of AG  in n(RA-SA) region consisting of a central n(RA-SA) cell and its 26 neighbouring cells
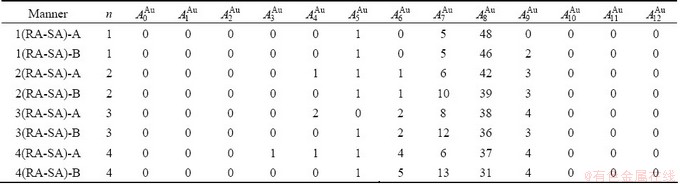
Table D.2 Number of AG  in n(RA-SA) region consisting of a central n(RA-SA) cell and its 26 neighbouring cells
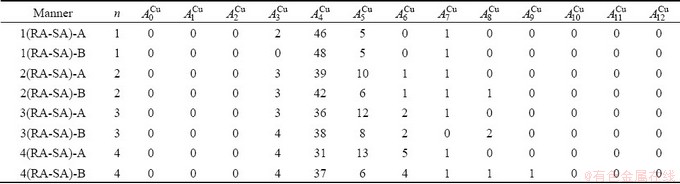
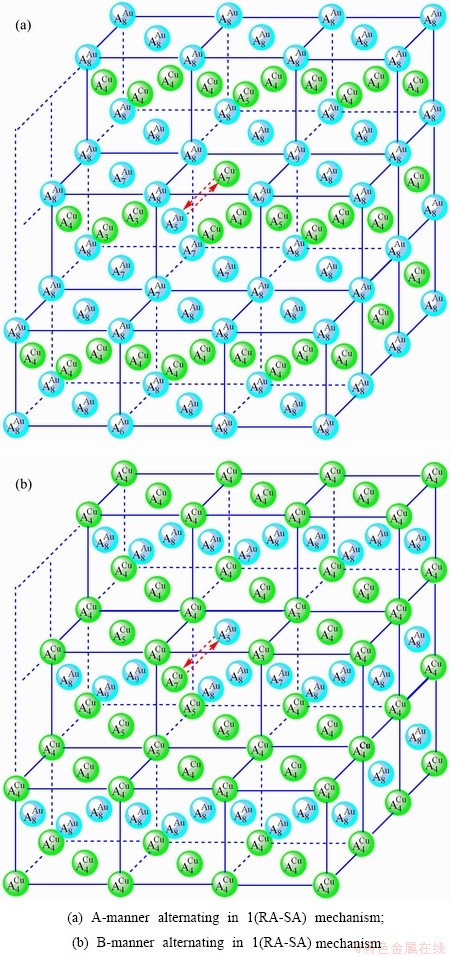
Fig. D.3 1(RA-SA)-cell cluster
Because they have the same probability, their mean results are
 (D.7)
(D.7)
These results demonstrate that the 2(RA-SA) mechanism cannot be suitable to simulate AG- concentration order in the beginning period on disordering AuCuI().
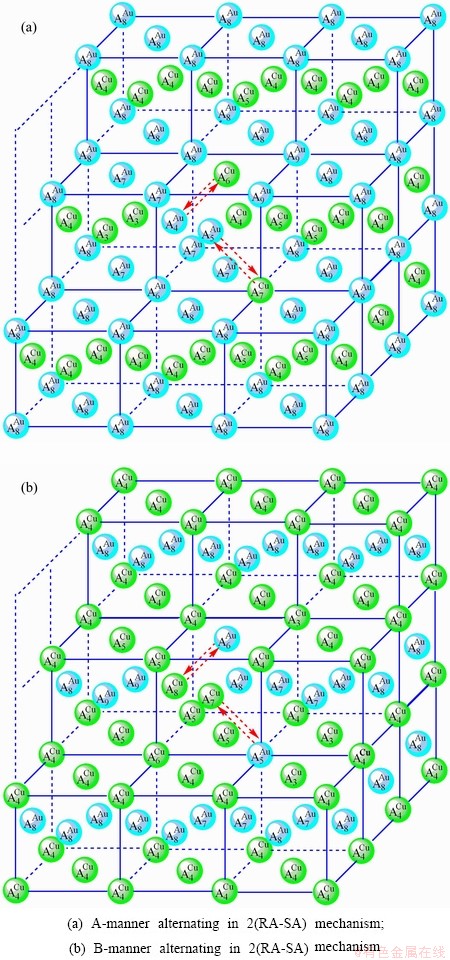
Fig. D.4 2(RA-SA)-cell cluster
3) According to 3(RA-SA) mechanism of three pairs of the - type in a single cell of the AuCuI()(Fig. D.5, Tables D.1 and D.2), the order in AG-concentrations in the 3(RA-SA)-cell cluster consisting of a central 3(RA-SA)-cell and its 26 neighbouring cells is as follows (atomic fraction, %):
After A-manner alternating 3(RA-SA) mechanism (Fig. D.5(a)),
 (D.8)
(D.8)
After B-manner alternating 3(RA-SA) mechanism (Fig. D.5(b)),
 (D.9)
(D.9)
Because they have the same probability, their mean results are
 (D.10)
These results demonstrate that the 3(RA-SA) mechanism can be suitable to simulate AG-concentration order in the beginning period on disordering AuCuI (). The slight difference between Eq. (D.10) and Eq. (D.1) may be caused by supposing that the neighbouring cells have no alternating of atoms. The modified results are presented in Appendix D.4.
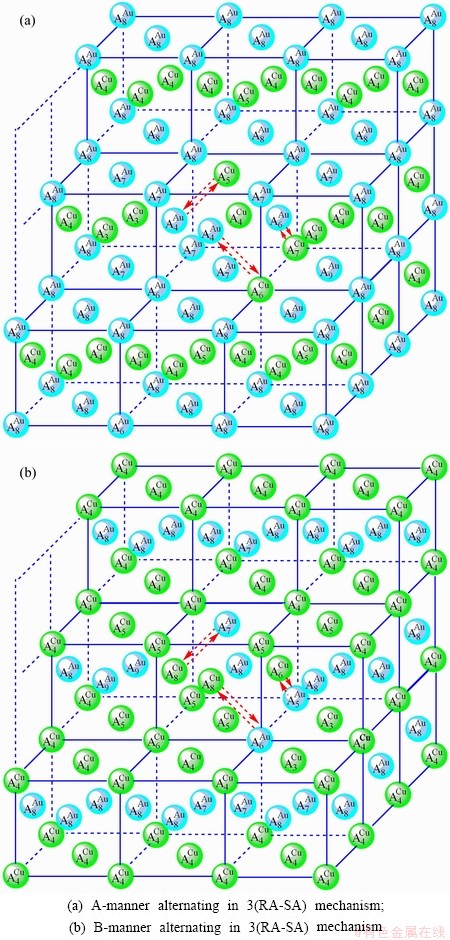
Fig. D.5 3(RA-SA)-cell cluster
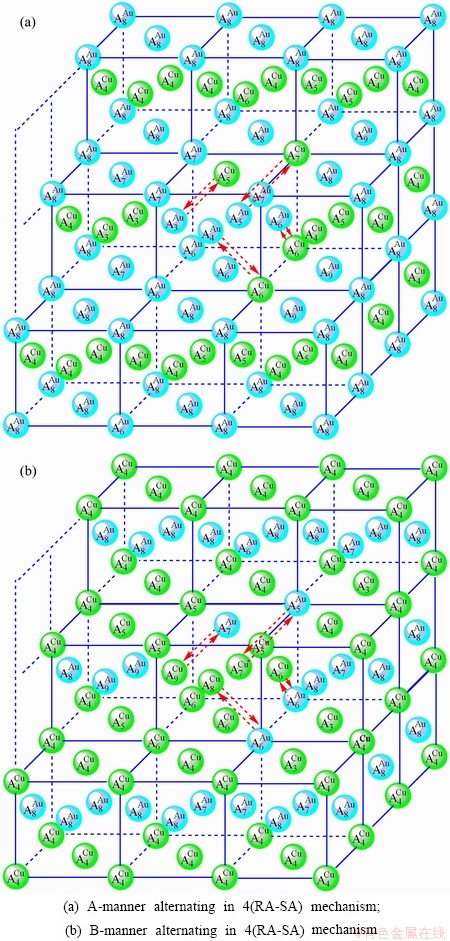
Fig. D.6 4(RA-SA)-cell cluster
4) According to 4(RA-SA) mechanism of four pairs of the - type in a single cell of the AuCuI()(Fig. D.6, Tables D.1 and D.2), the order in AG-concentrations in the 4(RA-SA)-cell cluster consisting of a central 4(RA-SA)-cell and its 26 neighbouring cells is as follows (atomic fraction, %):
After A-manner alternating 4(RA-SA) mechanism (Fig. D.6(a)),
 (D.11)
After B-manner alternating 4(RA-SA) mechanism (Fig. D.6(b)),
 (D.12)
Because they have the same probability, their mean results are
 (D.13)
These results demonstrate that the 4(RA-SA) mechanism cannot be suitable to simulate AG-concentration order in the beginning period on disordering AuCuI().
D.3 Ratio (M1:M2) between AuCuI()- and 3(RA-SA)-cells
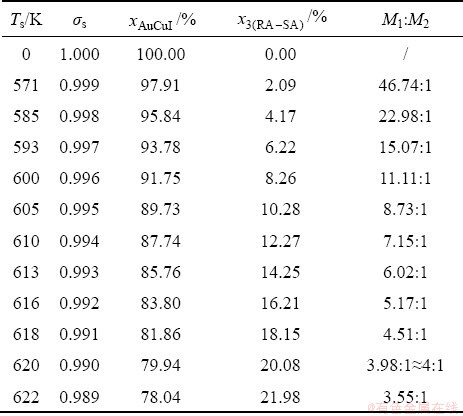
During the growing period of the high order degree AuCu(H) alloy, the decrease in order degree of the AuCu(H) alloy is reached through decreasing number of the AuCuI()-cells and increasing number of the 3(RA-SA)-cells. According to AG-concentrations in the 3(RA-SA)-cell cluster, the ratio (M1:M2) between AuCuI()- and 3(RA-SA)-cells can be calculated by Eq. (D.10) and Eq. (D.14) and the results are listed in Table D.3. The results show that as ��s=0.990, M1:M2=79.94:20.08��4:1. The sum (M1+M2)=5 is equal to the experimental mean spacing between two successive boundaries of the SPAP-AuCuII.

 (Eq.(D.14))
where  and
and  denote the percent of AuCuI()-cell clusters and 3(RA-SA)-cell clusters, respectively, and
  +=1; the
  ,,,,
,,,, ,
, ,,,,,
,,,,, and ,,,,,)AuCu(H) denote respectively AG-concentrations in the AuCuI()- cell cluster, 3(RA-SA)-cell cluster and high order degree AuCu(H) alloy with order degree ��s. The latest term can be found from Table B.1.
Table D.3 Systematic correlativity of temperature (Ts), order degree (��s), percent and
and  of AuCuI ()-cell cluster and 3(RA-SA)-cell cluster and ratio (M1:M2) of the numbers between AuCuI-cells and 3(RA-SA)- cells in AuCu(H) alloy, during beginning period on disordering AuCuI()
D.4 Order degree of 3(RA-SA)-cell cluster
Supposing (M1:M2)=4:1 at ��s=0.990, the AG-concentrations of the 3(RA-SA)-cell cluster can be calculated by Eq. (D.14), which are respectively (atomic fraction): (1.178%), (0.049%), (0.166%), (9.420%), (34.418%) and (4.710%). Comparing these results with AG- concentrations in Table B.1, we have found that the experimental order degree of the 3(RA-SA)-cell cluster is equal approximately to 0.939, which may represent the mean order degree of 3(RA-SA)-cell clusters. Therefore, the properties of AuCu alloy with the order degree (0.939) may represent the mean properties of 3(RA-SA)-cell clusters (i.e., antiface boundary region).
D.5 Starting temperature of 3(RA-SA) mechanism
The mixed Gibbs  ,
,  , and
, and  curves of the AuCuI() with order degree ��=1, AuCu alloy with order degree ��=0.939, AuCu alloy with experimental subequilibrium order degree ��s and AuCu alloy with theoretical equilibrium order degree ��e are shown in Fig. D.7. The starting temperature of the 3(RA-SA) mechanism is determined by the intersection point of the
  and curves, it is 355 K. As the temperature is higher than this temperature, the 3(RA-SA) mechanism can only take place, because the Gibbs energy
  is lower than
  and
and  . It means that the beginning temperature Tonset on disordering AuCuI() should be higher than 355 K, and that the AuCuI() is permanently stable in the temperature range 0 K��T��355 K, though it subequilibrium.
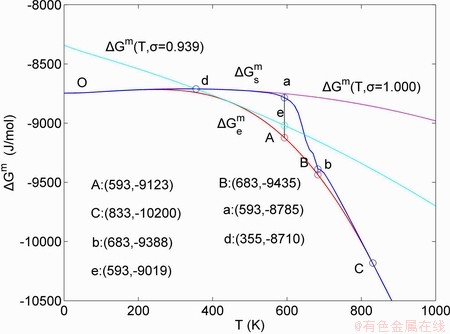
Fig. D.7 Mixed Gibbs energy 

 and
and  curves
References
[1] XIE You-qing, LI Xiao-bo, LIU Xin-bi, NIE Yao-zhuang, PENG Hong-jian. Alloy gene Gibbs energy partition function and equilibrium holographic network phase diagrams of AuCu-type sublattice system [J]. International Journal of Communications, Network and System Sciences, 2013, 12(6): 415-442.
[2] XIE You-qing. Systematic science of alloys [M]. Changsha: Central South University Press, 2012: 29-48. (in Chinese)
[3] FEUTELAIS Y, LEGENDRE B, GUYMONT M. New enthalpies determination and in situ X-ray diffraction observations of order/disorder transitions in Au0.5Cu0.5 [J]. Acta Mater, 1999, 47(8): 2539-2551.
[4] BONNEAUX J, GUYMONT M. Study of the order-disorder transition series in AuCu by in-situ temperature electron microscopy [J]. Intermetallics, 1999, 7(7): 797-805.
[5]  B, PFEILER W. The retro-effect in stoichiometric CuAu: A resistometric study [J]. Intermetallics, 1997, 5(7): 501-505.
[6] PFEILER W, B. Atomic ordering in alloys: Stable states and kinetics [J]. Materials Science and Engineering A, 2002, 324(1-2): 34-42.
[7] B, CHALUPA B. Checking the model for dynamic disordering in CuAu [J]. Materials Science and Engineering A, 2002, 324(1-2): 58-61.
[8] MIRANDA G, SILVA FS, SOARES D. Solid state transformations and equilibrium crystal structures of an Au-Cu alloy with shape memory effect [J]. Materials Science Forum, 2012, 730-732: 859- 864.
[9] HULTGREN R, DESIA P D, HAWKINS D T, GLEISER M, KELLEY K K. Selected values of thermodynamic properties of binary alloys [M].
[9] Metal Park, OH: American Society for Metals, 1973: 158.
[10] XIE You-qing. Atomic energies and Gibbs energy functions of Ag-Cu alloys [J]. Science in China, Series E: Technological Science, 1998, 41(2): 146-156.
[11] XIE You-qing, ZHANG Xiao-dong. Atomic volumes and volume functions of Ag-Cu alloys [J]. Science in China, Series E: Technological Science, 1998, 41(2): 157-168.
[12] XIE You-qing, NIE Yao-zhuang, LI Xiao-bo, LIU Xin-bi, PENG Hong-jian, LI Yan-feng. Characteristic atom potential energy partition function of Au3Cu type ordered alloys in FP-SSA framework [J]. The Chinese Journal of Nonferrous Metals, 2011, 21(10): 2489-2501. (in Chinese)
[13] XIE You-qing, ZHANG Xiao-dong. Electronic structures of Ag-Cu alloys [J]. Science in China, Series E: Technological Science, 1998, 41(3): 225-236.
[14] XIE You-qing. A new potential function with many-atom interactions in solid [J]. Science in China, Series A, 1993, 36(1): 90-99.
[15] XIE You-qing. Electronic structure and properties of pure iron [J]. Acta Metallargics et Materialia, 1994, 42(11): 3705-3715.
[16] XIE You-qing, ZHANG Xiao-dong, CHEN Jia-yan. Electronic structure and properties of pure cobalt [J]. Science in China, Series E: Technological Science, 1996, 39(4): 394-403.
[17] OSTP. Materials genome initiative for global competitiveness [R]. Washington D C: Office of Science and Technology Policy, 2011.
[18] KAUFMAN L,  J. CALPHAD, first and second generation-birth of the materials genome [J]. Scripta Materialia, 2014, 70(1): 3-6.
[19] MASTA M, de FORTAINE D. First-principles study of phase stability of Ti-Al intermetallic compounds [J]. J Mater Res, 1993, 8(10): 2554-2568.
[20] SUNDMAN B, FRIES S G, OATES W A. A thermodynamic assessment of Au-Cu system [J]. CALPHAD, 1998, 22(3): 335-354.
[21] SUNDMAN B, FRIES S G, OATES W A. A CALPHAD assessment of the Au-Cu system using the cluster variatiation method [J]. Z Metallkd, 1999, 90(5): 267-273.
AuCuI( )����������·�����ٵ�ԭ���ƶ��»���
л����1,2,3�����콨4�����ı�1,2,3����С��5����ҫׯ6
1. ���ϴ�ѧ ���Ͽ�ѧ�빤��ѧԺ����ɳ 410083��2. ���ϴ�ѧ ��ĩұ���о�Ժ����ɳ 410083��
3. ���ϴ�ѧ ��ĩұ������ص�ʵ���ң���ɳ 410083��4. ���ϴ�ѧ ��ѧ����ѧԺ����ɳ 410083��
5. ��̶��ѧ ���Ͽ�ѧ�빤��ѧԺ����̶ 411105��6. ���ϴ�ѧ ���������ѧԺ����ɳ 410083
ժ Ҫ���������ɻ�����ɵ� AuCuI()�����������ʵ��·��Ϊ����������3�����ֺ�1������������AuCuI()��������¶ȱ仯���ֽṹ�ȶ��Ե����������� ��������������Զ���������ܣ����������ʵ��·������ƽ��ģ�����AuCuI()��Ӧ�¶ȱ仯�ı�ṹ��ԭ���ƶ��»����ǺϽ����ġ����ͬ�����������ƣ� ��������ǷǾ����Ժ͵ݴ��Ե���ƽ��ת�䣻�����������д�����������ȣ����´��������¶Ⱥ������ٶ����������¶Ƚ��͵ġ��淴ЧӦ��������ν�ġ�RetroЧӦ��������ʵ������·������������һ������ƽ��ȫϢ����·��ͼ��
�ؼ��ʣ������仯����Ͻ������������ת�䣻���ͬ���������ƣ�����ѧ���ʣ�ƽ�����ƽ��ȫϢ����·��ͼ
(Edited by Yun-bin HE)
Foundation item: Project (51071181) supported by the National Natural Science Foundation of China; Project (2013FJ4043) supported by the Natural Science Foundation of Hunan Province, China
Corresponding author: You-qing XIE; Tel: +86-731-88879287; E-mail: xieyouq8088@163.com
DOI: 10.1016/S1003-6326(14)63464-6
Abstract: Taking experimental path on disordering AuCuIcomposed of and stem alloy genes as an example, three discoveries and a method were presented. The ability of AuCuIto keep structure stabilization against changing temperature is attributed to the fact that the and potential well depths greatly surpass their vibration energies, which leads to the subequilibrium of experimental path. A new atom movement mechanism of AuCuIto change structure for suiting variation in temperature is the resonance activating-synchro alternating of alloy genes, which leads to heterogeneous and successive subequilibrium transitions. There exists jumping order degree, which leads to the existence of jumping Tj-temperature and an unexpected so-called ��retro-effect�� about jumping temperature retrograde shift to lower temperatures upon the increasing heating rate. A set of subequilibrium holographic network path charts were obtained by the experimental mixed enthalpy path method.
