
J. Cent. South Univ. (2017) 24: 203-216
DOI: 10.1007/s11771-017-3421-0

Vertical-to-horizontal response spectral ratio for offshore ground motions: Analysis and simplified design equation
CHEN Bao-kui(�±���)1, WANG Dong-sheng(������)1, 2, LI Hong-nan(�����)1,
SUN Zhi-guo(���ι�)2, LI Chao(�)1
1. Faculty of Infrastructure Engineering, Dalian University of Technology, Dalian 116024, China;
2. Road and Bridge Engineering Institute, Dalian Maritime University, Dalian 116026, China
 Central South University Press and Springer-Verlag Berlin Heidelberg 2017
Abstract:
In order to study the differences in vertical component between onshore and offshore motions, the vertical-to-horizontal peak ground acceleration ratio (V/H PGA ratio) and vertical-to-horizontal response spectral ratio (V/H) were investigated using the ground motion recordings from the K-NET network and the seafloor earthquake measuring system (SEMS). The results indicate that the vertical component of offshore motions is lower than that of onshore motions. The V/H PGA ratio of acceleration time histories at offshore stations is about 50% of the ratio at onshore stations. The V/H for offshore ground motions is lower than that for onshore motions, especially for periods less than 0.8 s. Furthermore, based on the results in statistical analysis for offshore recordings in the K-NET, the simplified V/H design equations for offshore motions in minor and moderate earthquakes are proposed for seismic analysis of offshore structures.
Key words:
1 Introduction
Owing to lack of real ground motion recordings on the seafloor, onshore recordings are commonly selected for seismic design of offshore structures. The American Petroleum Institute (API) presented that the seismic analysis of a fixed offshore platform should input a combination of vertical and horizontal ground motions, and it recommends vertical-to-horizontal response special ratio (V/H)=0.5 [1]. However, CHEN et al [2] found that the vertical component for offshore ground motions is significantly different with onshore ground motions. The V/H for offshore ground motions is much lower than that for onshore ground motions at short periods. In fact, the natural period for some offshore structures in shallow sea is lower than 1 s. For example, the natural period of some gravity platforms in China Bohai Sea (the water depth is lower than 50 m) is around 1 s [3]. If the V/H (V/H=0.5) is used in seismic analysis of these offshore structures for low natural period, the vertical ground motion will be overestimated. In order to reasonably confirm the V/H for offshore ground motion, the simplified V/H design equations for offshore motions are presented in this article based on the offshore ground motion recordings selected from the K-NET in Japan.
The research on vertical ground motion on the seafloor were mostly used the recordings from the SEMS project in the past decades. BOORE and SMITH [4] analyzed the vertical-to-horizontal response spectral ratio (V/H) for offshore ground motions from 8 earthquakes. The ground motions were recorded at 5 offshore stations from the SEMS project in the USA. The result indicated that the vertical component of offshore motions was low, particularly at short periods. DIAO et al [5] analyzed the vertical motions for the same recordings with Boore and Smith, and studied the effect of seawater on the vertical motion by a theoretical method. It concluded that the seawater and soft surface can influence on the vertical component of offshore motions. The effect of seawater on P waves from the seabed is more important than SV waves. Moreover, research on the offshore ground motions from the SEMS remained insufficient due to a lack of enough offshore motion recordings, especially for the recordings including both onshore and offshore motions in the same earthquake event. It is difficult to directly compare the differences in the V/H between onshore and offshore ground motions. Recently, six seismographs on the seafloor were upgraded by the K-NET since 2006 and recorded some high-quality offshore recordings. Fortunately, the adjacent onshore stations also recorded many high-quality ground motions. Therefore, some onshore and offshore ground motion recordings during 9 earthquake events were selected from the K-NET to study the characteristics of vertical ground motion on the seafloor.
Although the study on the vertical ground motion on the seafloor is limited due to a lack of offshore recordings, the vertical ground motion on land has been researched much [6�C9]. Many remarkable vertical ground motions on land were recorded and some structures were directly damaged by those motions. Examples include the Loma Prieta earthquake in 1989 [10], the Kobe earthquake in 1995 [11], and the Wenchuan earthquake in 2008 [12]. Furthermore, many ground motion recordings indicated that the PGA of vertical component may be even higher than that of horizontal component, such as in 1994 Northridge earthquake, the recorded vertical acceleration was 1.18 g, while the vertical-to-horizontal peak ground acceleration ratio (V/H PGA ratio) was 1.79 [13]. In 1979 Imperial Valley earthquake, the mean value for V/H PGA ratios of 30 vertical recordings was 0.77, and the mean value for V/H PGA ratios of 11 near-fault recordings (epicentral distances are about 10 km) was 1.12 [14]. Based on the research methods of vertical ground motion on land, the analysis for the vertical ground motion on the seafloor were discussed in this study.
2 Ground motion recordings
2.1 Recording selection
With more than 1000 accelerometers, the K-NET is a strong-motion seismograph network covering the whole Japan [15, 16]. Within the coverage area of the K-NET, the distance between adjacent earthquake stations is less than 25 km. The onshore recordings from the K-NET have been used by some researches [17].
The current research selected the ground motions from 6 offshore stations and 8 adjacent onshore stations in the K-NET. The details on 6 offshore stations are listed in Table 1. Figure 1 shows the location of the stations used in this article. Black circles represent the onshore stations; while white circles represent the offshore stations. The distances among the 6 offshore stations range between 10 and 20 km in Sagami Bay. And the distances between the onshore stations used in this study and their adjacent offshore station are less than 50 km. The water depths of these offshore stations range from 933 m to 2339 m.
Table 1 Details on offshore stations in K-NET database


Fig. 1 Distribution of onshore and offshore stations used in this work
In order to select effective offshore ground motions in the K-NET, the earthquake events are selected based on the follow criteria. At first, the earthquake magnitude should be larger than Mw 5.0. Then, the PGA of horizontal ground motions at 6 offshore stations should be larger than 30 gal in one earthquake. At last, there should be some effective recordings at adjacent onshore stations. In addition, to compare the differences in vertical ground motions between onshore and offshore stations reasonably, the onshore stations are selected by the criteria as follows: Firstly, the onshore stations should be close to the offshore stations. Secondly, the PGA of horizontal components should be larger than 30 gal. Thirdly, the onshore sites should be on stiff soil site and the average of shear-wave velocity should be between 180 m/s and 360 m/s.
Considering the above criteria, 9 earthquake events with magnitudes from Mw 4.9 to Mw 9.0 are selected. Of these, the hypocenters in 6 earthquakes are on the seafloor, and the other 3 are on land. Their hypocenter depths range from 7 to 88 km. Each earthquake event is listed by its occurrence date. Table 2 presents the detailed information about the 9 earthquake events.
A total of 54 offshore and 30 onshore motion recordings in 9 earthquake events from the K-NET are selected. There should be 6 offshore and 5 onshore recordings in each earthquake. But only offshore recordings were selected in 3 earthquake events due to the lack of effective onshore recordings. The detailed information about these recordings is provided in Appendix.
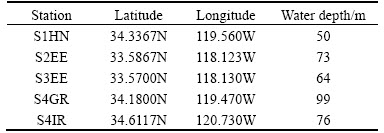
The offshore recordings in the SEMS project were selected to compare with the statistical results of offshore motions in the K-NET. The SEMS project is carried out by the Sandia National Laboratory. All the offshore stations are embedded on the seafloor of Southern California under the water depth from 50 m to 217 m. The recordings in 8 earthquake events from 1971 to 1997 are selected. The earthquake magnitudes selected in the SEMS range from Mw 4.7 to Mw 6.1. The earthquake events in the SEMS are listed in Table 3. The information of offshore stations in the SEMS is summarized in Table 4. More information can be found in Ref. [4]. Because of a scarcity of onshore recordings, only offshore motions can be selected from the SEMS database.
2.2 Site condition
The average shear wave velocity is one important parameter to evaluate the site condition. In the K-NET, the total calculative depth of soil layer (H) range between 10 and 20 m. The average shear wave velocity`Vs can be defined by
 (1)
(1)
where H and hi are the total depth of soil layer and the depth of each soil layer respectively, and Vsi is the shear wave velocity of corresponding soil layer.
The K-NET provides geotechnical characterizations for onshore stations. Detailed site condition and data about stations in the K-NET can be found on the website http://www.kyoshin.bosai.go.jp. Unfortunately, the K-NET does not provide soil information of offshore stations (KNG201�CKNG206). So, some estimations of offshore site condition are given as follow.
EGUCHI et al [18] pointed out that the most of the offshore stations in the K-NET were underlain not by soft or unconsolidated soil layers, but by sediments consisting of sand, small-sized rocks or pebbles. Moreover, the`Vs values of onshore stations near Sagami Bay in the K-NET (these onshore stations are near the offshore stations and at the shoreline) are 90�C380 m/s, and the average value is about 230 m/s. It should be noted that a thick sludge layer being on the Sagami Bay seafloor [19], so the`Vs values of some offshore stations in K-NET may be lower than those of the onshore stations.
Table 2 Information of 9 earthquake events from K-NET database

Table 3 Data of earthquake events in SEMS
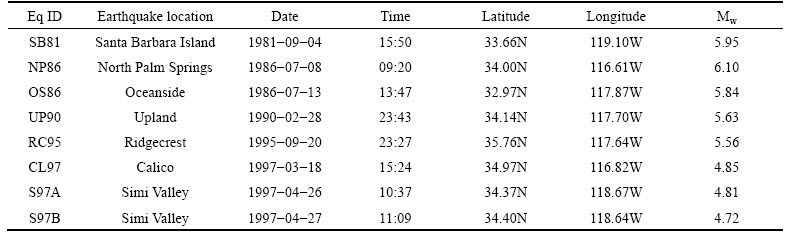
Table 4 Information of offshore stations in SEMS
Moreover, it was estimated that the`Vs value of the SEMS offshore sites near Southern California in the United States is about 220 m/s [4].
3 Analysis of V/H PGA ratio
3.1 V/H PGA ratio
Figure 2 shows the acceleration time histories at offshore station KNG203 for 2009-08-11 and 2011-03- 11 earthquakes. Figure 2, the vertical PGA (U-D) is 6 and 18 gal respectively, which is only about 20% of the horizontal PGA (34 and 91 gal in the E-W direction; 35 and 69 gal in the N-S direction). Figure 3 shows the acceleration time histories at onshore station TKY010 for 2009-08-11 and 2011-03-11 earthquakes. As shown in Fig. 3, the vertical PGA is 38 and 135 gal, which is about 50% of the horizontal PGA (51 and 213 gal in the E-W direction; 74 and 236 gal in the N-S direction). The vertical components of acceleration time histories at offshore stations are lower than at onshore stations. Noted, these acceleration time histories are randomly selected from the ground motions used in this work.

Fig. 2 Two suites of acceleration time histories for offshore station KNG203:
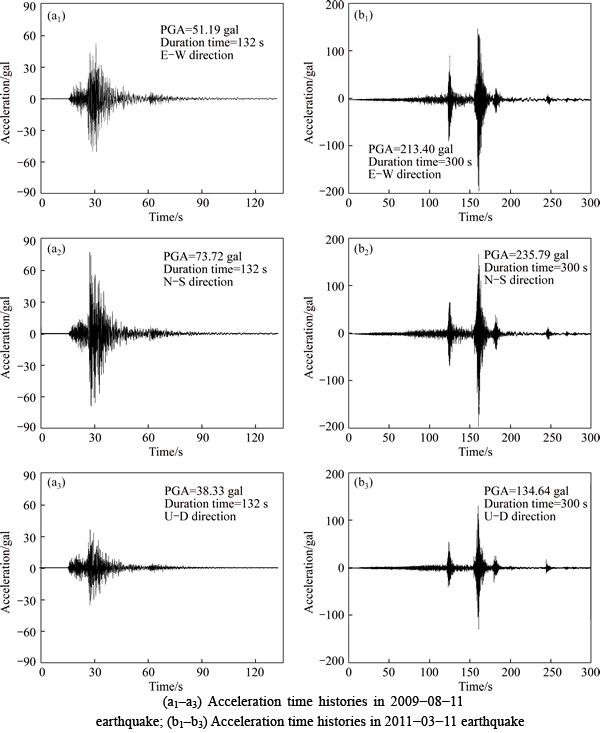
Fig. 3 Two suites of acceleration time histories for onshore station TKY010:
The Vertical-to-Horizontal PGA ratio (V/H PGA ratio) is used to further compare the PGA of vertical component between onshore and offshore motions. The V/H PGA ratio is calculated as av/ah, where av is vertical PGA, and ah is the PGA of one horizontal component. So, there are two V/H PGA ratios for one three-dimensional recording. The average V/H PGA ratio for offshore ground motions used in this research is 0.213; while it is 0.474 for onshore ground motions in the K-NET.
3.2 Influence of earthquake magnitude, epicentral distance, and site condition on V/H PGA ratio
Magnitude, epicentral distance, and site condition are important parameters that affect the V/H PGA ratio. Figure 4 shows the influence of epicentral distance on the V/H PGA ratio in earthquakes with the same magnitude. The ratios in this figure include the data of 8 earthquakes in the K-NET except for the data in theNortheast Pacific earthquake (Mw 9.0) occurred on 2011-03-11. The epicentral distance and magnitude have a large gap of the data between the Northeast Pacific earthquake and other earthquakes. In the earthquakes for same magnitude, the V/H PGA ratio does not present remarkable regularity along with the epicentral distances.

Fig. 4 Distribution of V/H PGA ratios for offshore motions along with epicentral distances in earthquakes with same magnitude
Figure 5 illustrates the influence of earthquake magnitude on the average V/H PGA ratio for offshore motions in each earthquake. The offshore recordings are classified whether the earthquakes occurred on the seafloor or land. It is found that the V/H PGA ratio of offshore motions for earthquakes occurring on the seafloor (the ratios are between 0.2 and 0.28) is higher than that occurring on land (the ratios are between 0.15 and 0.2). The influence of the site condition, magnitude, hypocenter depth, and epicentral distance are little in the earthquakes for different hypocenter locations. For example the magnitude, hypocenter depth, and epicentral distance of offshore recordings are similar between 2006-05-02 (hypocenter occupied on the seafloor) and 2007-10-01 (hypocenter occupied on land) earthquakeand the recordings are selected from the same offshore stations. So, it is speculated that the propagation path may be a reason for the difference in the average V/H PGA ratio for offshore ground motions between different hypocenter locations.
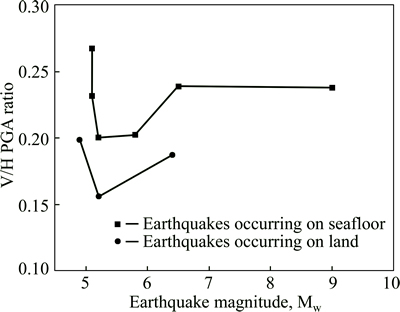
Fig. 5 Relationship between magnitude and average V/H PGA ratios for offshore motions in each earthquake
Figure 6 shows a histogram of the V/H PGA ratio for offshore motions arranged for earthquake events and offshore stations. The earthquake events are arranged as the numbers listed in Table 2. The V/H PGA ratios are from 6 offshore stations (KNG201�CKNG206) in each earthquake. It is found some regularity for the V/H PGA ratios between different offshore stations. For example, in all earthquake events, the V/H PGA ratios at KNG201 station are all less than 0.15, which is almost the lowest among the offshore stations. And the V/H PGA ratios at KNG202 station are between 0.35 and 0.55, which is almost the largest in each earthquake. The V/H PGA ratios at other stations also present the same characteristic. Because the earthquake magnitude and the hypocenter depth are the same and the epicentral distances between different offshore stations are similar in the same earthquake, the V/H PGA ratio between different offshore stations might be influenced by topography or local site condition. The detailed analysis cannot be done due to a lack of the information about the topography and the site condition at offshore sites. However, the V/H PGA ratio at onshore stations can be influenced by the topography and site condition [20, 21].
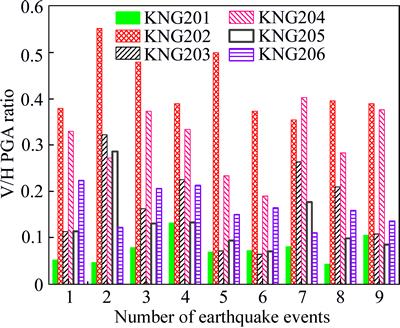
Fig. 6 A comparison of V/H PGA ratio at 6 offshore stations for 9 earthquake events (earthquake events are arranged as the numbers listed in Table 2)
4 Analyses of response spectra and vertical- to-horizontal response spectral ratio
4.1 Elastic response spectra
Some recordings in the K-NET are selected to investigate the differences in response spectra between onshore and offshore motions. Figures 7 and 8 show the 5% damped acceleration response spectra and normalized response spectra (amplification factor spectrum), respectively. The period of acceleration response spectra and normalized response spectra is 0.04�C5.0 s. The ground motion recordings are selected from offshore station KNG203 and onshore station TKY010 in 2009-8-11 and 2011-3-11 earthquakes, which are as the same as the recordings in Figs. 2 and 3. A normalized response spectrum is calculated by the acceleration response spectra dividing by the PGA of acceleration time histories.
For the acceleration response spectra shown in Fig. 7, the horizontal response spectra between onshore and offshore motions are similar. However, the spectral values for vertical component are only 1/10 to 1/3 of the values for horizontal components at offshore station KNG203 for periods less than 0.8 s, which is significantly lower than that at onshore station TKY010 (the onshore response spectral values for vertical components are 1/3 to 1/2 of the values for horizontal components). The peak of vertical response spectra for offshore motions is at the periods longer than 1 s and that for onshore motions is at the periods around 0.2 s.
For the normalized response spectra that removing the influence of the PGA for offshore ground motion in Fig. 8, the vertical response spectra for offshore motions in both 2009-08-11 and 2011-03-11 earthquake are lower than horizontal response spectra for periods less than 0.5 s. Then, the vertical response spectra for offshore ground motions increase rapidly with the periods and exceed the horizontal spectra for periods longer than 0.8 s. However, the vertical and horizontal response spectra for onshore motions are similar for periods ranging from 0.04 to 5 s. The peak of vertical response spectra for offshore motions is at the periods longer than 1 s, but that for onshore motions being at the periods around 0.2 s.

Fig. 7 Vertical and horizontal acceleration response spectra at offshore station KNG203, and onshore station TKY010:

Fig. 8 Vertical and horizontal normalized response spectra at offshore station KNG203 and onshore station TKY010:
As shown in Figs. 7 and 8, the vertical component for offshore ground motion is suppressed at short to intermediate period. This observation result is consistent with the theory calculation of CROUSE and QUILTER [22]. They predicted that vertical ground motion can be affected at the frequency of P wave resonance in the seawater. Near the romance frequency zones, the reduction of vertical ground motion is probably due to a conversion of S wave motion into P wave motion on the seafloor [23]. Moreover, the seawater layer can increase the pore pressure and saturation of the sediments on the seafloor. YANG and SATO [24] presented that the degree of saturation may produce substantial influence on the amplification, both amplitude and frequency content.
4.2 Vertical-to-horizontal response spectral ratio
Through calculating vertical and horizontal acceleration response spectra respectively, the vertical- to-horizontal response spectral ratio (V/H) can be obtained by vertical acceleration response spectral value divided by the mean value of two horizontal response spectra. Then, the V/H can be plotted as a curve of the ratio along periods.
When some ground motions are used to calculate an average V/H, a statistical variation coefficient is proposed to measure the statistical dispersion. The variation coefficient can be calculated as the standard deviation divided by the mean value.
The average V/H for 54 offshore and 30 onshore motions in the K-NET are compared in Fig. 9. The differences in the V/H between onshore and offshore motions are summarized as follows: For periods less than 0.8 s, the V/H for offshore motions is between 0.2 and 0.3, which is smaller than the V/H for onshore motions (30 to 50% of the onshore values). For periods between 0.8 and 2 s, the V/H for offshore motions increases along with the period. For periods longer than 2 s, the V/H for onshore and offshore motions both fluctuates between 0.4 and 0.6. On the whole, the curve of the V/H for offshore motions ascends as Z-shaped, while the V/H for onshore motions fluctuates between 0.4 and 0.6 for periods between 0.04 and 5 s.
In Fig. 9, we also compared the average V/H for offshore motions in the SEMS with that in the K-NET. The water depth above the offshore sites in the K-NET is 902�C2339 m, which is obviously deeper than that in the SEMS (50-217 m), but the V/H for offshore motions between the K-NET and the SEMS database are almost consistent with each other. It indicates that the influence of water depth on the V/H for offshore motion is not clear. So, it should be further study. The variation coefficients of V/H for both the onshore and offshore motions are less than 1.0 in Fig. 9(b). So, the statistical dispersion of the data can be accepted.
4.3 Influence of earthquake magnitude, and epicentral distance on vertical-to-horizontal response spectral ratio
The offshore ground motions from the K-NET are classified into 5 groups according to the magnitude and the epicentral distance R. For 4.9��Mw��5.2 and R��50 km, the offshore recordings are classified to MiSR (minor earthquake and small epicentral distance) group. For 4.9��Mw��5.2 and 50 km
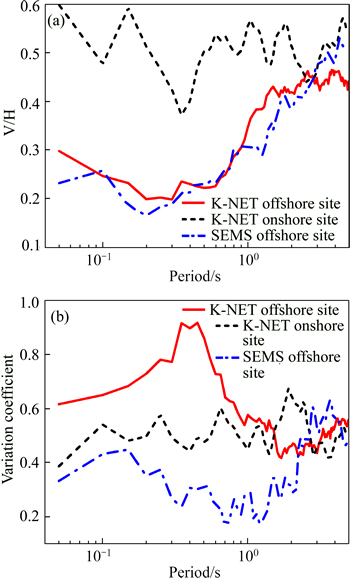
Fig. 9 Average V/H (a) and corresponding variation coefficient (b) for onshore and offshore motions in K-NET and for offshore motions in SEMS
Figure 10 shows the V/H and corresponding variation coefficient for offshore motions in different groups. As shown in Fig. 10, the V/H in each group is less than 0.3 for periods less than 0.6 s. The V/H for offshore motions in minor earthquake is less than 0.4 for periods longer than 0.9 s, and the V/H is similar in MiSR and MoSR groups. Moreover, the V/H for offshore motions in moderate and large earthquakes is between 0.4 and 0.7 for periods longer than 0.9 s, and the V/H in MoSR group is larger than the V/H in MoMR. The Peak for the V/H in moderate or large earthquake is 0.6 to 0.7 for periods around 3 s. The statistical variation coefficients are less than 1.0 in Fig. 10(b).
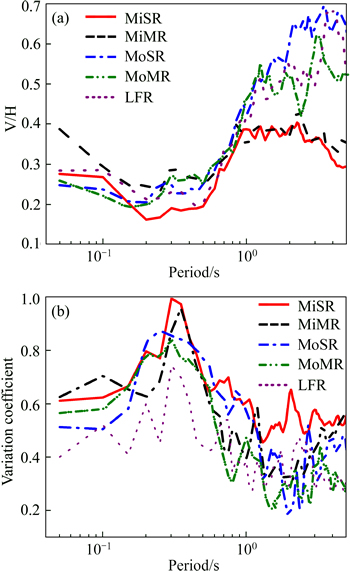
Fig. 10 V/H (a) and corresponding variation coefficient (b) for offshore motions with different magnitudes and epicentral distances
5 Simplified design equations of V/H for offshore motions
The vertical ground motion need be inputted in seismic analysis of offshore structures in some cases. This research found that it is unreasonable to use a constant V/H value (for example V/H=0.5) for different offshore structures. So, a tentative simple V/H for offshore ground motions and its simple design equation are proposed.
The epicentral distances of offshore recordings in the Northeast Pacific earthquake are all larger than 400 km, which is so different with other earthquakes. Therefore, the recordings in the Northeast Pacific earthquake are removed from the statistical analysis for simplified V/H. design equation. Although the V/H is different for offshore ground motions between short and moderate epicentral distances, the difference is not large enough and can be ignored for seismic design of offshore structure. But the difference in the V/H for offshore ground motions between minor and moderate earthquakes is obvious at long periods. Therefore, the simplified V/H for offshore ground motions and its simplified design equations are summarized for minor and moderate earthquakes base on real offshore recordings. Simplified design equations for large earthquake will be presented for selecting more recordings in future. The earthquake magnitude in minor earthquake is between Mw 4.9 and Mw 5.2, and that in moderate earthquake is between Mw 5.8 and Mw 6.5. This classification is as the same as the above section. The epicentral distances of offshore ground motions in minor and moderate earthquakes are all smaller than 136 km.
The simplified V/H for offshore ground motions in minor and moderate earthquake is shown in Fig. 11 and its simplified design equations are given by Eqs. (2) and (3). The simplified V/H in both minor and moderate earthquake is 0.3 for periods less than 0.6 s. The simplified V/H in minor earthquake is 0.4 for periods longer than 0.9 s. The simplified V/H in moderate earthquake is 0.65 for periods longer than 1.5 s.
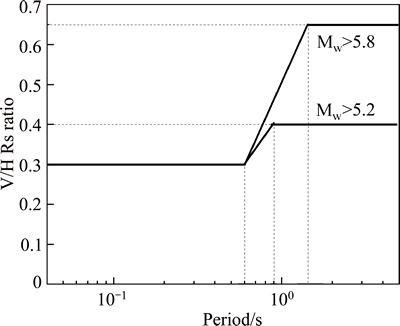
Fig. 11 Simplified V/H for offshore motions in minor and moderate earthquakes
The V/H shows a linear growth for periods between 0.6 s and 0.9 s for minor earthquake (between 0.6 s and 1.5 s for moderate earthquake). On the whole, the simplified V/H for offshore motions in minor earthquake is smaller than in moderate earthquakes for periods longer than 0.6 s.
When the magnitude is smaller than Mw 5.2, the simplified design equation of V/H for offshore ground motions is given by
 (2)
(2)
where T is the period. When the magnitude is between Mw 5.8 and Mw 6.5, the simplified design equation of V/H for offshore ground motions is given by

 (3)
(3)
Furthermore, the simplified V/H compares with the V/H for offshore motions in minor and moderate earthquake groups from the K-NET in Fig. 12. In practical engineering design, when the earthquake magnitude is between Mw 5.2 and Mw 5.8, the V/H for offshore motions should select Eq. (3) for safety.
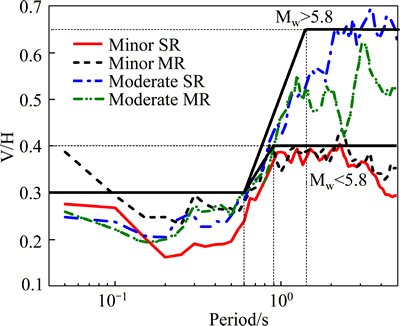
Fig. 12 A comparison between simplified and average V/H values for offshore motions in minor and moderate earthquakes
6 Conclusions
1) Through statistical analysis for the recordings in the K-NET, the average V/H PGA ratio at offshore stations and onshore stations is 0.213 and 0.474, respectively. Moreover, it is found that the V/H PGA ratio for offshore motions in the earthquake occurring on the seafloor is higher than that on land, and which may be induced by propagation path. Because the V/H PGA ratios at 6 offshore stations are different in every earthquake and have same regularity in 9 earthquakes, it is concluded that the topography and local site condition could influence on the V/H PGA ratio for offshore motions.
2) The differences in the V/H between onshore and offshore motions are obvious. The V/H for offshore motions is smaller than that for onshore motions, especially for periods less than 0.8 s. In spite of a large difference in water depths, the average V/H for offshore motions between the K-NET and the SEMS databases is similar. It is necessary to further study the influence of water depth on the V/H for offshore motions.
3) Base on the statistical analysis of V/H for offshore motions in the K-NET, the simplified V/H design equations for offshore ground motions in minor and moderate earthquakes are summarized. The results present that the simplified V/H for both minor and moderate earthquakes is 0.3 for periods lower than 0.6 s. Moreover, the simplified V/H for moderate earthquake is larger than that for minor earthquake at long periods. The simplified V/H for minor earthquake is 0.4 for periods longer than 0.9 s and that for moderate earthquake is 0.65 for periods longer than 1.5 s.
Appendix
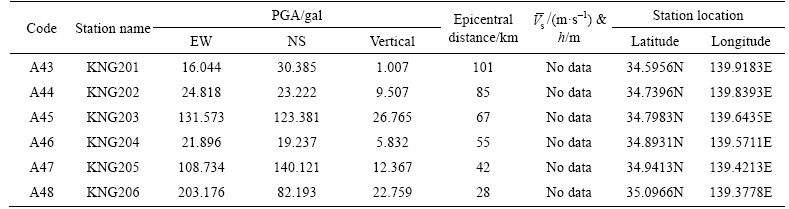
A1 Information of ground motion recordings in 2006-04-21 earthquake (A group: offshore stations; B group: onshore stations)
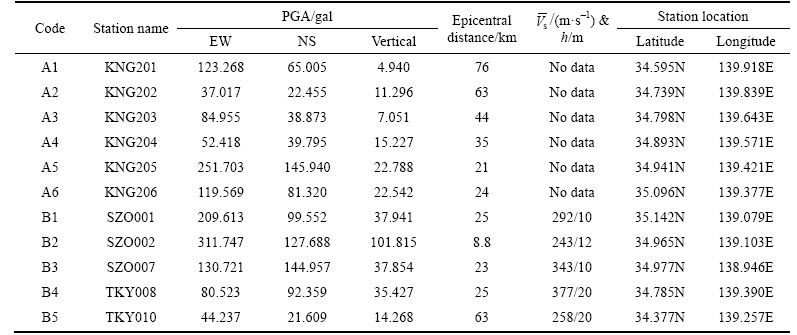
A2 Information of ground motion recordings in 2006-05-02 earthquake

A3 Information of ground motion recordings in 2009-08-11 earthquake

A4 Information of ground motion recordings in 2011-03-11 earthquake

A5 Information of ground motion recordings in 2011-3-15 earthquake
A6 Information of ground motion recordings in 2012-07-03 earthquake
A7 Information of ground motion recordings in 2006-10-14 earthquake

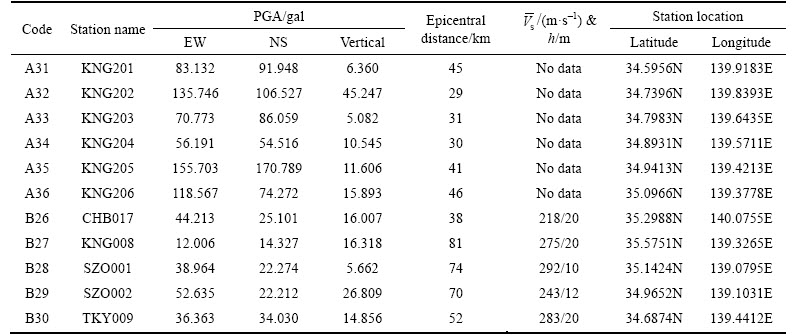
A8 Information of ground motion recordings in 2007-10-01 earthquake
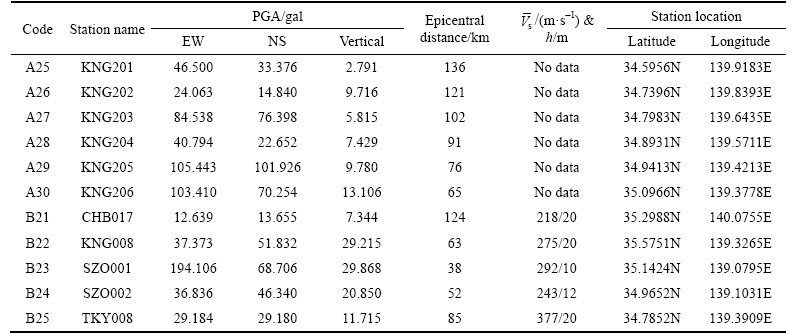
A9 Information of ground motion recordings in 2011-02-05 earthquake

References
[1] RP2A-WSD A P I. Recommended practice for planning, designing and constructing fixed offshore platforms�Cworking stress design [R]. Houston: American Petroleum Institute, 2000.
[2] CHEN Bao-kui, WANG Dong-sheng, LI Hong-nan, SUN Zhi-guo, SHI Yan. Characteristics of earthquake ground motion on the seafloor [J]. Journal of Earthquake Engineering, 2015, 19(6): 874�C904.
[3] LU Yue-jun, PENG Yan-ju, TANG Rong-yu, SHA Hai-jun, ZHAO Jian-tao. The discussion on some problems in seismic design code of offshore platform in China [J].Progress in Geophysics, 2008,23(2): 443�C449. (in Chinese)
[4] BOORE D M, SMITH C E. Analysis of earthquake recordings obtained from the seafloor earthquake measurement system (SEMS) instruments deployed off the coast of southern California [J]. Bulletin of the Seismological Society of America, 1999, 89(1): 260�C274.
[5] DIAO Hong-qi, HU Jin-jun, XIE li-li. Effect of seawater on incident plane P and SV waves at ocean bottom and engineering characteristics of offshore ground motion records off the coast of southern California, USA [J]. Earthquake Engineering and Engineering Vibration, 2014, 13(2): 181�C194.
[6] AMBRASEYS N N, DOUGLAS J. Near-field horizontal and vertical earthquake ground motions [J]. Soil Dynamics and Earthquake Engineering, 2003, 23(1): 1�C18.
[7] BOZORGNIA Y, CAMPBELL K W. The vertical-to-horizontal response spectral ratio and tentative procedures for developing simplified V/H and vertical design spectra [J]. Journal of Earthquake Engineering, 2004, 8(2): 175�C207.
[8] GULERCE Z, ABRAHAMSON N A. Site-specific design spectra for vertical ground motion [J]. Earthquake Spectra, 2011, 27(4): 1023�C1047.
[9] TEZCAN J, CHENG Q. A nonparametric characterization of vertical ground motion effects [J]. Earthquake Engineering and Structural Dynamics, 2012, 41(3): 515�C530.
[10] BRUNEAU M. Preliminary report of structural damage from the Loma Prieta (San Francisco) earthquake of 1989 and pertinence to Canadian structural engineering practice [J]. Canadian Journal of Civil Engineering, 1990, 17(2): 198�C208.
[11] ELGAMAL A, HE L. Vertical earthquake ground motion records: an overview [J]. Journal of Earthquake Engineering, 2004, 8(5): 663�C697.
[12] OU Jin-ping, LI H. The regional engineering damage and reconstruction strategy in Wenchuan earthquake of China [J]. Journal of Earthquake and Tsunami, 2011, 5(02): 189�C216.
[13] NORTON J A, KING A B, BULL D K, CHAPMAN H E, MCVERRY G H, LARKIN T J, SPRING K C. Northridge earthquake reconnaissance report [J].Bulletin of the New Zealand National Society for Earthquake Engineering, 1994, 27(4): 235�C344.
[14] BOZORGNIA Y, NIAZI M, CAMPBELL K W. Characteristics of free-field vertical ground motion during the Northridge earthquake [J]. Earthquake Spectra, 1995, 11(4): 515�C525.
[15] AOI S, KUNUGI T, FUJIWARA H. Strong-motion seismograph network operated by NIED: K-NET AND KiK-NET [J]. Journal of Japan Association for Earthquake Engineering, 2004, 4(3): 65�C74.
[16] OKADA Y, KASAHARA K, HORI S, OBARA K, SEKIGUCHI S, FUJIWARA H, YAMAMOTO A. Recent progress of seismic observation networks in Japan��Hi-net, F-net, K-NET and KiK-net [J].Earth, Planets and Space, 2004, 56(8): xv-xxviii.
[17] NAGASHIMA F, MATSUSHIMA S, KAWASE H, SANCHEZ- ESMA F J, HAYAKAWA T, SATOH T, OSHIMA M. Application of horizontal-to-vertical spectral ratios of earthquake ground motions to identify subsurface structures at and around the K-NET site in Tohoku, Japan [J]. Bulletin of the Seismological Society of America, 2014, 104(5): 2288-2302.
[18] EGUCHI T, FUJINAWA Y, FUJITA E, IWASAKI S I, WATABE I, FUJIWARA H. A real-time observation network of ocean-bottom- eismometers deployed at the Sagami trough subduction zone, central Japan [J]. Marine Geophysical Researches, 1998, 20: 73�C94.
[19] YAZAWA K, TSUCHIYA H, IKEDA F. Surficial sediment in Tokyo bay and Sagami bay [J]. Bulletin of the Kanagawa Prefectural Fisheries Experiment Station, 1986, 7: 5�C16. (In Japanese)
[20] WU Zhi-jian, WANG Lan-min, WANG Ping, CHEN Tuo, SHI Hang, YANG Xiao-peng. Influence of site conditions on ground motion at far field loess sites during strong earthquake [J]. Journal of Central South University, 2013, 20: 2333�C2341.
[21] POGGI V, EDWARDS B, FAH D. Characterizing the vertical-to- horizontal ratio of ground motion at soft-sediment sites [J]. Bulletin of the Seismological Society of America, 2012, 102(6): 2741�C2756.
[22] CROUSE C B, QUILTER J. Seismic hazard analysis and development of design spectra for maul a platform [C]// Proceedings of Pacific Conference on Earthquake Engineering. New Zealand: PCEE, 1991:137�C148.
[23] TAKAHASHI K, OHNO S, TAKEMURA M, OHTA T, SUGAWARA Y, HATORI T, OMOTE S. Observation of earthquake strong motion with deep borehole: generation of vertical motion propagating in surface layers after S-wave arrival [C]// Proceedings of the 10th World Conference on Earthquake Engineering. Balkema: WCEE, Rotterdam, 1992: 1245�C1250.
[24] YANG J, SATO T. Interpretation of seismic vertical amplification observed at an array site [J].Bulletin of the Seismological Society of America, 2000, 90(2): 275�C285.
(Edited by DENG L��-xiang)
Cite this article as: CHEN Bao-kui, WANG Dong-sheng, LI Hong-nan, SUN Zhi-guo, LI Chao. Vertical-to-horizontal response spectral ratio for offshore ground motions: Analysis and simplified design equation [J]. Journal of Central South University, 2017, 24(1): 203-216. DOI: 10.1007/s11771-017-3421-0.
Foundation item: Project(2011CB013605) supported by the National Basic Research Development Program of China (973 Program); Projects(51178071, 51008041) supported by the National Natural Science Foundation of China; Project(NCET-12-0751) supported by the New Century Excellent Talents Program in University of Ministry of Education of China
Received date: 2015-08-24; Accepted date: 2015-12-25
Corresponding author: WANG Dong-sheng, Professor, PhD; Tel: +86�C13664238592; E-mail: dswang@dlmu.edu.cn
Abstract: In order to study the differences in vertical component between onshore and offshore motions, the vertical-to-horizontal peak ground acceleration ratio (V/H PGA ratio) and vertical-to-horizontal response spectral ratio (V/H) were investigated using the ground motion recordings from the K-NET network and the seafloor earthquake measuring system (SEMS). The results indicate that the vertical component of offshore motions is lower than that of onshore motions. The V/H PGA ratio of acceleration time histories at offshore stations is about 50% of the ratio at onshore stations. The V/H for offshore ground motions is lower than that for onshore motions, especially for periods less than 0.8 s. Furthermore, based on the results in statistical analysis for offshore recordings in the K-NET, the simplified V/H design equations for offshore motions in minor and moderate earthquakes are proposed for seismic analysis of offshore structures.
