
Phase-field simulation of dendritic growth for binary alloys with complicate solution models
LI Xin-zhong(������), GUO Jing-jie(������), SU Yan-qing(������), WU Shi-ping(��ʿƽ), FU Heng-zhi(����־)
(School of Materials Science and Engineering, Harbin Institute of Technology, Harbin 15001, China)
Abstract:
A phase-field method for simulation of dendritic growth in binary alloys with complicate solution models was studied. The free energy densities of solid and liquid used to construct the free energy of a solidification system in the phase-field model were derived from the Calphad thermodynamic modeling of phase diagram. The dendritic growth of Ti-Al alloy with a quasi-sub regular solution model was simulated in both an isothermal and a non-isothermal regime. In the isothermal one, different initial solute compositions and melt temperatures were chosen. And in the non-isothermal one, release of latent heat during solidification was considered. Realistic growth patterns of dendrite are derived. Both the initial compositions and melt temperatures affect isothermal dendritic morphology and solute distributions much, especially the latter. Release of latent heat will cause a less developed structure of dendrite and a lower interfacial composition.
Key words:
phase-field method; simulation; dendritic growth CLC number: TG248; TG244;
Document code: A
1 INTRODUCTION
The formation of complex microstructures during solidification of metals and alloys have fascinated researchers in materials science and related areas for so many years, especially the formation of dendritic structures. In many commercial alloys, microstructural features that determine the mechanical integrity of a cast ingot, such as solute segregation, grain size and porosity, all depend critically on the morphologies and velocities of individual or arrays of growing dendrites. Recently phase-field method has been widely used to simulate the formation of solidification morphology during the dendritic growth because of its benefit of avoiding the explicit boundary tracking needed to solve the classical sharp interface model. The phase-field model is consistent with the laws of irreversible thermodynamics, and its parameters can be related to thermodynamic material properties. The first model for alloy solidification was proposed by Wheeler et al[1] widely called WBM model. The WBM model has been the most widely used in ideal solutions of binary alloys[2-6] corresponding to the simple lens-type phase diagrams. Recently, Kim et al[7] proposed a new phase-field model for binary alloys, named KKS model, which is equivalent to the WBM model, but has a different definition of the free energy density for the interfacial region[7]. Presently, the KKS model has been widely used to simulate the dendritic growth in dilute solutions of alloys[8] corresponding to the linear phase diagrams. However, most of alloys have variously non-linear phase diagrams, and their solidification characters depend on them much. So, it is necessary to construct the phase-field model for simulating dendritic growth of a special alloy, which is associated with its phase diagram closely.
In this paper, dendritic growth was simulated for Ti-Al alloy with complicated solution model named quasi-sub regular solution[9] using the phase-field method, and the liquid-solid transition of L���� was chosen. A phase-field model was adopted, of which free energy densities of solid and liquid were derived from a Calphad thermodynamic modeling of the phase diagram, based on comprehensive consideration of WBM model and KKS model similar in Ref.[10]. Isothermal dendritic growth was firstly studied in melts with different initial solute compositions and temperatures, both of which affected the driving force of isothermal phase transition. Then effects of latent heat release on non-isothermal dendritic growth were investigated.
2 PHASE-FIELD MODEL
The basic derivation of the phase-field model can be found in Ref.[10]. The main equations of this model can be written as
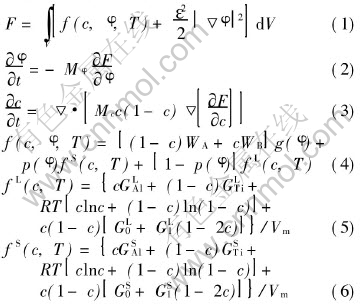
where F is the Gibbs free energy for a solidification system, V is the volume of the system, f(c, ��, T) is the free energy density, c is the solute composition, �� is the phase field, T is the temperature, �� is the gradient energy coefficient, M��, Mc, MA and MB are phase-field parameters shown below, g(��)=��2(1-��)2 and p(��)=��3(10-15��+6��2) are chosen, here ��=0 represents liquid and ��=1 represents solid, G LAl, G LTi, G SAl, G STi, G S0, G S1, GS0 and G S1 are thermodynamic data of Ti-Al alloy, and Vm is the molar volume. Eqns.(5) and (6) were derived from the Calphad thermodynamic modeling of phase diagram in Ref.[10] and can be used to yield the liquidus and solidus lines in phase diagram of Ti-Al alloy by the common tangent construction shown in Fig.1 as in another paper[11] of ours.
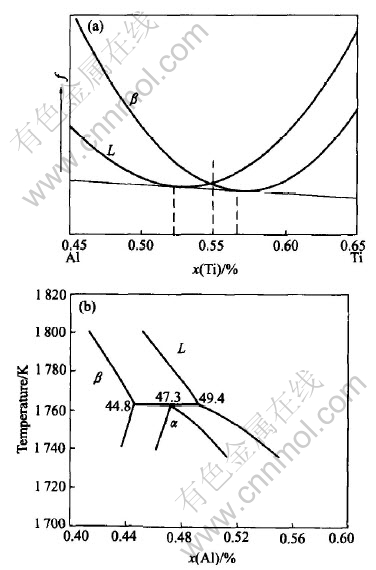
Fig.1 Curves of free energy densities of solid and liquid for Ti-Al alloy at fixed temperature and their common tangent line(a) and part of phase diagram of Ti-Al alloy(b)
The phase-field mobility and diffusion mobility are given according to Ref.[10] as
M��=(1-c)MA��+cMB��
and
![]()
The asymptotic analysis can deduce the relationships between the phase-field parameters and thermodynamic data, written as
![]() ,
,
and similar expressions can be obtained for WB and MB��.
3 NUMERCIAL ISSUE
The phase-field equations were solved by finite difference method. The time derivatives were descretized by a first order finite difference approximation and the space derivatives by a second order finite difference approximation in a uniform grid system. In order to guarantee the numerical stability, the uniform space step ��x should be lower than interface thickness ��. In present phase-field formulation, the interface thickness was treated as an input parameter and ��=(3-4.5)��x could be taken. And the time step should satisfy ��t��[SX(]��x2[]5DL[SX)]. A square computational domain of 1000��x��1000��x was used in the present simulations and the uniform space step ��x was fixed as a constant of 3��10-6cm. Initially the whole computational region was filled with uniform supersaturated melt, i.e. c=c0. The phase field was set to be liquid everywhere, except for a small nucleation region seeded at the origin. The solidification proceeds from the nucleation region. Neumann boundary conditions for phase field and composition field were imposed.
The introductions of anisotropy and stochastic noise were two important matters to derive the realistic dendritic morphology. Normally anisotropy of interface was introduced by putting the gradient energy coefficient �� as follows:
![]()
where �� is the strength of anisotropy, k is the mode number of anisotropy, and  . Stochastic noise could be introduced through
![]()
where �� is the noise intensity and [AK�ء�D] is the random number ranging from -1 to 1.
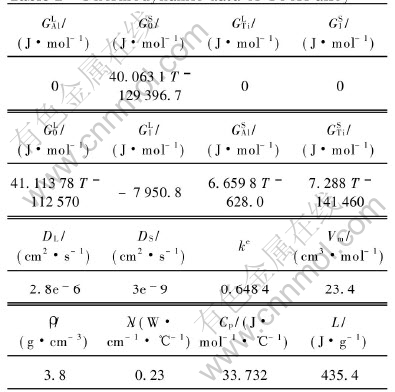
The thermophysical data of Ti-Al alloy are shown in Table 1. Other parameters were taken as follows: LTi=1892J/cm3, LAl=1064.6J/cm3, TTiM=1933K, ��*Ti=3.45��10-5J/cm2, ��*Al=1.902��10-5J/cm2, ��*Ti=0.387cm/sK, ��*Al=0.441cm/sK, ��=0.04, k=4, ��=0.4(The parameters with ��*�� are estimated like in Ref.[1]).
Table 1 Thermodynamic data of Ti-Al alloy[9, 12]
4 RESULTS AND DISCUSSION
4.1 Isothermal dendritic growth
The simulation was firstly conducted in an isothermal regime, and different initial compositions of 45%Al and 43%Al(mole fraction) and same initial melt temperature of 1780K were chosen. Fig.2 shows a sequence of four different time slices obtained from a simulation with an initial composition of 45%Al(mole fraction). The composition field is shown. Solute segregation and realistic growth patterns of dendrite are derived. The spine of the primary talk with a low composition and build-up of solute in the liquid ahead of the solid-liquid interface can be seen clearly. The tip-tip competition growth and coalescence between adjacent arms can be observed. The necked root of side arm is also seen. The final length of primary arms in Fig.2 after a solidification time of 4.11ms is about 28.8��m. Fig.3 shows the simulation results at four different time slices when the initial composition is 43%Al(mole fraction). A more developed and finer structure of isothermal dendrite than Fig.2 is derived. This difference is because the reduction of initial Al composition will increase the solute supersaturation[13] which is the driving force of isothermal phase transition, then increase the growth speed of isothermal dendrite. The final length of primary arms after a solidification time of 3.75��m in Fig.3 is about 29.18��m. Then the simulation with an initial composition of 45%Al(mole fraction) and melt temperature of 1765K is conducted. An extremely developed and fine structure of dendrite is derived from this simulation shown in Fig.4, which is because reducing of initial melt temperature will increase the degree of undercooling and spur the fast growth of crystal. The final length of primary arms after a solidification time in Fig.4 is about 29.51��m.
4.2 Non-isothermal dendritic growth
The effect of latent heat released during solidification on dendritic structures was neglected in many previous studies until recently Loginova et al[5] studied the latent heat��s effect on dendritic growth of Ni-Cu alloy by coupling the thermal transport equation considering the release of latent heat into phase-field equations. Herein, a similar way was applied. Since the thermal diffusivity of the alloy is usually hundred times larger than the solute diffusivity, the mesh size for thermal calculation is taken to be 10 times larger than that for phase-field calculation here like in Ref.[8]. The latent heat generation in a thermal calculation element was calculated from the change in the total phase-field values inside a thermal element. Then the thermal transport equation can be written as
![]()
where �� is density, �� is thermal conductivity, Cp is specific heat and L is latent heat of fusion and A represents the area ratio of phase-field grid to the thermal one.
Fig.5 shows the sequence of four different time slices from the simulation with an initial composition of 43%Al(mole fraction) and melt temperature 1780K considering the release of latent heat. Compared with Fig.3, Fig.5 shows several differences: less length of primary arms, the less developed structure of non-isothermal dendrite and the larger spacing of interdendritic liquid pockets. The final length of primary arm after a solidification time of 3.75ms is about 20.1��m.
Fig.6 shows the temperature field corresponding to the upper part of final solute distribution in Fig.5. This figure is generated by a color strengthening software to distinguish the color in a small range of RGB value. The tips are the coldest parts of the dendrite due to the large curvature here. The maximum of the temperature during the crystal growth varies with space and time. The
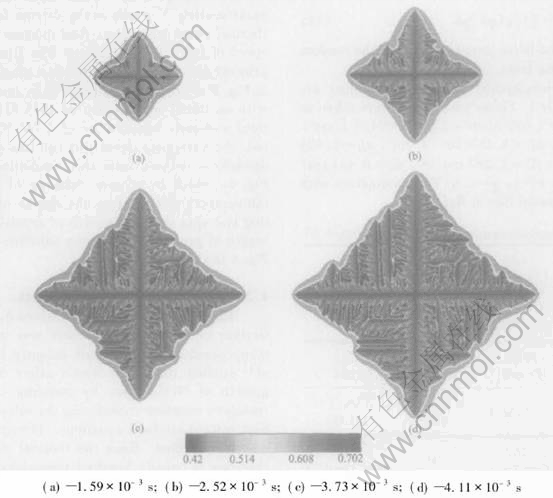
Fig.2 Sequence of four times slices shown by composition field for isothermal growth with initial composition of 45%Al(mole fraction) at melt temperature of 1780K
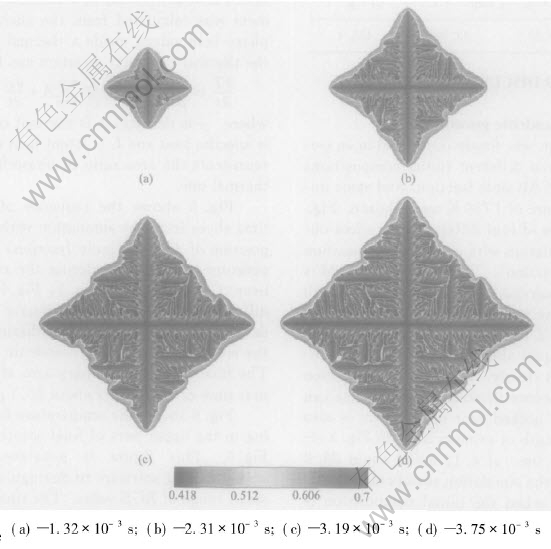
Fig.3 Sequence of four times slices shown by composition field for isothermal growth with initial composition of 43%Al(mole fraction) at melt temperature of 1780K
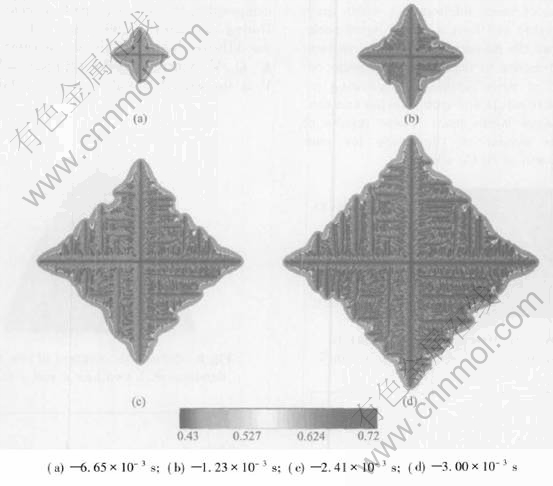
Fig.4 Sequence of four times slices shown by composition field for isothermal growth with initial composition of 45%Al(mole fraction) at melt temperature of 1765K
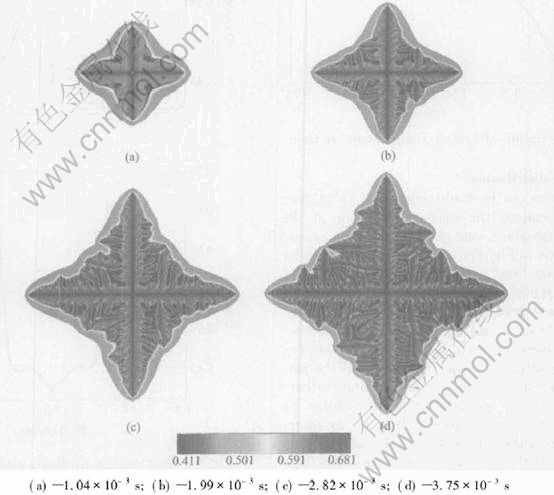
Fig.5 Sequence of four times slices shown by composition field for non-isothermal growth with initial composition of 43%Al(mole fraction) at melt temperature of 1780K
location of the hottest point generally appears near one of the tips of those sidebranches which grow towards each other and form a closed liquid pocket. Fig.7 shows the maximum of the system temperature as a function of time. The local peaks occur when two or more sidebranches growing towards each other merge and stop growing and consequently produce latent heat. These results of simulation are similar to the study for non-isothermal growth of Ni-Cu alloy[5].
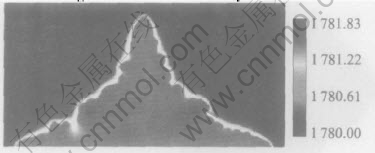
Fig.6 Temperature field corresponding to upper part of final solute distribution in Fig.5
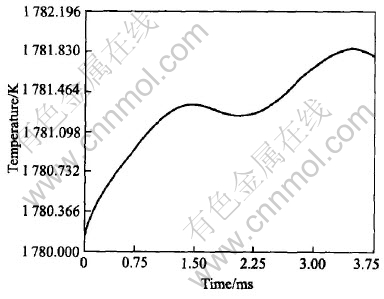
Fig.7 Maximum of system temperature vs time
4.3 Solute distribution
Two lines can be made through a tip of dendrite to investigate the solute distribution at the solid-liquid interface: one goes through the primary arm(y axis in Fig.8), the other is perpendicular to the primary arm(x axis in Fig.8). Figs.9-12 show the composition profiles along these two lines under different conditions of growth. From the figures marked (a) in Figs.9-12, the spatial fluctuations of the composition in the solid can be seen because of the effect of noise. The spine of the primary arm has a low composition. During isothermal solidification, smaller initial composition or lower initial melt temperature will make the interfacial solid composition closer to the initial composition c0 and the interfacial liquid composition farer away from the value of c0/ke. In addition, the release of latent heat will increase the melt temperature and make the operating point in the phase diagram move to the left[5], which will reduce the composition at the solid-liquid interface certainly. During isothermal growth, the differences of solute diffusive layer, which can be approximated as ��c-Dc/V, where Dc is the diffusion coefficient and V is the growth speed, can be attributed to the
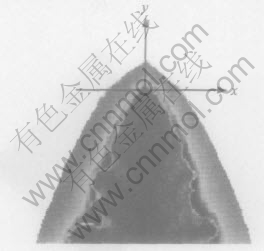
Fig.8 Schematic diagram of one tip of dendrite with two line x and y across
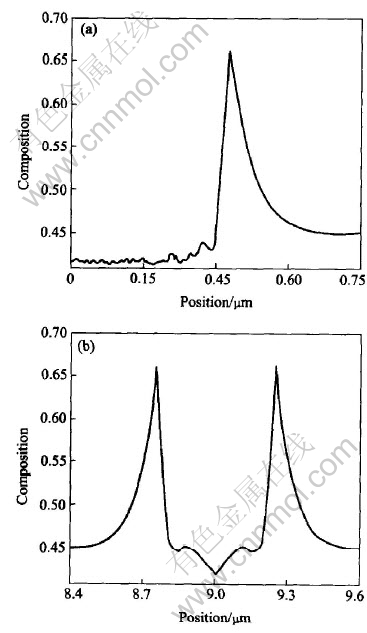
Fig.9 Composition profields along line-y(a) and line-x(b) derived from isothermal growth simulation of dendrite with initial Al composition of 0.45 at melt temperature of 1780K
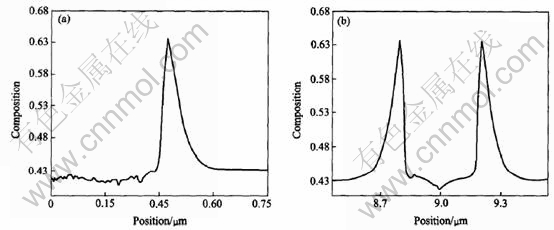
Fig.10 Composition profields along line-y(a) and line-x(b) derived from isothermal growth simulation of dendrite with initial Al composition of 0.43 at melt temperature of 1780K
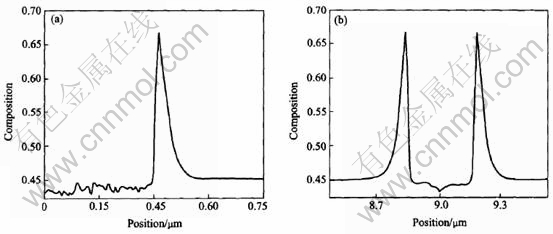
Fig.11 Composition profields along line-y(a) and line-x(b) derived from isothermal growth simulation of dendrite with initial Al composition of 0.45 at melt temperature of 1765K
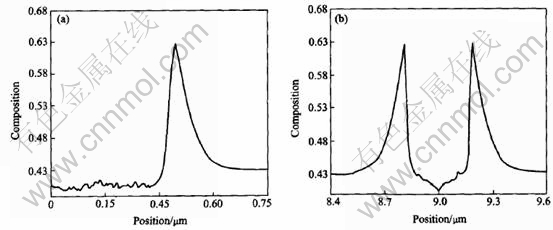
Fig.12 Composition profields along line-y(a) and line-x(b) derived from non-isothermal growth simulation of dendrite with initial Al composition of 0.43 at melt temperature of 1780K
difference of driving force of phase transition that causes the different growth speed. During non-isothermal growth, a large length of diffusive layer appears due to the thermal transport. From figures marked (b) in Figs.9-12, the solute profiles across the solids are U-shaped. Smaller initial solute composition or lower initial melt temperature will cause a smaller span in the cross direction of U-shape which means a fine structures in isothermal growth. The release of latent heat will also cause a small span relative to isothermal solidification.
5 CONCLUSIONS
1) The dendritic growths of Ti-Al alloy with a complicated solution model were simulated under different solidification conditions. The introduction of the solid and liquid free energy densities from the Calphad thermodynamic modeling of the phase diagram into the phase-field model may shed a light to a more wide simulation of various alloys.
2) During isothermal solidification, the reduction of initial solute composition will cause developed and fine structures of dendrite because of the increase of solute supersaturation; and reduction of initial melt temperature will lead to more developed and finer structures of dendrite due to the increase of degree of undercooling. During non-isothermal solidification considering the release of latent heat, the less the length of primary arms, the less developed structure of non-isothermal dendrite and the larger spacing of interdendritic liquid pockets are.
3) Solute distributions during isothermal growth show that the increase of driving force of phase transition by reducing of initial solute composition or melt temperature will make the interfacial solid composition close to the initial composition c0 and the interfacial liquid composition far away from the value of c0/ke. The release of latent heat will reduce the composition at the solid-liquid interface due to the increase of the melt temperature which makes the operating point in the phase diagram move to the left.
REFERENCES
[1]Wheeler A A, Boettinger W J, McFadden G B. Phase-field model for isothermal transition in binary alloys [J]. Phys Rev A, 1992, 45: 7424-7439.
[2]Warren J A, Boettinger W J. Prediction of dendritic growth and microsegregation patterns in a binary alloy using the phase-field method [J]. Acta Metall Mater, 1995, 43: 689-703.
[3]Wheeler A A, Boettinger W J, McFadden G B. Phase-field model of solute trapping during solidification [J]. Phys Rev E, 1993, 47: 1893-1909.
[4]Ahmad N A, Wheeler A A, Boettinger W J, et al. Solute trapping and solute drag in a phase-field model of rapid solidification [J]. Phys Rev E, 1998, 58: 3436-3450.
[5]Loginova I, Amberg G, Agren J. Phase-field simulation of non-isothermal binary alloy solidification [J]. Acta Mater, 2001, 49: 573-581.
[6]George W L, Warren J A. A parallel 3D dendritic growth simulator using the phase-field method [J]. Journal of Computational Physics, 2002, 177: 264-283.
[7]Kim S G, Kim W T, Suzuki T. Phase-field model for binary alloys [J]. Phys Rev E, 1999, 60: 7186-7197.
[8]Suzuki T, Ode M, Kim S G, et al. Phase-field model of dendritic growth [J]. J Crystal Growth, 2002, 237: 125-131.
[9]ZHANG F, CHEN S L, CHANG Y A. Thermodynamic stability and point defects of TiAl and the phase relationships of Ti-Al [J]. The Minerals Metals Materials Society, 1995. 11: 131-140.
[10]Boettinger W J, Warren J A, Beckermann C, et al. Phase field simulation of solidification [J]. Annu Rev Mater Res, 2002, 32: 163-194.
[11]SU Yan-qing, LIU Chang, LI Xin-zhong. Microstructure selection during the directionally peritectic solidification of Ti-Al binary alloy [J]. Intermeallics, 2005, 13: 267-274.
[12]LIU Yong-chang. Phase Selection and Controlling in Rapidly Solidified Ti-Al Peritectic Alloys [M]. Xi��an: Northwestern Polytechnical University, 2000.
[13]HU Han-qi. Theorem of Metal Solidification [M]. Beijing: China Machine Press, 2002.
Foundation item: Projects(50391012; 50271020) supported by the National Natural Science Foundation of China
Received date: 2004-11-24; Accepted date:2005-03-14
Correspondence: LI Xin-zhong, PhD; Tel: +86-451-86418815; E-mail: uniquelxz@hit.edu.cn
