

Evolvement of permeability of ore granular media during
heap leaching based on image analysis
YANG Bao-hua(���)1, 2, WU Ai-xiang(�Ⱞ��)3, JIANG Huai-chun(������)4, CHEN Xue-song(��ѧ��)1
1. School of Resources and Safety Engineering, Central South University, Changsha 410083, China;
2. Department of Electricity and Information Engineering, Hunan International Economics University,
Changsha 410205, China;
3. School of Civil and Environment Engineering, University of Science and Technology Beijing,
Beijing 100083, China;
4. Sino Guizhou Jinfeng Mining Limited, Guizhou 550002, China
Received 2 March 2007; accepted 17 September 2007
Abstract:
The column leaching experiment of ore granular media was carried out with the home-made multi-functional experimental apparatus and the pore structure of ore granular media was scanned by the X-ray computed tomography machine before and after leaching. The porosities of each section before and after leaching were calculated based on CT images processing, and the permeability of each zone before and after leaching were also calculated with Carman-Kozeny equation. The permeability evolvement law was disclosed. The results indicate that before leaching the permeability of the ore granular media in different height has not much difference and the value ranges from 5.70��10-4 mm2 to 1.11��10-3 mm2, where the lowest one locates in the bottom zone. After leaching the permeability distributes inhomogeneously along the height of the column and the value ranges from 3.44��10-4 mm2 to 2.25��10-2 mm2, where the lowest one is in the same place. Except for the bottom zone, the permeability of other zones increases after leaching, especially the top zone. Through comparison of the permeability at bottom zone before and after leaching, the whole permeability after leaching decreases by 39.65% that coincides with the measured experimental data.
Key words:
ore granular media; heap leaching; permeability; CT; image analysis;
1 Introduction
Solution mining technology has been studied and applied widely in China, particularly heap leaching, which has become an effective and economical method of treating poor ore, tailings and waste ore for metals, such as uranium, copper, gold and silver. The ore granular media used for heap leaching are the porous media packed by ore particles with different sizes, whose permeability is one of the critical parameters influencing the recovery ratio and leaching rate of valuable metals. Generally, the permeability is weighed by the seepage coefficient, which is obtained by Darcy��s law based on laboratory experiment presently, but it is one whole parameter. However, during leaching process, there happen physical, chemical and biologic reactions in ore granular media under the role of solution and occur natural subsidence, dissolution, deposition and solute transfer as a result. So the pore structure continues to evolve and has temporal and spatial variability. The permeability has close relationship with pore structure of ore granular media, therefore it also evolves continuously. For the in-situ leaching heaps, recovery ratio and leaching rate decrease year after year. The main reason is the permeability evolvement. Therefore, in order to understand deeply the seepage flow of solution in ore granular media during leaching and to provide true and reliable physical parameters for the relevant computer numerical simulation, it is necessary to disclose the spatial property and evolvement rule of the permeability firstly. However, the traditional experimental method cannot realize it. The computed tomography(CT) technology with the advantage of exploring the inner structure of research object without any damage has been applied widely in many scientific fields. One of the important fields is the pore structure analysis of some porous media[1-11], such as soil, oil reservoir and rock. Meanwhile, some researchers have conducted some pore structure analysis of ore granular media[12]. But there is little report about the research results of the spatial property and evolvement law of the permeability of ore granular media during heap leaching combined with CT technology and image analysis, which are the focuses of this paper. The combined method will have great development prospect in the study of seepage flow in ore granular media.
2 Experimental
2.1 Materials
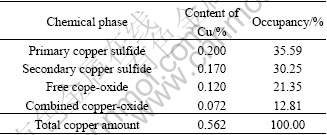
The ore sample used for the experiment was the mixed ores provided by Dexing Copper Mine in Jiangxi Province, China. The chemical phases of Cu in the ore sample are shown in Table 1 and the chemical compositions of the ore sample are shown in Table 2. In the mixed ores, copper oxide ore occupies 34.16%, secondary copper sulfide ore occupies 30.25% and primary copper sulfide ore occupies 35.59%.
Table 1 Chemical phases of Cu in ore sample (mass fraction, %)
2.2 Principle of leaching reactions
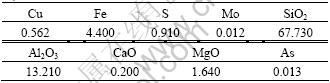
Table 2 indicates that the insoluble quartz in the mixed ore is the main part. The alkali oxide compounds (Al2O3+CaO+MgO) occupy the secondary position and the occupancy rate is 15.05%. Since the proportion of CaO is small, chemical deposits would not form once the pH value is about 2 through adjustment, therefore acid leaching can be used. The content of sulfur is 0.91%, which will produce lots of sulfuric acid during leaching, thus in the entire process the acid consumption will not be very high. Mo and As are trace elements, so their influences on leaching are small. Experiments proved that copper oxide ore can be leached almost with diluted acid. The main chemical equations are as follows:
CuCO3Cu(OH)2+2H2SO4=2CuSO4+CO2+3H2O (1)
2CuCO3?Cu(OH)2+3H2SO4=3CuSO4+2CO2+4H2O (2)
Cu2O+H2SO4=CuSO4+H2O+Cu (3)
Table 2 Chemical composition of ore sample (mass fraction, %)
2.3 Experimental apparatus
The home-made multifunctional experimental apparatus was used for the whole experiment that can conduct seepage flow experiment and column leaching experiment of the ore granular media simultaneously, which is shown in Fig.1. The height of leaching column is 500 mm and its inner diameter is 50 mm. The CT machine used for scanning pore structure of ore granular media is spiral with type of SOMATOM Sensation 16, as shown in Fig.2. It combines multi-section images collecting technology, reconstruction technology and high speed of rotating as well. The images of 32 sections can be collected per second and can be displayed with resolution of 0.5 mm, so it can meet the requirement of images collection in the experiment.
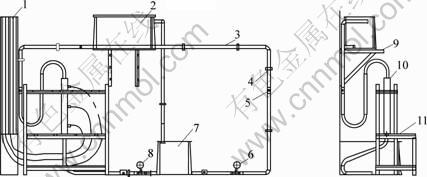
Fig.1 Multifunctional column leaching experimental apparatus: 1 Piezometer tube; 2 Upstream water tank; 3 Plastic pipeline; 4 Clip; 5 Valve; 6 Chemical pump; 7 Downstream tank; 8 Flowmeter; 9 Triangle support; 10 Leaching column; 11 Work gantry

Fig.2 X-ray computed tomography machine used in experiment
2.4 Experimental procedure
The mixed ores with various sizes were packed in the leaching column firstly. Fig.3 shows the size distribution of the ore particles. In order to avoid wall effect, the largest size is about 10 mm that is one fifth of the inner diameter of the column. Before leaching, the column was scanned once by CT machine with parameters of 120 kV and 300 mA and the scan interval was set at 0.75 mm/scan. Then acid leaching experiment was carried out and seepage coefficient was measured everyday meanwhile. During leaching the pH value always maintained about 2.0 by adjustment and the solution application rate was 600 L/(m2?h). After leaching for 28 d, the column was scanned by CT machine again with the same parameters.
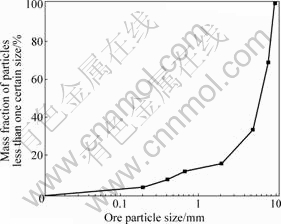
Fig.3 Size distribution of ore particles used in column leaching
3 Results and Discussion
3.1 Calculation model of seepage coefficient
For porous media, there is intrinsic relationship between its permeability and pore structure. There are many models for calculating seepage coefficient based on the pore geometry characteristics[13-15], of which the most popular one is the following Carman-Kozeny equation[16]:
 (1)
(1)
where K is the seepage coefficient, c is the Kozeny constant, and �� is the porosity; Ss is the specific surface of the grains and Sc is the specific circumference of the grains. �� and Sc are determined from image analysis.
The Kozeny constant c can be calculated from porosity using the following model:
![]() (2)
(2)
However, for the ore granular media in the heap leaching, the following simplified Carman-Kozeny equation would be more suitable and convenient[17]:
![]() (3)
(3)
where dp is the diameter of ore particles. This relationship applies for a bed consisting of uniform size particles. However, it may be used for a bed consisting of non-uniform particles when the particle diameter is replaced by the effective diameter. Generally, d10 is selected as the effective diameter for a bed consisting of non-uniform particles. It can be seen from Eqn.(3) that in order to calculate seepage coefficient it is necessary to determine the porosity and ore particles size distribution of the ore granular media firstly.
3.2 Porosity distribution before and after leaching
The porosity of ore granular media is defined as the percentage of the volume of pores among ore particles to the total volume. In order to know clearly the porosities of ore granular media along the height of the column, it is necessary to preprocess the obtained original CT images. The preprocessing procedure is shown in Fig.4. The steps are as follows: 1) cut the two-dimensional image with same size so as to select one certain rectangle zone for analysis; 2) transform the grey image to binary particle image with same threshold value; and 3) invert the particle image to binary pore image. It can be seen from Fig.4(d) that porosity is the percentage of pore area to the whole image area. Namely, it is the percentage of pixel number of white area to the total pixel number of the whole image. Once the porosities of all sections were calculated, the curves of porosity before and after leaching along the height of the column and the relevant varying trendlines after linear fitting can be obtained, as shown in Fig.5. Fig.5 indicates that the porosity before leaching has spatial variability, distributing inhomogeneously from top to bottom. The porosities of some local areas increase or decrease suddenly, but the porosity assumes slight decreasing trend totally. Its average porosity is 47.27% by calculation. After leaching, the porosity distributes inhomogeneously also. It assumes obvious decreasing trend from top to bottom, especially the porosities of local areas in bottom zone. The average porosity is 45.56% by calculation, which is decreased by 1.71% over before leaching. The spatial variability of the porosity inevitably leads the permeability to vary along the height of the leaching column, so the following study is focused on the permeability variability.
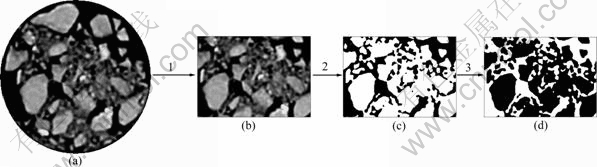
Fig.4 Preprocessing procedure of CT images: (a) Original CT images; (b) Grey image of selected zone; (c) Binary particle image (pore is black); (d) Binary pore image (pore is white)
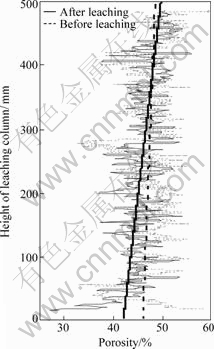
Fig.5 Comparison of porosities before and after column leaching
3.3 Permeability distribution before and after leach- ing
In order to study the spatial distribution property of the permeability, it is necessary to calculate the seepage coefficients of different zones along the height of the column. Therefore, the column from height of 15 mm to 485 mm was separated to nine small zones for analysis. Based on the above data, the average porosities of these nine zones were calculated, which are shown in Fig.6. Then, the other important parameter needed to be calculated is the effective diameter of each zone. Before leaching, the particle size distribution of each zone in leaching column was almost the same. From Fig.3 the effective diameter d10 can be determined as 0.6 mm. However, after leaching, under the coupled action of multi-factors, such as hydraulic power, gravity and chemical reactions, partial fine particles flowed downwards through the pore space among coarse particles and deposited at local areas and an extremely small amount of fine particles were transported out of the column by the solution, thus the ore particles size would have been redistributed. So in order to calculate the seep- age coefficients of the nine zones exactly, their effective diameter d10 needs to be obtained. After the experiment, the ore particles of the nine zones were taken out separately and screened. Thus their grading curves of ore particles were obtained and each effective diameter was determined. According to Eqn.(3), the seepage coefficients of ore granular media at different height of the column before and after leaching were calculated in the end. The results are shown in Fig.7.
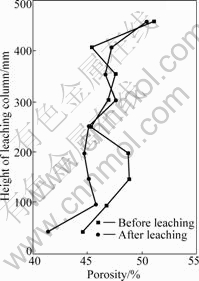
Fig.6 Porosities of separated nine zones before and after leaching
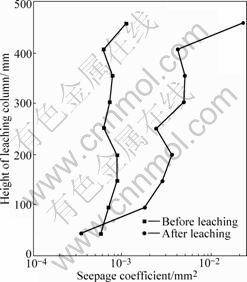
Fig.7 Comparison of seepage coefficients before and after leaching
Fig.7 indicates that the seepage coefficient of ore granular media during leaching has evolved spatially and temporally. Before leaching, the seepage coefficient of each zone has little difference, which ranges from 5.70��10-4 mm2 to 1.11��10-3 mm2. The lowest one locates at bottom zone. After leaching, the seepage coefficient distributes inhomogeneously that ranges from 3.44��10-4 mm2 to 2.25��10-2 mm2, where the seepage coefficient of top zone differs from that of bottom zone by about two orders. Except that the seepage coefficient of bottom zone decreases, the seepage coefficients of other eight zones all increase over before leaching, especially the top zone. For the leaching column, the zone with lowest seepage coefficient will act as a bottleneck that limits the seepage velocity of solution directly and cause the total permeability decrease as a result. In fact, this lowest seepage coefficient represents the total seepage coefficient, so the whole permeability cannot be improved even if the other zones have large seepage coefficients. By comparing the lowest seepage coefficients of the nine zones before and after leaching, it can be obtained that the whole permeability after leaching decreases by 39.65% over before leaching, which coincides with the measured experimental data.
3.4 Permeability evolvement principles
According the above analysis, we can know that permeability deterioration is mainly caused by the reduction of seepage coefficient of bottom zone. During the experiment, pH values keep about 2.0 all along and there are little chemical deposits, so the reduction of seepage coefficient of bottom zone after leaching is mainly due to the synthetical influence of the following two factors. The first is the integral subsiding of ore granular media in the column under the actions of gravity and hydraulic power. As a result, the compactness of the media increases, which causes the porosity decrease gradually, especially at the bottom zone. The second is the fine particles located at middle and top zone move downwards through the pore space among coarse particles under the role of hydraulic power. Some of them accumulate at narrow pore necks and the others flow downwards with solution and deposit at bottom in the end, forming particles dense area. Here the fine particles include both the original ones and those produced newly. Since the surface of ore particles and their inner micro pores or cracks are damaged after reacting with sulfuric acid, some fine particles would be produced. After reconstructing the original CT images of ore granular media, as shown in Fig.8, it can be seen clearly that bottom zone has more fine particles than middle and top zones. Fig.8(a) indicates that the lower part of the column is compacter than the upper part, particularly the bottom. Fig.8(b) also indicates that the content of fine particles at top zone is lower, at middle zone it has little increment while at bottom zone it has obvious increment.
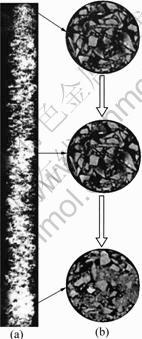
Fig.8 Pore structure of ore granular media after leaching:(a) Three-dimensional constructed ore granular media in leaching column; (b) Cross sections of ore granular media in upper, middle and lower zones
The fine particles moving to the bottom not only cause the porosity here to decrease further but also cause the effective diameter to reduce. According to Carman-Kozeny equation, effective diameter has greater effect on seepage coefficient than porosity, viz, the increase of fine particle would lead permeability to worsen rapidly. Thus, although the porosities of most zones decrease after leaching, their permeability is improved since the content of fine particles reduces. Only at the bottom zone the porosity and effective diameter decrease together, as a result the seepage coefficient drops and the total permeability is deteriorated greatly.
4 Conclusions
1) It is innovative that combining CT and image processing technologies together to analyze the spatial distribution of seepage coefficient of ore granular media and the evolvement principles of its permeability during heap leaching. This method has a bright future in the study of seepage flow of ore granular media during heap leaching.
2) The permeability of ore granular media during leaching evolves continuously. Before leaching the seepage coefficients of the ore granular media in different height have not much difference and the lowest one locates at the bottom zone. After leaching the permeability distributes inhomogeneously along the height of the column, and the seepage coefficient of top zone differs from that of bottom zone by about two orders. Except for the bottom zone, the seepage coefficients of other zones increase after leaching, especially the top zone, but the seepage coefficient of bottom zone decreases greatly by 39.65%.
3) The total permeability deterioration during leaching is mainly due to the decrease of seepage coefficient of bottom zone. Since the ore particles subside under the actions of multifactor, such as hydraulic power, gravity and chemical reactions, and some fine particles move downwards with leaching solution and deposit at bottom zone, its porosity and effective diameter decrease simultaneously, which causes the seepage coefficient to decrease in the end.
References
[1] WILDENSCHILD D, HOPMANS J W, VAZ C M P, RIVERS M L, RIKARD D, CHRISTENSEN B S B. Using X-ray computed tomography in hydrology: Systems, resolutions, and limitations [J]. Journal of Hydrology, 2002, 267(9): 285-297.
[2] KETCHAM R A, CARLSON W D. Acquisition, optimization and interpretation of X-ray computed tomographic imagery: Applications to the geosciences [J]. Computers & Geosciences, 2001, 27(3): 381-400.
[3] MECKE K, ARNS C H. Fluids in porous media: A morphometric approach [J]. Journal of Physics: Condensed Matter, 2005, 17(2): 503-534.
[4] KAMATH J, XU B, LEE S H, YORTSOS Y C. Use of pore network models to interpret laboratory experiments on vugular rocks [J]. Journal of Petroleum Science and Engineering, 1998, 20(6): 109-115.
[5] NAKASHIMA Y, NAKANO T, NAKAMURA K, UESUGI K, TSUCHIYAMA A, IKEDA S. Three-dimensional diffusion of non-sorbing species in porous sandstone: Computer simulation based on X-ray microtomography using synchrotron radiation [J]. Journal of Contaminant Hydrology, 2004, 74(3): 253-264.
[6] AL-RAOUSH R I, WILLSON C S. Extraction of physically realistic pore network properties from three-dimensional synchrotron X-ray microtomography images of unconsolidated porous media systems [J]. Journal of Hydrology, 2005, 300(5): 44-64.
[7] FARBER L, TARDOS G, MICHAELS N J. Use of X-ray tomography to study the porosity and morphology of granules [J]. Powder Technology, 2003, 132(3): 57-63.
[8] HIRONO T, TAKAHASHI M, NAKASHIMA S. In situ visualization of fluid flow image within deformed rock by X-ray CT [J]. Engineering Geology, 2003, 70(7): 37-46.
[9] LIU J S, POLAK A, ELSWORTH D, GRADER A. Dissolution-induced preferential flow in a limestone fracture [J]. Journal of Contaminant Hydrology, 2005, 78(3): 53-70.
[10] KARACAN C O, HALLECK P M. Comparison of shaped-charge perforating induced formation damage to gas- and liquid-saturated sandstone samples [J]. Journal of Petroleum Science and Engineering, 2003, 40(6): 61-75.
[11] PIERRET A, CAPOWIEZ Y, BELZUNCES L, MORAN C J. 3D reconstruction and quantification of macropores using X-ray computed tomography and image analysis [J]. Geoderma, 2002, 106(6): 247-271.
[12] LIN C L, MILLER J D, GARCIA C. Saturated flow characteristics in column leaching as described by LB simulation [J]. Minerals Engineering, 2005, 18(3): 1045-1051.
[13] SINGH M, MOHANTY K K. Permeability of spatially correlated porous media [J]. Chemical Engineering Science, 2000, 55(3): 5393-5403.
[14] STEWART M L, WARD A L, RECTOR D R. A study of pore geometry effects on anisotropy in hydraulic permeability using the lattice-Boltzmann method [J]. Advances in Water Resources, 2006, 29: 1328-1340.
[15] RAMASWAMY S, GUPTA M, GOEL A, AALTOSALMI U, KATAJA M, KOPONEN A, RAMARAO B V. The 3D structure of fabric and its relationship to liquid and vapor transport [J]. Colloids and Surfaces A: Physicochem Eng Aspects, 2004, 241: 323-333.
[16] SOLYMAR M, FABRICIUS I L. Image analysis and estimation of porosity and permeability of arnager greensand, upper cretaceous, Denmark [J]. Phys Chem Earth A, 1999, 24(7): 587-591.
[17] SHEIKHZADEH G A, MEHRABIAN M A, MANSOURI S H, SARRAFI A. Computational modelling of unsaturated flow of liquid in heap leaching��using the results of column tests to calibrate the model [J]. International Journal of Heat and Mass Transfer, 2005, 48: 279-292.
Foundation item: Project(2004CB619205) supported by the National Basic Research Program of China; Project(50325415) supported by the National Science Fund for Distinguished Young Scholars; Project(50574099) supported by the National Natural Science Foundation of China; Project (06B052) supported by Scientific Research Foundation of Hunan Provincial Education Department, China
Corresponding author: YANG Bao-hua; Tel: +86-731-8830851; E-mail: yangbaohuar2004@126.com
