

Fracture strength of centre surface cracked tensile specimens made of
2219-T87 Al alloy welding
S. RAJAKUMAR1, T. CHRISTOPHER2
1. Thanthai Periyar Government Institute of Technology, Vellore-632002, India;
2. Government College of Engineering, Perumalpuram, Tirunelveli-627007, India
Received 21 March 2011; accepted 8 June 2011
Abstract:
Fracture data of both parent metal and weldment metals from surface cracked tensile plates made of 2219-T87 Al alloy at cryogenic temperatures were correlated using a modified inherent flaw model. Fracture parameters to generate the failure assessment diagram were determined for the material. Fracture analysis was carried out considering the ultimate tensile strength value and the fracture data of aluminium base metal and weldment metal generated from center�Csurface cracked tensile specimens having different thicknesses. The failure assessment diagram of a material generated from tensile fracture plate configuration can be applied to failure pressure estimation of any cracked component, made of the same material.
Key words:
centre through crack; tensile specimen; failure assessment diagram; fracture strength; inherent flaw model; 2219-T87 Al alloy;
1 Introduction
Damage tolerant and fail-safe approaches have been employed increasingly in the design of critical engineering components. In these approaches, one has to assess the residual strength of a component with an assumed pre-existing crack. In other cases, cracks may be detected during service. Then, there is a need to evaluate the residual strength of the cracked components in order to decide whether they can be continued safely or repair and replacement are imperative. When dealing with a specific material for a particular application, it is not clearly established whether KIC (plane strain fracture toughness) or KC (fracture toughness when plane strain conditions are not met) values should be used. The values of KIC seem to be relevant in heavy sections like forgings or thick plates. Design based on KIC requires unreasonably thick panels in normally thin-sectioned structural members in aerospace industry.
In such circumstances it is necessary to carry out what is called KC tests as per ASTM-E561 standards, corresponding to the thickness of the members in the intended structural applications. The geometry dependent values of KC can be determined from the point of tangency between the crack growth resistance curve (R-curve) and the crack driving force curve of a through-cracked configuration. For part through cracked configuration, fracture strength estimations are not possible directly from the R-curve of the material because the part through crack has two dimensions, namely, crack length and its depth.
The significant parameters affecting the size of a critical crack in a structure are the applied stress levels, the fracture toughness of the material, the location of the crack and its orientations. Since the intensity of the stress at the crack tip, K, is a function of load, geometry and crack size, it is more appropriate to have a relationship between the stress intensity factor at failure (Kmax) and the failure stress (��f) from the fracture data of cracked specimens for the estimation/prediction of the fracture strength to any cracked configuration. For cracked configurations, a relation between the stress intensity factor (Kmax) and the corresponding stress (��f) at failure is suggested as [1-4]:
 (1)
(1)
where ��f is the failure stress normal to the direction of the crack in a body and ��u is the nominal stress required to produce a plastic hinge on the net section. For the pressurized cylinders, ��f is the hoop stress at the failure pressure of the flawed cylinder, and ��u is the hoop stress at the failure pressure of an unflawed cylinder. For the determination of three fracture parameters (KF, m and p), test results of simple laboratory specimens like compact tension specimens, center crack specimens etc, can be utilized. For fracture strength evaluation of any other structural configuration, the stress intensity factor corresponding to that geometry is used in Eq. (1) to develop the necessary fracture strength equation. If the values of applied stress and corresponding stress intensity factor for the specified crack size in a structure lie below the Kmax����f curve of the failure assessment diagram, the structure for that loading condition is safe.
Fracture data [5] have been obtained for 2219-T87 Al alloy useful for aircraft applications. The objective of this work is to utilize an improved inherent flaw model for tensile fracture strength evaluation of 2219-T87 Al alloy.
2 Modified inherent flaw model
The stress intensity factor for a wide tensile specimen having a centre crack is expressed as
![]() (2a)
(2a)
where �� is the applied stress and c is the half crack length. Similar to Irwin��s plastic zone correction, the assumption of the existence of an intense energy region of length aci (Fig. 1) results in the following equation for a wide centre crack tensile specimen at failure:
![]() (2b)
(2b)
were ![]() is the fracture strength of the wide tensile specimen having a centre crack of length 2c; aci is the crack-tip damage size at failure. In other words, (c+aci) is an effective half crack length. In the case of unflawed specimens, the fracture strength equals the ultimate tensile strength (��o) and Eq. (2b) becomes
is the fracture strength of the wide tensile specimen having a centre crack of length 2c; aci is the crack-tip damage size at failure. In other words, (c+aci) is an effective half crack length. In the case of unflawed specimens, the fracture strength equals the ultimate tensile strength (��o) and Eq. (2b) becomes
![]() (2c)
(2c)

Fig. 1 Characteristic length (aci) in a center-crack wide tensile panel
Thus, aci can be considered equivalent to the half crack length of an inherent flaw in the unflawed tensile specimen. Accordingly, this model is known as ��the inherent flaw model (IFM)��or ��the WEK model�� [6].
From Eqs. (2b) and (2c), one can express
 (3)
(3)
The unknown characteristic length (aci) is obtained from the test data of a finite width tensile cracked specimen. The fracture strength (![]() ) of the center crack wide tensile specimen is obtained from that of a finite width specimen (��NC) as
) of the center crack wide tensile specimen is obtained from that of a finite width specimen (��NC) as
![]() =��NCY (4)
=��NCY (4)
where the finite width correction factor [7], Y, is
![]() (5)
(5)
where W is the specimen width.
Using![]() ,
, ![]() and c, the unknown characteristic aci is found from Eq. (3) as
and c, the unknown characteristic aci is found from Eq. (3) as
 (6)
(6)
Knowing the characteristic length (aci), Eq. (3) gives the fracture strength (![]() ) for the specified crack length (2c). Fracture strength (
) for the specified crack length (2c). Fracture strength (![]() ) of the finite width plate is obtained from Eq. (4) or by dividing (
) of the finite width plate is obtained from Eq. (4) or by dividing (![]() ) with the correction factor (Y). It is well known that the fracture strength decreases with the increase in the crack size. Equation (6) indicates that the characteristic length (aci) need not be a material constant. This calls for a modification in the inherent flaw model.
) with the correction factor (Y). It is well known that the fracture strength decreases with the increase in the crack size. Equation (6) indicates that the characteristic length (aci) need not be a material constant. This calls for a modification in the inherent flaw model.
A relation between (aci) and (![]() ) in the non- dimensional form is proposed as
) in the non- dimensional form is proposed as
![]() (7)
(7)
To determine the parameters (KIFM and ![]() ) in Eq. (7), two cracked specimen tests in addition to an unflawed specimen test are required. Normally, more tests are performed to take into account of the scatter in test results. The parameters KIFM and
) in Eq. (7), two cracked specimen tests in addition to an unflawed specimen test are required. Normally, more tests are performed to take into account of the scatter in test results. The parameters KIFM and ![]() in Eq. (7) are determined by a least square curve fit to the data for aci and
in Eq. (7) are determined by a least square curve fit to the data for aci and![]() . Using Eqs. (6) and (7), one can write the following nonlinear equation for the fracture strength (
. Using Eqs. (6) and (7), one can write the following nonlinear equation for the fracture strength (![]() ) after eliminating the characteristic length (aci) as
) after eliminating the characteristic length (aci) as
 (8)
(8)
This non-linear fracture strength equation (8) is solved using the Newton�CRaphson iterative scheme to obtain (![]() ) for the specified crack size. The fracture strength
) for the specified crack size. The fracture strength ![]() versus crack size 2c curves can be generated from Eq. (8) by specifying 0<
versus crack size 2c curves can be generated from Eq. (8) by specifying 0<![]() <
<![]() useful for evaluation of
useful for evaluation of ![]() to any specific crack size. Applying the correction factor Y to
to any specific crack size. Applying the correction factor Y to![]() , the fracture strength (��NC) can be found. A relationship between
, the fracture strength (��NC) can be found. A relationship between
![]() and
and ![]() is obtained from Eq. (8) as
is obtained from Eq. (8) as
 (9)
(9)
Equation (9) represents a failure assessment diagram useful for fracture strength evaluation of different cracked configurations.
3 Equivalent through crack
The procedure proposed above is highly convenient for equivalent through cracked specimens. However, for part-through cracks (Fig. 2), the definition of inherent flaw is not straight forward. Hence, an attempt is made to evaluate equivalent through crack size for the given part-through cracked size.
To establish fracture strength of a structural component in the presence of a crack, the stress intensity factor corresponding to that cracked body is essential to setup a fracture strength equation. The stress intensity factor Kmax for centre surface crack tension (SCT) specimens from the stress intensity factor expressions obtained from finite element solutions [8-9] are
![]()
where ��f=��max for SCT specimens;

for SCT specimens;
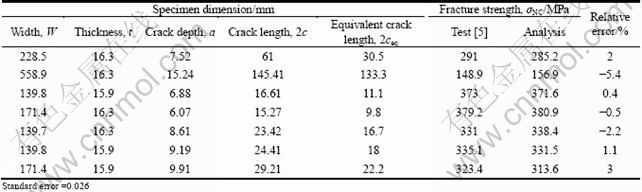
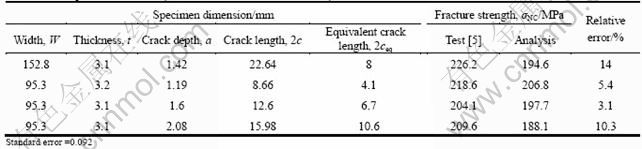
f2=1+1.464(a/c)1.65, for a f2=1+1.464(c/a)1.65, for a>c; M1=1.13-0.1(a/c), for a where a is the depth and c is half the crack length of a surface crack and w is the width of the plate. When a=t, the expression holds good for through crack. From the given test data [5], first Kmax is calculated for surface crack. Then, using the same Kmax and assuming a=t, the equivalent through crack length 2ceq can be calculated using Newton�CRaphson iterative process. The calculated 2ceq is used in IFM. A Nomogram is given to find out 2ceq from 2c. Fig. 2 Centre surface cracked plate subjected to a uniform tensile stress ��max 4 Results and discussion The fracture data [5] of 2219-T87 Al alloy useful for aircraft applications is utilized in the present study to verify the validity of the fracture criterion. The unnotched strength (��0) data in Table 1 are categorized by material and temperature. The average strength value of the multiple test results is considered in the analysis. Fracture analysis has been carried out considering the ultimate tensile strength values and the fracture data of aluminium base metal and weldment metal generated from center�Csurface crack tensile specimens having different thicknesses. From the fracture strength ( Tables 2 to 4 give the comparison of fracture strength estimations with the test results for 2219-T87 base metal at temperatures of 295, 77, and 20 K, respectively, for t=16 mm. Tables 5 to 7 give the comparison of fracture strength estimations with the test results for 2219-T87 weldment metal at temperatures 295, 77, and 20 K, respectively, for t=25 mm. Tables 8 and 9 give the comparison of fracture strength estimations with the test result for 2219-T87 weldment metal at temperature 295 and 77 K for t=3 mm. The standard error is found to be less than 0.1, which indicates that the fracture strength estimations utilizing the fracture parameters ( Table 1 Fracture parameters (KIFM and ��aci) evaluated from test results [5] of centre surface crack tension specimens made of 2219-T87Al alloy Table 2 Comparison between experimental and analytical fracture strength values for 2219-T87 base metal with ��0=477.1 MPa, t=16 mm at temperature of 295 K (KIFM=79.28 MPa��m1/2, ��aci=0) Table 3 Comparison between experimental and analytical fracture strength values for 2219-T87 base metal with ��0=592.3 MPa, t=16 mm at temperature of 77 K (KIFM=74.52 MPa��m1/2, ��aci=0) Table 4 Comparison between experimental and analytical fracture strength values for 2219-T87 base metal with ��0=646.8 MPa, t=16 mm at temperature of 20 K (KIFM=76.4 MPa��m1/2, ��aci=0) Table 5 Comparison between experimental and analytical fracture strength values for 2219-T87 weldment metal with ?��0=263.4 MPa, t=26 mm at temperature of 295 K (KIFM=140.023 MPa��m1/2, ��aci=0.934 4) Table 6 Comparison between experimental and analytical fracture strength values for 2219-T87 weldment metal with ��0= 379.2 MPa, t=26 mm at temperature of 77 K (KIFM=54.079 MPa��m1/2, ��aci=0) Table 7 Comparison between experimental and analytical fracture strength values for 2219-T87 weldment metal with ��0=433 MPa, t=25 mm at temperature of 20 K (KIFM=41.251 MPa��m1/2, ��aci=0) Table 8 Comparison between experimental and analytical fracture strength values for 2219-T87 weldment metal with ��0=263.4 MPa, t=3 mm at temperature of 295 K (KIFM=125.634 MPa��m1/2, ��aci=1.00) Table 9 Comparison between experimental and analytical fracture strength values for 2219-T87 weldment metal with ��0=379.2 MPa, t=3 mm at temperature of 77 K (KIFM=125 MPa��m1/2, ��aci= 1.00) Fig. 3 Failure assessment diagrams for 2219-T87 base metal with test data [5] (KIFM= 74.52 MPa��m1/2, ��aci=0) Fig. 4 Failure assessment diagrams for 2219-T87 base metal with test data [5] (KIFM= 79.28 M Pa��m1/2, ��aci=0) Fig. 5 Failure assessment diagrams for 2219-T87 weldment metal with test data [5] (KIFM=54.08 MPa��m1/2, ��aci =0) Fig. 6 Failure assessment diagrams for 2219-T87 weldment metal with test data [5] (KIFM=41.25 MPa��m1/2, ��aci =0) Fig. 7 Surface crack length versus equivalent through crack length Fig. 8 Comparison of fracture strength of 2219-T87 Al alloy 5 Conclusions The procedure was validated considering the fracture data of 2219-T87 Al alloy of center surface crack tension specimens. Failure assessment diagrams were generated and showed the fracture data close to the failure boundary. Fracture strength of any other cracked configurations can be evaluated from the present fracture criterion, by knowing the stress intensity equation. References [1] GOVINDAN POTTI P K, NAGESWARA RAO B, SRIVATSAVA V K. Residual strength of aluminum�Clithium alloy center surface crack tension specimens at cryogenic temperatures [J]. Cryogenics, 2000, 40: 789-795. [2] CHRISTOPHER T, SANKARANARAYANASAMY K, NAGESWARA RAO B. Fracture strength of flawed cylindrical pressure vessels under cryogenic temperatures [J]. International Journal of Cryogenics, 2002, 42: 661-673. [3] CHRISTOPHER T, SANKARANARAYANASAMY K, NAGESWARA RAO B. Fracture behavior of maraging steel tensile specimens and pressurized cylindrical vessels [J]. Fatigue, Fracture of Engineering Materials & Structures, 2004, 27: 177-186. [4] CHRISTOPHER T, SANKARANARAYANASAMY K, NAGESWARA RAO B. Failure assessment on tensile cracked specimens of aluminum alloys [J]. Trans ASME Journal of Pressure Vessels Technology, 2004, 126: 404-406. [5] SIH G C. Handbook of stress intensity factors [M]. Pennsylvania: Lehigh University, 1973. [6] WADDOUPS M E, EISENMAN J R, KAMINSKI B E. Macroscopic fracture mechanics of advanced composite materials [J]. Journal of Composite Materials, 1971, 5: 446-451. [7] MURAKAMI Y. Stress intensity factors handbook [M]. New York: Pergamon Press, 1987. [8] NEWMAN J C Jr, RAJU I S. Analysis of surface cracks under tension or bending loads [R]. NASA-TP-1578, 1979. [9] NEWMAN J C Jr. Fracture analysis of surface and through cracks in cylindrical pressure vessels [R]. NASA-TND-8325, 1976. S. RAJAKUMAR1, T. CHRISTOPHER2 1. Thanthai Periyar Government Institute of Technology, Vellore-632002, India; 2. Government College of Engineering, Perumalpuram, Tirunelveli-627007, India ժ��Ҫ����2219-T87���Ͻ��Ľ��е����������飬�øĽ��Ĺ���ȱ��ģ�ͷ������Ͻ���ĺͺ��ӽ�ͷ�����������������Ķ���ǿ�����ݣ�ͨ�����ɵ�ʧЧ����ͼ��ȷ�����ϵĶ��Ѳ�����ͨ�����Dz��ϵļ�������ǿ�ȡ������ļ����ӽ�ͷ�����Ķ���ǿ�����ݣ��Ծ��в�ͬ��ȵ����ı������������������ж��ѷ�������������Ѱ�����õ���ʧЧ����ͼ�ܹ�Ӧ�õ�����ͬ���Ϲ��ɵ��κο��������ʧЧѹ�����ơ� �ؼ��ʣ����Ĵ����ƣ�����������ʧЧ����ͼ������ǿ�ȣ�����ȱ��ģ�ͣ�2219-T87���Ͻ� (Edited by YANG Hua) Corresponding author: S. RAJAKUMAR; E-mail: s_rajakumar59@yahoo.co.in DOI: 10.1016/S1003-6326(11)61093-5 ![]() , for a>c;
, for a>c;![]() , for a
, for a ![]() , for a>c;
, for a>c;

![]() ) data of the finite width center-crack tension specimens, the fracture strength (
) data of the finite width center-crack tension specimens, the fracture strength (![]() ) for wide tensile specimens is obtained from Eq. (4). Substituting the crack length (2c), the unnotched strength (��0) and the notched strength (
) for wide tensile specimens is obtained from Eq. (4). Substituting the crack length (2c), the unnotched strength (��0) and the notched strength (![]() ) in to Eq. (6), the characteristic length (aci) is obtained. The values of aci ,
) in to Eq. (6), the characteristic length (aci) is obtained. The values of aci , ![]() and ��0 from fracture data are fitted in Eq. (7) to obtain the fracture parameters (KIFM and ��aci). Table 1 gives the determined fracture parameters (KIFM and ��aci) from the test data of aluminium alloy. One can generate fracture strength (
and ��0 from fracture data are fitted in Eq. (7) to obtain the fracture parameters (KIFM and ��aci). Table 1 gives the determined fracture parameters (KIFM and ��aci) from the test data of aluminium alloy. One can generate fracture strength (![]() ) versus the crack size (2c) curves from Eq. (8) by specifying the values of
) versus the crack size (2c) curves from Eq. (8) by specifying the values of ![]() from 0 to ��0. From this curve, one can find easily the fracture strength (
from 0 to ��0. From this curve, one can find easily the fracture strength (![]() ) for the crack size. Then, applying the finite width correction factor (Y) to
) for the crack size. Then, applying the finite width correction factor (Y) to![]() , the fracture strength (
, the fracture strength (![]() ) for the finite width plate can be estimated. In the present study, the non-linear fracture strength from Eq. (8) is solved using the Newton-Raphson iterative method.
) for the finite width plate can be estimated. In the present study, the non-linear fracture strength from Eq. (8) is solved using the Newton-Raphson iterative method.![]() and
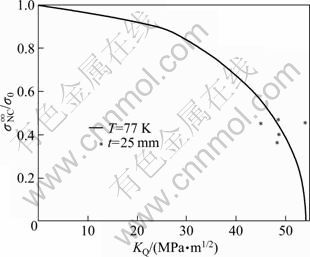
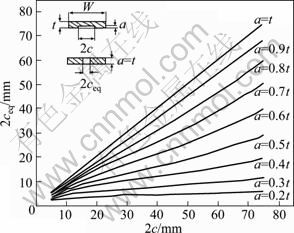
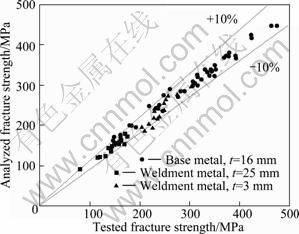
and ![]() ) can be expected within ��10% of the test results. Figures 3 and 4 show the failure assessment diagrams including the fracture data [5] of the materials for 2219-T87 base metal at temperatures 77 and 295 K, respectively, for t=16 mm. Figures 5 and 6 show the failure assessment diagrams including the fracture data [5] of the materials for aluminium 2219-T87 weld metal at 77 and 20 K, for t=25 mm. Figures 3 to 6 indicate the closeness with which the fracture data have been correlated using the modified inherent flaw model. One can use these failure assessment diagrams as a ready reference chart to verify whether the design point is in a safe region or not. If the specimen or the structure is with surface crack, a plot shown in Fig. 7 can be used to find equivalent through crack size, which may be used to find the fracture strength or design point from Figs. 3 to 6. It can be seen from Fig. 8 that most of the fracture strength estimations are within ��10% of the test results.
) can be expected within ��10% of the test results. Figures 3 and 4 show the failure assessment diagrams including the fracture data [5] of the materials for 2219-T87 base metal at temperatures 77 and 295 K, respectively, for t=16 mm. Figures 5 and 6 show the failure assessment diagrams including the fracture data [5] of the materials for aluminium 2219-T87 weld metal at 77 and 20 K, for t=25 mm. Figures 3 to 6 indicate the closeness with which the fracture data have been correlated using the modified inherent flaw model. One can use these failure assessment diagrams as a ready reference chart to verify whether the design point is in a safe region or not. If the specimen or the structure is with surface crack, a plot shown in Fig. 7 can be used to find equivalent through crack size, which may be used to find the fracture strength or design point from Figs. 3 to 6. It can be seen from Fig. 8 that most of the fracture strength estimations are within ��10% of the test results.


2219-T87���Ͻ�����ı����������������Ķ���ǿ��
Abstract: Fracture data of both parent metal and weldment metals from surface cracked tensile plates made of 2219-T87 Al alloy at cryogenic temperatures were correlated using a modified inherent flaw model. Fracture parameters to generate the failure assessment diagram were determined for the material. Fracture analysis was carried out considering the ultimate tensile strength value and the fracture data of aluminium base metal and weldment metal generated from center�Csurface cracked tensile specimens having different thicknesses. The failure assessment diagram of a material generated from tensile fracture plate configuration can be applied to failure pressure estimation of any cracked component, made of the same material.
