

Deformation and damage mechanism of aluminum alloy under different stress states
ZHU Hao(�� ��)1, ZHU Liang(�� ��)1 , CHEN Jian-hong(�½���)1, CHE Hong-yan(������)1
Key Laboratory of Non-ferrous Metal alloys,
Ministry of Education, Lanzhou University of Technology, Lanzhou 730050, China
Received 28 July 2006; accepted 15 September 2006
Abstract:
The deformation and damage mechanism of aluminum alloy (6063) were investigated by 0?, 30?, 45?, 60? and 90? tensile tests and tensile-unload tests with the modified Arcan fixture on the butterfly specimens. The results show: the curves of engineering stress-engineering strain under different stress states are obviously different. There were microvoids in the specimen when 0? direction loading was preformed. The microcracks were produced in the root of notch as the result of the microvoids shearing fracture and then they led to specimen fracture with microcracks being coalesced. With tensile angle increasing, the shear stress in the center of butterfly specimen increases gradually, while the deformation bands become more and more concentrative. In these concentrative deformation bands, the microcracks are produced and then microcracks propagation and coalescence result in specimen fracture. When 90? direction loading is preformed, the shear bands are obviously formed. The G-T-N damage model and the Johnson-cook model were used to simulate 0? tensile test and 90? tensile test respectively. The simulated engineering stress-engineering strain curves fit the measured ones very well.
Key words:
6063 aluminum alloy; damage mechanism; butterfly specimen; Arcan fixture; G-T-N model; Johnson-cook model;
1 Introduction
The increasing interest in the production of light mass vehicle to improve fuel economy has resulted in an increasing interest in utilization of aluminum alloys for automotive components. A desired quality for the vehicle is its crashworthiness [1]. During the impacting process of the automobile components, the stress state at each part is different. Moreover, the stress state changes with the passing of time. Different stress states result in different damage forms of aluminum alloys. There are a lot of reports on ductile damage and ductile fracture. The ductile fracture (based on the initiation, growth and coalescence of voids) and shear fracture (based on shear band localization) are primarily two kinds of fracture forms for the ductile materials [2-4]. EL-MAGD et al [5] have studied the deformation and damage behaviors of aluminum alloy AA7075 under two loading and found that deformation localization and shear band cause the damage in AA7075 aluminum alloy under compression loading and under tensile loading, AA7075 aluminum alloy fails due to nucleation, growth, and coalescence of microvoids. The damage forms on the 6063 aluminum alloy under crushing loading are changing with the changing of stress states. So any one-damage model can��t describe adequately the damage and deformation forms of aluminum alloy. In order to study the damage mechanism under different stress states of aluminum alloy component, the Arcan fixture has been used to produce different stress states in the center of butterfly specimen by changing the loading directions. This paper is a further study on the deformation, damage and fracture mechanism under different stress states.
2 Experimental
The experimental material is 6063 (T6) extrusion aluminum alloy and its chemical compositions are given as follows(mass fraction, %): Mg 0.45-0.9; Si 0.2-0.6; Zn, Cr, Ti and Mn<0.1; Fe<0.35. The butterfly specimen dimensions and modified Arcan fixture are shown in Fig.1. Schematic diagram of the principle for modified Arcan fixture are shown in the same Figure.
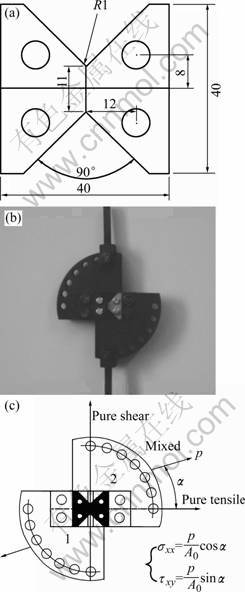
Fig.1 Butterfly specimen, Arcan fixture and schematic diagram of experimental principle: (a) Butterfly specimen; (b) Modified Arcan fixture; (c) Schematic diagram of experimental principle
2.1 Experimental results and discussion
At room temperature, the tests were performed on the butterfly specimens fixed by modified Arcan fixture and at the same time the tests were conducted by the universal test machine with a cross head speed of 0.5 mm/min. Various loading modes can be carried out by changing the loading directions. The experimental curves of different loading directions, stress triaxiality distribution calculated by FEM and the curves of fracture strain changing with stress triaxiality are shown in Fig.2. The experimental results are shown in Table 1.
Fig.2(b) shows the curves of stress triaxiality distribution (calculated by FEM) along the direction of notch roots in the center of butterfly specimens tensile tested in various directions. From the curves it can be seen that the range of stress triaxiality in the center of butterfly specimen is from 0.1 to 1 by changing different loading directions. Fig.2(a) is the engineering stress-strain curves with different loading directions, which shows that the engineering stress-strain curves are different under different loading modes: with stress triaxiality increasing, engineering stress becomes much higher, while the fracture strain becomes much less. The relationship between fracture strain and stress-triaxiality is shown in Fig.2(c), from which the following equation can be obtained:
![]() (1)
(1)

Fig.2 Curves of tests and FEM calculation: (a) Engineering Stress��engineering strain; (b) Stress triaxiality distribution; (c) Fracture strain��stress triaxiality
Table 1 Experimental data
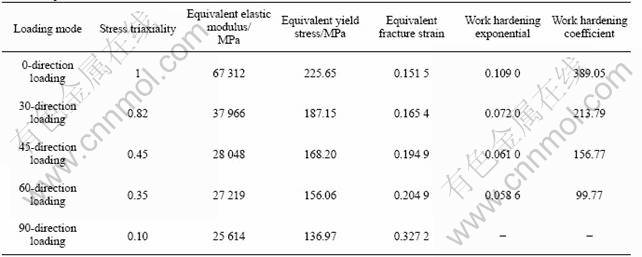
Table 1 shows the experimental data of different loading directions. As seen from Table 1, with increasing loading angle, the stress triaxiality, equivalent elastic modulus, equivalent yield stress, work hardening coefficient and work hardening exponents decrease, but equivalent fracture strain increases. All of these results from the increasing of proportion of shear stress in the center of butterfly specimen, while the increasing of proportion of shear stress results in the decreasing of stress triaxiality.
2.2 Metallographic results and discussion
In order to study the damage mechanism in the specimens, the butterfly specimens were loaded and then unloaded when the desired strain is reached. The unloaded specimens were cut in the center parallel to applied load direction and mounted and then polished on the 180-grit paper. All the polishing was done by wet polishing papers to prevent particles from extraction from the soft aluminum matrix. The etched metallographic pictures are shown in Fig.3. The fracture surfaces are shown in Fig.4.
Fig.3(a) is the metallographic picture of specimen tensile tested in 0-direction. From the picture it can be seen that there is crack near the notch. Fig.4(a) is its fracture surface. In the fracture surface, there are a lot of integrated dimples with shear surfaces between them. It is reasonable to think that the final fracture of specimen loaded-unloaded in 0-direction resulted from shear fracture between integrated dimples. Fig.3(b) is the metallographic picture of the specimen loaded and unloaded in 30-direction. It can be seen that a long crack formed at the root of the notch and the path of crack propagation shows zigzag. Pattern grains are extended, and no mircrovoids are found. Fig.4(b) is its fracture surface, which shows fewer mircrovoids than in Fig.4(a), and their volume are smaller than those shown in Fig.4(a), while the proportion of shear face increases. All of these are caused by the decrease of stress triaxiality. Fig.3(c) is metallographic picture of specimen loaded and unloaded in 45-direction. As is shown that grains have deformed greatly in the 45 direction, but no local deformation band is formed, while a microcrack of 100 ��m is caused at the boundary of the grains. Fig.4(c) is its fracture surface, which shows there are almost no dimples in the fracture surface, and most parts of the facture surface are smooth and flat, which demonstrates that the fracture mode is shear fracture. Fig.3(d) is metallographic picture of specimen loaded-unloaded in 60-direction. The picture shows that grains deform more seriously in the 60-direction. Moreover, local deformation band begins to form. In the local deformation band, several microcracks have been produced along the boundary of the grains. Fig.4(d) is its fracture surface, which shows that the fracture surface is very flat and smooth, thus it is typical shear fracture. Fig.3(e) is the metallographic picture of the specimen loaded and unloaded in 90-direction. As is illustrated that local shear deformation band is produced obviously, and a long crack is produced in it. Fig.4(e) is its fracture surface. It shows that fracture surface is very flat and smooth, and it is a typical shear fracture surface.
The above analyses show that: 1) With the increasing of loading direction, damage mode changes in sequence of microvoids mixed with microcrack�� microcrack��local shear band and microcrack. 2) The boundaries of grains become the weakest parts, and lots of microcracks are firstly produced in them, while during the propagating of microcracks, the grains boundary and the internal grains possess the same resistance. 3) With the increasing of loading direction, the propagation of cracks tends to become more and more straight.
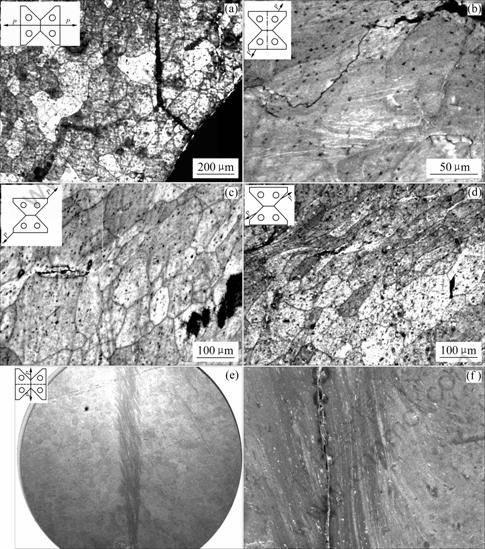
Fig.3 Metallographic pictures of specimens tensile tested in different angles: (a) 0-direction unloaded; (b) 30-direction unloaded; (c) 45-diretion unloaded; (d) 60-direction unloaded; (e) 90-direction unloaded
3 Finite element simulations
The G-T-N model [6-8] was used to give a numerical description of 0-direction tensile test. In 0-direction tensile tests, the G-T-N model flow function and their parameters are as follows:
![]() (2)
(2)
where q1=1.5; q2=1.0; q3=2.25; f0 is initial volume fraction of voids, =0.002 5; fc is volume fraction of voids at coalescence, =0.035; fF is volume fraction of voids at fracture, =0.047 5; fn is volume fraction of voids forming particles, =0.02; ��N is medium strain for voids formation, = 0.3; SN is standard deviation, =0.1. The Johnson-cook model [9-11] was used to simulate the 90-direction tensile test. Johnson-cook constitutive relation and fracture strain model are as follows.
The constitutive relation:
![]() (3)
(3)
The fracture strain model:
![]() (4)
(4)
In the Johnson-cook model: A, B, C, n, m, D1, D2, D3, D4 and D5 are materials constants. In the models, the effect of strain rate and temperature are not considered (because 6063 alloy is not sensitive to strain rate). Here, A=176.45 MPa, B=63.99 MPa, n=0.07, C=0, m=0, D1=0.074 13, D2=0.089 2, D3=-2.441, D4=D5=0. Simulated curves by FEM and experimental curves are shown in Fig.5; the images of simulated results by FEM are shown in Fig.6.
Fig.5(a) shows that the engineering stress��strain curves of simulation with the G-T-N model is close to the measured engineering stress��strain curve of specimen loaded in 0-direction with higher stress triaxiality. It is proved that the G-T-N model can be used to simulate the 0-direction tensile damage. Simulation of the engineering stress��strain curve without G-T-N damage model overestimates the stress of 0-direction tensile test. Fig.5(b) shows that the Johnson-cook model is suitable to simulate the 90-direction tensile test with lower stress triaxiality.
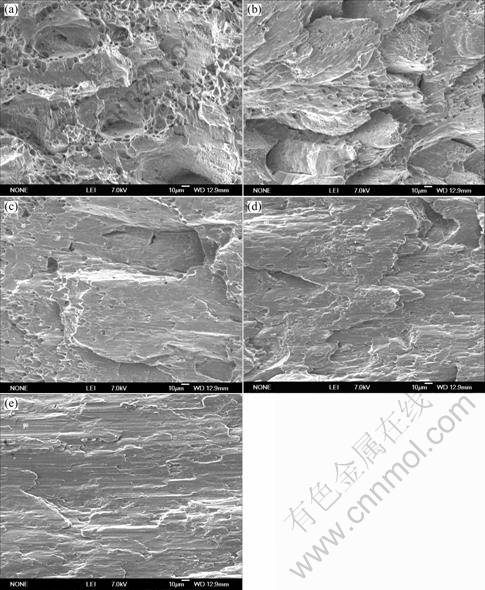
Fig.4 Fracture surfaces of specimens tested in different loading modes: (a) 0-direction loading; (b) 30-direction loading; (c) 45-
direction loading; (d) 60-direction loading; (e) 90-direction loading
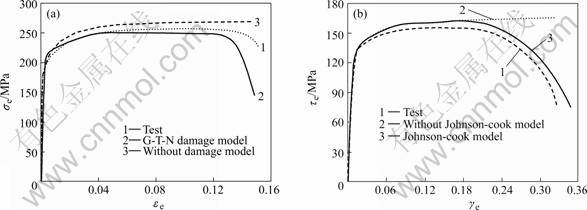
Fig.5 Simulation curves of FEM: (a) 0-direction tensile simulation; (b) 90-direction tensile simulation
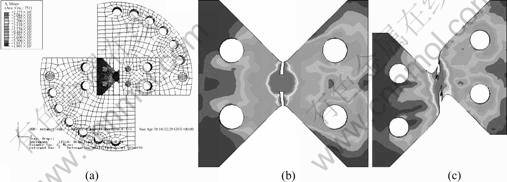
Fig.6 Simulation images of FEM: (a) Mesh of butterfly specimen and Arcan fixture; (b) G-T-N model; (c) Johnson-cook model
4 Conclusions
With stress triaxiality increasing, the fracture strain decreases and but equivalent elastic modulus, equivalent yield stress, work hardening coefficient and work hardening exponents increase. Grains deform in the loading-direction and with stress triaxiality increasing, damage mode changes, which leads to microvoids mixed with microcrack��microcrack��local shear band and microcrack in sequence. With stress triaxiality decreasing, the fracture surfaces become more and more smooth and flat from shear fracture between dimples to shear fracture. The G-T-N damage model and Johnson-cook model can be used to simulate 0-direction tensile test and 90-direction tensile test.
References
[1] PIKETT A K, PYTTEL T, PAYEN F. Failure prediction for advanced crashworthiness of transportation vehicles [J]. International Journal of Impact Engineering, 2004, 30: 853-872.
[2] TANG A M. Experimental analysis of fracture modes changing rule for aluminum alloy [J]. Journal of Xi��an University of Technology, 2003, 19(3): 226-229.
[3] HOPPERSTAD S, BORVIK T, LANGSETH M, LABIBES K, ALBERTINI C. On the influence of stress triaxiality and strain rate on the behaviors of a structural steel (Part ��): Experiments [J]. European Journal of Mechanics A/solids, 2003, 22: 1-13.
[4] HOOPUTRA H, GESE H, DELL H, WERNER H. A comprehensive failure model for crashworthiness simulation of aluminum extrusion [J]. International Journal of Crashworthiness, 2004, 9(5): 449-464.
[5] EL-MAGD E, ABOURIDOUANE M. Characterization, modeling and simulation of deformation and fracture behaviour of the light-weight wrought alloys under high strain rate loading [J]. International Journal of Impact Engineering, 2006, 32: 741-758.
[6] YU S W, FENG X Q. Damage Mechanics [M]. Beijing: Tsinghua University Press, 1997.
[7] SCHMITT W, SUN D Z, BLAUEL J G. Damage mechanics analysis (Gurson model) and experimental verification of the behaviors of a crack in a weld-cladded [J]. Nuclear Engineering and Design, 1997, 174: 237-246.
[8] AGARWAL H, GOKHALE A M, GRAHAM S, HORSTEMEYER M F. Void growth in 6061-aluminum alloy under triaxials stress state [J]. Materials Science and Engineering, 2003, A34: 35-42.
[9] BATRA R C, LEAR M H. Adiabatic shear banding in plane strain tensile deformations of thermoelastoviscoplastic materials with finite thermal wave speed [J]. International Journal of Plasticity, 2005, 21: 1521-1545.
[10] THOMAS L, WARREN, MICHAEL J. Forrestal. Effect of strain hardening and strain-rate sensitivity on the penetration of aluminum targets with spherical-nosed rods [J]. Int J Solid Structures, 1998, 35(28-29): 3737-3753.
[11] WIERZBICKI T, BAO Ying-bin, LEE Young-Woong, BAI Yuan-li. Calibration and evaluation of seven fracture models [J]. International Journal of Mechanical Sciences, 2005, 47: 719-743.
(CHEN Ai-hua)
Foundation item: Project (2004CCA04900) supported by Ministry of Science and Technology of China
Corresponding author: ZHU Hao; Tel: +86-931-2976644; E-mail: zhuhao@mail2.lut.cn
