
J. Cent. South Univ. Technol. (2008) 15(s1): 564-567
DOI: 10.1007/s11771-008-422-z
![]()
Evaluation of statistical strength of bamboo fiber and mechanical properties of fiber reinforced green composites
CAO Yong(�� ��), WU Yi-qiang(����ǿ)
(College of Materials Science and Engineering, Central South University of Forestry and Technology,
Changsha 410004, China)
Abstract:
Green composites made from bamboo fibers and biodegradable resins were fabricated with press molding. On the basis of the Weibull distribution and the weakest-link theory, the statistical strength and distribution of bamboo fiber were analyzed, and the tensile strength of green composites was also investigated. The result confirms that the tensile statistical strength of fiber fits well with two-parameter Weibull distribution. In addition, the tensile strength of bamboo fiber reinforced composites is about 330 MPa with the fiber volume fraction of 70%. This value is close to or higher than that of other natural fiber reinforced green composites.
Key words:
bamboo fiber; Weibull distribution; tensile strength; green composite��
1 Introduction
As a quite valuable resource, bamboo has supported and deeply related with our lives till now, in terms of life instruments like baskets and sieves, and architectural applications such as structural materials in wooden houses. Recently, in order to solve the ever-expanding problem of energy shortage and the increasing environmental consciousness, natural fibers have been expected and proved to be a renewable and cheaper substitute than synthetic fibers such as glass and carbon, which are conventionally used as reinforcements in making structural components. Natural fibers, such as bamboo, jute, sisal, kenaf and bagasse[1-5], have been used as reinforcement in composites owing to their low cost, acceptable specific strength and modulus, and biodegradability.
In this work, the preparation of the unidirectional green composites made from bamboo fibers and two biodegradable resins was described. Similar to most brittle natural fibers, bamboo fiber exhibits considerable variation in geometrical sizes and mechanical properties. In general, based on weakest link concept, the Weibull distribution[6-9] has become a useful tool to explain the strength variation of fibers, and widely applied to geometrically uniform fibers including glass and carbon. However, very few studies have been reported on the applicability of the Weibull model to evaluate the strength of natural fibers. In this study, the statistical strength and distribution of bamboo fiber were analyzed by Weibull model. In addition, the tensile strength of composites was investigated as well.
2 Experimental
2.1 Materials
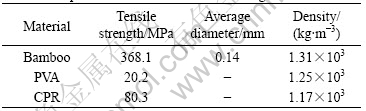
Bamboo fiber(BF) as reinforcement in composites was produced in Indonesia and had already been alkali-treated. Two kinds of biodegradable resins were used as matrix in this study. One was a powder type of biodegradable resin (PVA-217, Kuraray Co., Japan), which is a water-soluble resin and mainly composed of polyvinyl alcohol. The other was a film of cornstarch based biodegradable resin (CPR-F3A), supplied by Nippon Cornstarch Company. Hereinafter two kinds of resins were referred to as ��PVA�� and ��CPR��, respectively. Mechanical properties of the bamboo fiber and biodegradable resins are listed in Table 1.
Table 1 Properties of bamboo fiber and biodegradable resin
2.2 Fabrication of green composites
Bamboo fiber reinforced PVA and CPR composites were fabricated by press molding. As for the BF/PVA composites, fibers were dipped into the PVA solution; then a pre-forming fiber sheet, whose fibers were coated with a thin particles layer, was obtained after drying. As for the BF/CPR composites, bamboo fibers were parallel to longitudinal direction in the mould and sandwiched between two CPR films, then pressed under light pressure to obtain another type pre-forming fiber sheet. Several pre-forming sheets were laminated in the mould, and then fabricated to green composites by a hot press molding (APP-20, Yamamoto Suiatu Kogyosho Co. Ltd., Japan), under 3.3 MPa or 6.5 MPa at 150 �� for 30 min (Fig.1).
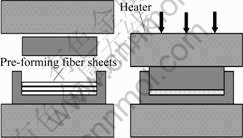
Fig.1 Schematic of preparation of composites
2.3 Tensile test of single fiber and composite
Tensile tests of single bamboo fiber were performed using a self-designed tensile tester, based on the standard method used for determination of tensile properties of the single filament carbon fiber specimens (ISO 11566). 52 specimens of single fiber were measured. As shown in Fig.2, individual fiber was mounted and glued on a paper tab before measurement. The gauge length was 10 mm and the cross-head speed was 0.8 mm/min. The cross section of fiber, assuming as a cylindrical fiber, was calculated from the diameter measured by an optical microscope (Eclipse ME600, Nikon Co., Japan).
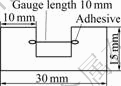
Fig.2 Shape and dimension of single fiber specimen
Tensile tests of green composite were carried out using an Autograph IS5000 (Shimadzu Co., Japan) according to the standard method (ISO 3268) applied for the tensile properties of glass fiber reinforced plastic composites. The specimen of composite was prepared as exhibited in Fig.3 and the geometry was 100 mm��10 mm��(1-2) mm. The gauge length was 50 mm and the cross-head speed was 0.5 mm/min. Three specimens

Fig.3 Shape and dimension of composite specimen
were tested and then the mean values were calculated.
3 Weibull distribution
Based on weakest-link theory[6-7], the probability of failure of bamboo fiber of length L and applied strength ��f is given by
 (1)
(1)
where F(��f) is the failure probability of fiber tensile strength less than or equal to ��f; L is the gauge length; L0 is the length of the unit link of the fiber; ��0 and �� are the Weibull shape and scale parameters, respectively.
If L0 is chosen to be unity for reasons of simplicity then Eqn.(1) becomes
 (2)
(2)
where L now is dimensionless and ��0 has stress unit.
The linear regression(LR) method was applied for estimating the parameters of the Weibull distribution. Starting from Eqn.(2) after rearrangement, the following equation is derived:
ln{-ln[1-F(��f)]}=��ln ��f+ln L-��ln ��0 (3)
Hence, if ln ��f is plotted versus ln{-ln[1-F(��f)]}, a straight line should appear, whose slope is the Weibull scale parameters, ��, and from the intercept -�� ln ��0 the Weibull shape parameters, ��0, may be obtained. The main problem of the method is how to estimate the F(��f) values in such a way that the calculated �� and ��0 values are unbiased estimators of the real values. Usually the F(��f) value is estimated by a function known as the probability index and four methods have been applied. In this study, the mean rank value method was chosen to calculate the probability index:
![]() (4)
(4)
where n is the number of data points (amount of specimen) and i is the rank of the ith data point.
Finally, the corresponding mean strength is obtained as follows:
![]() (5)
(5)
where �� represents the gamma function.
4 Results and discussion
4.1 Tensile strength distribution of bamboo fiber
The result of bamboo fiber tensile test is shown Fig.4. Fiber tensile strength slightly decreases with an increase of diameter, and a negative correlation (-0.61) is presented between the strength and the diameter. Fiber tensile strength varies from 127.05 to 905.09 MPa, the average value is 368.01 MPa, and the standard deviation and coefficient of variation are 160.44 MPa and 44%, respectively. The result indicates that the fiber strength distributes in wide range, yet conforms to certain statistical distribution. Fig.5 shows the SEM micrograph of the surface of a bamboo fiber. A rough surface is exhibited, and a large amount of impurities are attached to the surface. In addition, some small empty holes can be found visibly. This reveals the various defects occuring on the fiber surface and inside the fiber, which leads to the scattered data in fiber tensile strength.
4.2 Analysis of tensile strength distribution of bamboo fiber
Based on the result of single fiber tensile test and the calculation by Eqn.(4), Fig.6 presents Weibull plots

Fig.4 Relationship between fiber tensile strength and fiber diameter

Fig.5 SEM micrograph of surface of bamboo fiber
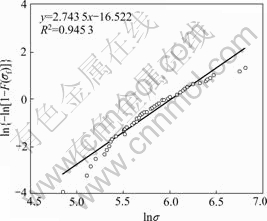
Fig.6 Weibull distribution plots of bamboo fiber tensile strength
for the tensile strength distribution of bamboo fiber. The best fit straight line in the Weibull plots, used to calculate the Weibull parameters, is also shown. According to the linear regression analysis fitting line, the relevant Weibull parameters, �� and ��0, can be calculated from the slope and intercept of straight line and the result is given in Table 2.
The goodness-of-fit test is carried out by using the Kolmogorov-Smirnov (K-S) test, which is usually used for inspecting the fitness between theoretic distribution function and sample function. The procedure is:
1) Determine the maximum deviation Dn between Fi from Fi=i/(n+1) and F(��f) from the Weibull probability (Eqn.(2)):
![]() (6)
(6)
2) The critical value Dn, �� can be obtained from K-S test table. For n��52 and a significance level of ��=0.05. That is D52,0.05.
Table 2 Weibull distribution parameters and result of K-S test

3) If Dn��Dn, ��, the null hypothesis that the observed data follow the Weibull distribution is accepted.
The result of K-S goodness-of-fit test is also listed in Table 2. Therefore, the tensile statistical strength of fiber fits well with the two-parameter Weibull distribution.
4.3 Tensile properties of green composite
Table 3 presents the average tensile properties of bamboo fiber green composites. Tensile strength and elastic modulus increase with an increase of pressure in BF/PVA composites. Meanwhile, the fiber volume fractions show a relatively high value of around 0.7. On the other hand, as for BF/CPR composites, varying the fiber volume fraction from 0.5 to 0.7, the tensile strength correspondingly changes from 270 to 300 MPa, and elastic moduli are much higher than those of BF/PVA composites. In order to further compare elastic moduli, stress would be normalized through tensile strength divided by fiber volume fraction due to the dependence between elastic modulus and fiber volume fraction. Fig.7 shows a typical stress��strain diagram of composite. As seen form Fig.7, BF/CPR composites present a larger slope as compared with BF/PVA composites. This indicates a higher stiffness in BF/CPR composites. Moreover, the normalized tensile strength of BF/CPR composites is also higher. The reason is considered that, therefore, the difference of tensile properties between both composites might be attributed primarily to the mechanical properties of different matrix resins.
Table 3 Tensile properties of bamboo fiber green composites
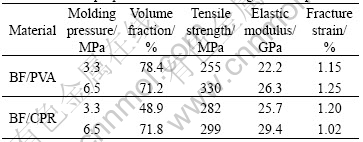
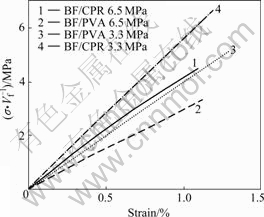
Fig.7 Typical stress��strain diagram of green composites
5 Conclusions
Green composites consisted of bamboo fibers and biodegradable resins were prepared by hot press molding. The statistics tensile strength of bamboo fiber was estimated in terms of the Weibull distribution and the weakest-link theory. Furthermore, the tensile properties of different green composites were compared. The major results obtained from this study are summarized briefly as follows:
1) Although the fiber strength distributes in wide range, the statistical strength of bamboo fiber can be analyzed by certain statistical distribution. The result of K-S goodness-of-fit test confirms the statistical tensile strength of fiber fits well with the two-parameter Weibull distribution.
2) The tensile strength of green composites varies from 250 to 330 MPa. The maximum value of 330 MPa is found at the fiber volume fraction of about 70%. This value is close to and higher than that of other natural fiber reinforced green composites.
3) The tensile properties of BF/CPR composites are superior to those of BF/PVA composites. This might be attributed primarily to the mechanical properties of different matrix resins.
References
[1] SUI G X, YU T X, KIM J K, ZHOU B L. Mechanical behaviour and failure modes of aluminium/bamboo sandwich plates under quasistatic loading [J]. J Mater Sci, 2000, 35: 1445-1452.
[2] DIEU T V, PHAI L T, NGOC P M, TUNG N H, THAO L P, QUANG L H. Study on preparation of polymer composites based on polypropylene reinforced by jute fibers [J]. JSME International Journal (Series A), 2004, 47(4): 547-550.
[3] LU X, ZHANG M Q, RONG M Z, SHI G, YANG G C. Self-reinforced melt processable composites of sisal [J]. Compos Sci Technol, 2003, 63: 177-186.
[4] SHIBATA S, CAO Y, FUKUMOTO I. Press forming of short natural fiber-reinforced biodegradable resin: Effects of fiber volume fraction and length on the flexural properties [J]. Polym Test, 2005, 24(8): 1005-1011.
[5] CAO Y, SHIBATA S, FUKUMOTO I. Mechanical properties of biodegradable composites reinforced with bagasse fiber before and after alkali treatments [J]. Composites: Part A, 2006, 37(3): 423-429.
[6] WEIBULL W. A statistical distribution function of wide applicability [J]. J Appl Mech, 1951, 3(18): 293-297.
[7] COLEMAN B D. On the strength of classical fibers and fibre bundles [J]. J Mech Phys Solid, 1958, 7: 60-70.
[8] KURKJIAN C R. Single-valued strength of perfect silica fibers [J]. Appl Phys Lett, 1983, 42: 251-253.
[9] RMILI M, BOUCHAOUR T, MERLE P. Estimation of Weibull parameters from loose-bundle tests [J]. Compos Sci Technol, 1996, 56: 831-834.
Foundation item: Project(2007BAQ0104901) supported by the 11th Five-Year-Plan National Scientific & Technological Program; Project(200704020) supported by the National Special Program on the Public Welfare Forests supported by Ministry of Science and Technology of China
Received date: 2008-06-25; Accepted date: 2008-08-05
Corresponding author: CAO Yong, Doctor; Tel: +86-731-5623302; E-mail: k018359@yahoo.co.jp
