
J. Cent. South Univ. (2016) 23: 3346-3355
DOI: 10.1007/s11771-016-3400-x

Numerical analysis on thermal regime of wide embankment in permafrost regions of Qinghai-Tibet Plateau
MA Tao(����)1, TANG Tao(����)1, HUANG Xiao-ming(������)1, WANG Hao(����)2
1. School of Transportation, Southeast University, Nanjing 210096, China;
2. Department of Civil and Environmental Engineering, Rutgers, the State University of New Jersey, NJ08854, USA
 Central South University Press and Springer-Verlag Berlin Heidelberg 2016
Abstract:
This study investigated the temperature field and thawing depth of wide embankment for expressway in permafrost regions based on numerical analysis by using finite element method (FEM). According to specific embankment section of Qinghai-Tibet highway, computational region for numerical analysis was defined. And numerical model was developed through FEM software named as ABAQUS and was verified by field observed data. The effects by width and height of embankment on the thermal regime of computational region were analyzed based on FEM modeling. Numerical analysis showed that embankment construction has serious disturbance on the thermal stability of ground permafrost showing as annual average ground temperature and the maximum thawing depth keeps increasing with service time increasing. And larger embankment width leads to poorer thermal stability and more serious uneven temperature field of embankment. Raising embankment height can improve the thermal stability; however, the improvement is restricted for wide embankment and it cannot change the degradation trend of thermal stability with service life increasing. Thus, to construct expressway with wide embankment in permafrost regions of Qinghai-Tibet Plateau, effective measures need to be considered to improve the thermal stability of underlying permafrost.
Key words:
permafrost region; thermal stability; expressway; embankment��
1 Introduction
Highway construction has been challenge in permafrost regions for decades since it can induce serious permafrost environment changes [1-2]. After highway was constructed in permafrost regions, due to the distinct changing of the local conditions such as micro relief, surface conditions (vegetation, snow covers and water bodies), and physical properties of shallow ground, the energy exchange between the atmosphere and ground was inevitably disturbed [3]. And the imbalance of the surface energy between atmosphere and the ground consequently led to changes of thermal regime of permafrost underlying highway embankment [4]. Especially with asphalt pavement used, the thermal stability of underlying permafrost can be seriously disturbed by the great heat absorption of highways. Taking the Qinghai-Tibet highway in China for example, since updating of asphalt pavement in 1973, more than 60% of the underlying permafrost along the highway had experienced continuous degradation showing temperature increase, permafrost table decline and subsequent talik formation [5-7]. Field observations showed that, from 1996 to 2007, the average annual permafrost temperature at 6 m depth of the embankment increased by 0.44 ��C and the artificial permafrost table increased by 1.67 m [8-9]. Since the mechanical properties of permafrost highly rely on its thermal stability, the variation of thermal regime of permafrost can significantly affect the stability and durability of highway embankment. It is proved that most of the structural failures of highways such as surface waves, transverse and longitudinal cracks, subsidence were closely related to the instability of underlying permafrost [10-12].
Based on laboratory test and field observation, many studies have been conducted on the thermal stability of permafrost underlying highway embankment. Studies showed that, by using concrete pavement instead of asphalt pavement, the ground temperature under cement pavement was always lower than that under asphalt pavement [13]. The monthly average temperature at a depth of 0.5 m below a steel fiber cement concrete pavement was 1.0-3.0 ��C and the annual average temperature was 1.8 ��C lower than that under an asphalt concrete pavement [14]. However, construction of concrete pavement is much more difficult than that of asphalt pavement due to the lack of curing conditions for cement concrete. And concrete pavement is sensitive to low temperature and embankment deformation. Thus, asphalt pavement is still the primary pavement type used in permafrost regions. To prevent the structural damages of highways caused by thawing problem of permafrost, many techniques have been investigated and practiced, such as sun shields over the embankments, insulted layers embedded in embankments, crushed stone embankments, embankments with ventilation ducks or thermosyphones [15-17]. However, due to the complexity of field conditions, pavement distresses related to thawing problem of permafrost were still commonly observed in field [18]. Therefore, understanding the thermal regime and maintaining the thermal stability of permafrost under highways are still the main focuses for highway construction in permafrost regions.
With the rapid economic development of Tibet in recent years, construction of high-grade highways such as expressway is becoming urgent. It is noticed that the design width of expressway embankment is usually within the range of 24.5-45 m, approximately 2.5-4.5 times the current embankment width of Qinghai-Tibet highway. However, most of the previous researches related to the thermal regime and stability of permafrost were based on narrow embankments. To provide fundamental basis for expressway construction in permafrost regions of Qinghai-Tibet, this study focused on the thermal regime of permafrost under wide embankments. Due to lack of field experience of expressway construction in permafrost regions, to achieve this objective, finite element modeling based on commercial software named as ABAQUS was conducted for embankments and verified by field data. The effects by embankment width and height on the temperature field and thawing depth of underlying permafrost were investigated based on numerical analysis.
2 Finite element modeling
2.1 Fundamental theory and equations
In permafrost regions, the freeze-thaw cycle of embankment can be considered thermal conduction and moisture migration accompanying phase changes. Since thermal conduction and convection heat transfer are predominant in the freeze-thaw process, the effects of mass transfer, latent heat of vaporization and chemical potential were negligible in this study. And the following hypotheses were assumed to simplify numerical analysis: soil of each layer of computational region is homogenous; heat transport in the transverse section of computational region is isotropic; and no external load acts on the computational region. Therefore, based on previous researches [19], the two-dimensional heat-fluid coupling equations for embankment can be expressed as follows:
 (1)
(1)
 (2)
(2)
 (3)
(3)
 (4)
(4)
where kx and ky are the components of soil thermal conductivity at x- and y-directions, respectively; Dx and Dy are the components of water diffusivity at x- and y- directions, respectively; �� and ��w are the densities of soil and water respectively; c is the specific heat capacity of soil; C(T) is the equivalent volumetric heat capacity of soil; L is the volumetric latent heat of thawing; wu is the volumetric unfrozen soil moisture; ��x(T) and ��y(T) are the components of the equivalent thermal conductivity of soil at x and y direction respectively; T is temperature; t is time; and x and y represent the horizontal direction and vertical direction in the cross section of the embankment, respectively.
Based on the physical states (frozen or thawed) of frozen soil and the thermal properties of different components of frozen soil, the equivalent thermal parameters of frozen soil can be further expressed in Eqs. (5) and (6).
 (5)
(5)
 (6)
(6)
where csu and csf are the specific heat capacities of soil at thawing and frozen states, respectively; w0 is the initial volumetric unfrozen soil moisture; ci and cw are the specific heat capacities of ice and water, respectively; ��d is the dry density of soil; ��f is the absolute value of freezing temperature of soil; b is a constant related to soil type; ��u and ��f are the thermal conductivities of the thawed and frozen soil, respectively; and D is the water diffusivity.
2.2 Numerical model and parameters
Figure 1 shows the computational region for a specific cross section of embankment and natural ground from Qinghai-Tibet highway. In Fig. 1, part I represents the embankment with geometric dimensions of 3 m in height, 10 m in width and 1:1.5 for the gradient of side slope. To minimize the size effects on numerical analysis, the depth of natural ground underlying embankment is 20 m and the flank fields of both sides from the slope toe of embankment are also 20 m. Parts II, III and IV represent three layers with different soil in the natural ground. The specific material parameters for different parts in the computational region are listed in Table 1. Table 2 summarizes the pavement structure and corresponding material parameters. As shown in Fig. 2, the finite element model for numerical analysis was built based on the computational region shown in Fig. 1. To analyze the influences by the width and height of embankment on the thermal regime of computational region, the width and height of embankment in the numerical model are adjustable. Eight-nodded quadrilateral heat-conducting element was used in the numerical model. And user-defined UMATHT model was developed in ABAQUS to accomplish the definition of equivalent thermal parameters in the numerical model.
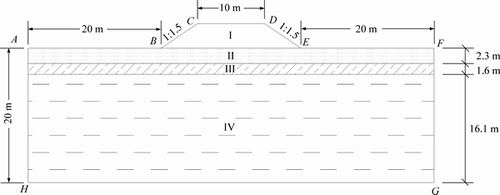
Fig. 1 Profile of computational region
Table 1 Material parameters for different parts in computational region
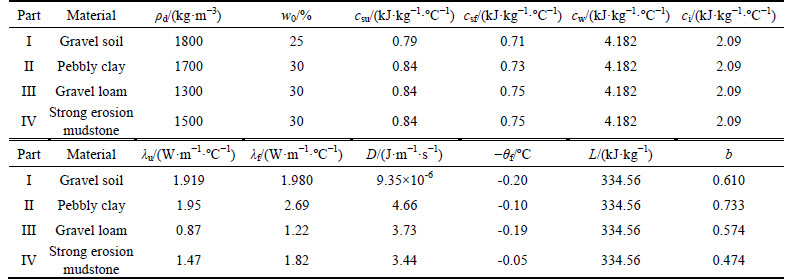
Table 2 Pavement structure and corresponding material parameters
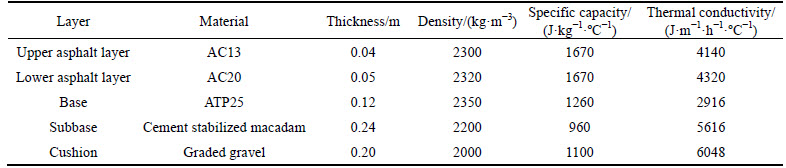
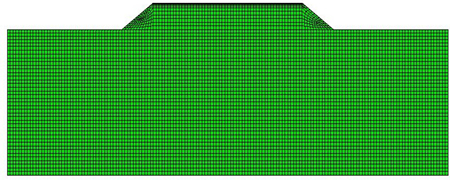
Fig. 2 Numerical model
2.3 Initial conditions and boundary conditions
The initial ground temperatures used in this study were from the field observed data. Table 3 shows the initial temperatures at different depths from the ground surface.
Based on field observed data, Fig. 3 shows the monthly average daily total solar radiation and effective ground radiation used in numerical analysis. And the albedo of asphalt pavement, side slope and natural ground were 0.13, 0.3 and 0.3, respectively. The monthly average wind velocities are summarized in Table 4. According to previous studies [20], the increment of air temperature after 50 years was set to be 2.6��C and the monthly average temperature during numerical analysis can be described by Eq. (7). Finally, user-defined DFLUX and FILM models were developed in ABAQUS to accomplish the definition of boundary conditions in numerical model.
 (7)
(7)
where T is the monthly average temperature; and t is time.
2.4 Verification of numerical analysis
To verify the validity of finite element modeling, numerical analysis was conducted to get the temperature field of the computational region shown in Fig. 1. Figure 4 shows the calculated temperature data and the field observed temperature data at different depths along the centerline of embankment section in 10 years after embankment construction. It can be seen that, since the calculation parameters for numerical analysis are simplified and fixed while the field parameters of real embankment are complex and fluctuant, the temperature data from numerical analysis are not exactly the same with the field observed data. However, they are similar to each other. More importantly, they present similar variation trend. It proves the feasibility of numerical analysis to investigate the temperature field of embankment in permafrost regions.
3 Results and discussion
3.1 Effects of embankment width on temperature field
To analyze the effects of the width of embankment on the temperature field of the computational region, numerical analysis was conducted on embankments with the same height of 3 m but different widths including 10, 18, 26, 34, 42 and 50 m.
Table 3 Initial ground temperatures
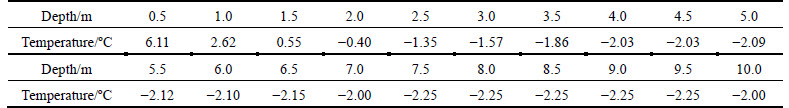
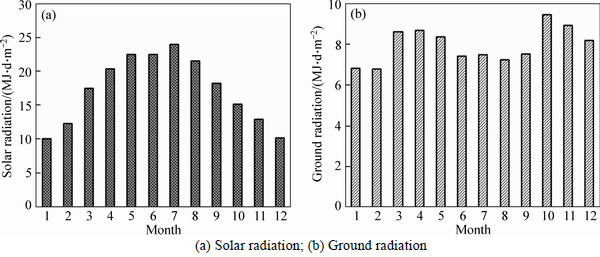
Fig. 3 Field observed data for solar and ground radiation:
Table 4 Monthly average wind velocities

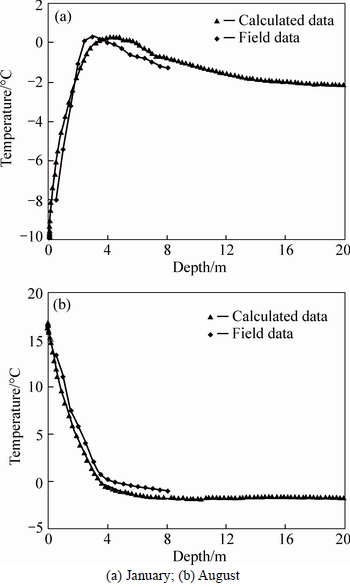
Fig. 4 Calculated and measured temperature data in 10 years after embankment construction:
Figure 5 shows the temperature contour plots of different embankments in January of 20 years after embankment construction. In the figures, the temperatures increase gradually with the colors turning from blue to red. It can be clearly seen that, even at January which the coldest time of permafrost regions is, thawing cores (temperature higher than 0��C represented by the red zone) were found for all of the six embankments with different widths. It also can be seen that, with the embankment width increasing, the size of thawing core increases and its lower boundary displaces downward gradually changing from horizontal surface to concave surface. The temperature variations during two decades at the depth of 5 m along the centerline of embankments with different widths are shown in Fig. 6. It is indicated that the temperatures show annual periodical change while the amplitude values keep increasing. It also shows that, at the same time point, embankment with greater width has higher temperature and vice versa. It proves the serious disturbance of embankment to the thermal regime of natural ground. And larger embankment width has greater negative influence on the thermal stability of natural ground.
The annual highest temperatures during two decades at the depth of 5 m along the centerline, shoulder and slope toe of embankments with different widths are summarized in Fig. 7. It shows that all of the temperatures increase with service time and embankment width increasing. As shown in Fig. 7(a), 20 years after construction, the temperatures at the centerline of embankments with widths of 18, 26, 34, 42 and 50 m are 0.42, 0.72, 0.99, 1.17 and 1.31��C greater than that of embankment with width of 10 m, respectively. It also indicates that the temperatures are always below 0��C during two decades for embankments with width of 10 and 18 m while the temperatures of embankments with width of 26, 34, 42 and 50 m begin to exceed 0��C, after 7, 9, 11 and 18 years of embankment construction.Figure 7(b) shows that the temperatures at the shoulder of embankments with widths of 18, 26, 34, 42 and 50 m are 0.16, 0.28, 0.33, 0.38 and 0.39��C greater than that of embankment with width of 10 m. Figure 7(c) shows that the temperatures at the slope toe of embankments with widths of 18, 26, 34, 42 and 50 m are 0.12, 0.18, 0.21, 0.23 and 0.24��C greater than that of embankment with width of 10 m. And all of the temperatures at the shoulder and slope toe of different embankments are lower than 0��C. It is indicated that increasing of embankment width has obvious negative influence on the ground temperature field but the influence is nonuniform as degradation from centerline to slope toe of embankment. Thus, larger embankment width leads to greater nonuniformity of ground temperature field.
3.2 Effects of embankment width on thawing depth
Figure 8 shows the temperature contour plots of August in 20 years after construction for embankments with different widths. In the figures, the temperatures increase with the colors turning from dark blue to red. And the edge of the dark blue region represents the 0��C contour. It can be seen that, in the hot season, all of the embankments along with part of the underlying ground are in thawing state. It is also indicated that with embankment width increasing, the 0��C contour moves down gradually changing from convex shape to concave shape. The temperature variations along with depth at the centerline of embankments with different width are shown in Fig. 9. It shows that the temperatures decrease with the depth increasing while 0��C appears at greater depth for embankment with larger width. Meanwhile, at the same depth, embankment with larger width has higher temperature. It indicates that larger embankment width leads to greater thawing depth of ground.
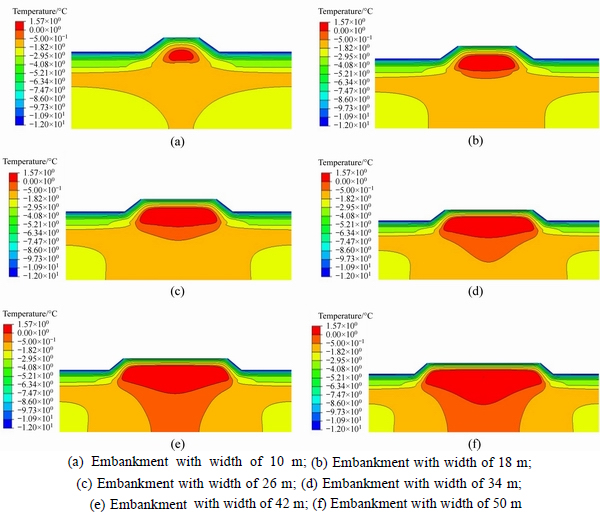
Fig. 5 Temperature contour plots of embankments with different widths in January:
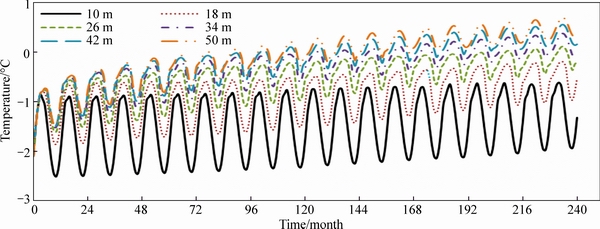
Fig. 6 Temperatures at depth of 5 m along centerline of embankments with different widths
The maximum thawing depths in 20 years after embankment construction at the centerline, shoulder and slope toe of embankments with different width are summarized in Fig. 10. It is indicated that the variation trend of thawing depth versus embankment width at the centerline is much different from that at shoulder and slope toe. Figure 10(a) shows that the thawing depth approximately increases exponentially with the increasing of embankment width. The thawing depths at the centerline of embankments with widths of 18, 26, 34, 42 and 50 m are 0.67, 1.51, 3.06, 4.96 and 7.68 m greater than that of embankment with width of 10 m, respectively. From Figs. 10(b) and (c), the thawing depths at the shoulder and slope toe also increase with embankment width increasing; however, the increment decreases gradually, especially when embankment width exceeds 26 m. It is indicated that the thawing depth at the shoulder of embankments with widths of 18, 26, 34, 42 and 50 m are 0.32, 0.57, 0.65, 0.72 and 0.74 m greater than that of embankment with width of 10 m, respectively. And the thawing depths at the slope toe of embankments with widths of 18, 26, 34, 42 and 50 m are 0.1, 0.17, 0.22, 0.25 and 0.27 m greater than that of embankment with width of 10 m, respectively. Therefore,larger embankment width results in more seriously uneven thawing problems of embankment.
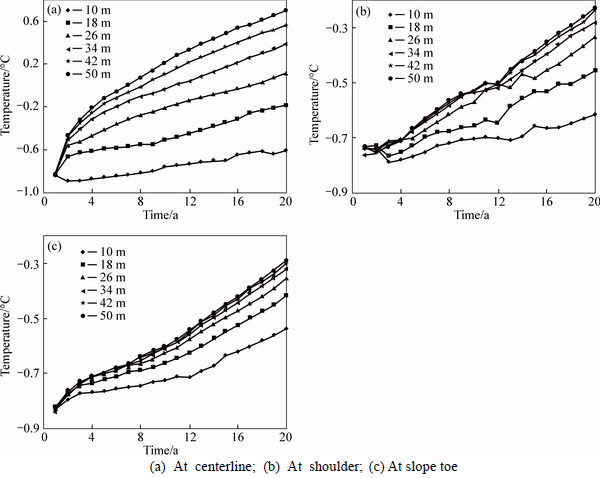
Fig. 7 Annual highest temperatures during two decades for embankments with different widths:
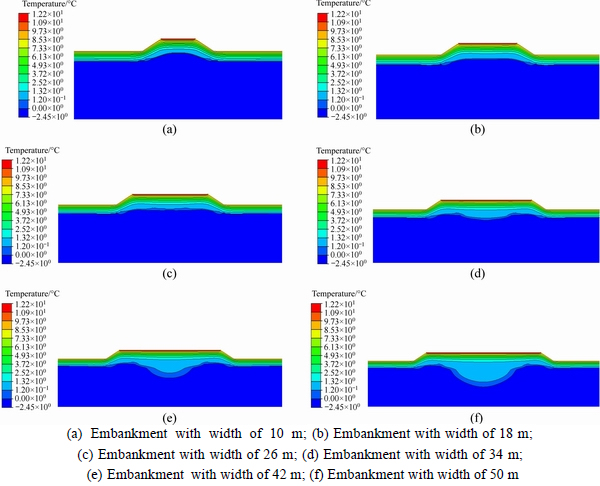
Fig. 8 Temperature contour plots of embankments with different widths in August:
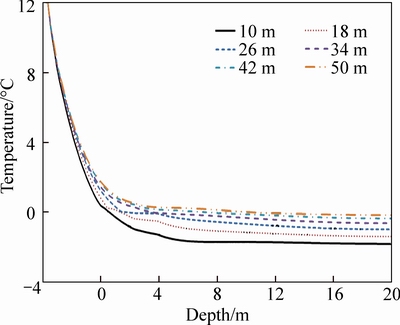
Fig. 9 Temperature variations along with depth at centerline of embankments
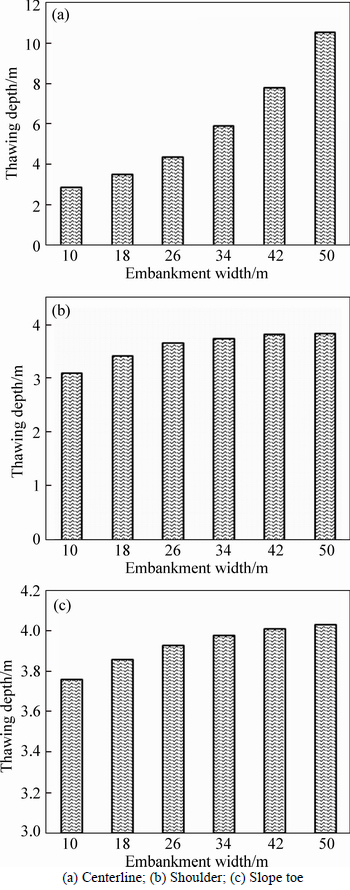
Fig. 10 Maximum thawing depth of embankments with different widths:
3.3 Effect of embankment height on thermal stability
To analyze the influence of the embankment height on the thermal stability of the computational region, numerical analysis was conducted on embankments with different heights including 2, 3, 4, 5, 6 and 7 m to get the temperature fields in 20 years after embankment construction. The maximum thawing depths at the centerline, shoulder and slope toe of embankment versus embankment height for embankments with different width are shown in Fig. 11. In the figures, positive value of depth represents that the maximum thawing depth is in the ground while negative value of depth means that the maximum thawing depth is within the embankment.
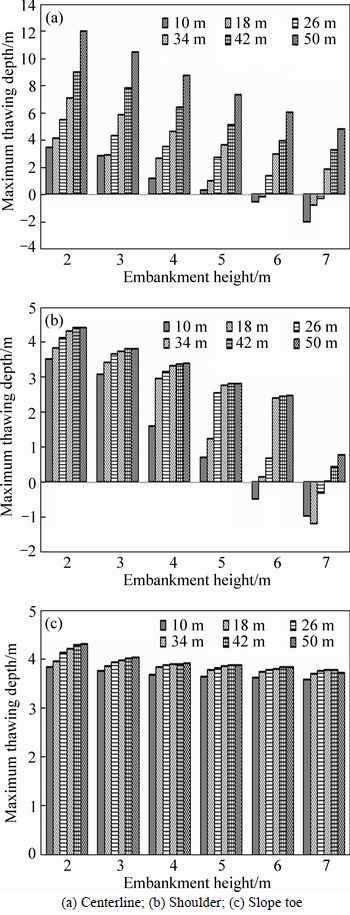
Fig. 11 Influence of embankment height on thawing depth:
From Figs. 11(a) and (b), it can be seen that, when the embankment height reaches 6 m, the maximum thawing depths at the centerline and shoulder of embankment with width of 10 m are within the embankment. When the embankment height reaches 7 m, the maximum thawing depths at the centerline and shoulder of embankments with width of 18 and 26 m are within the embankment while the maximum thawing depths of embankments with widths of 34, 42 and 50 m are still in the ground. More importantly, the distinct differences of thawing depth between centerline and shoulder still exist for embankments with widths of 34, 42 and 50 m. From Fig. 11(c), it can be seen that the maximum thawing depths of different embankments are all in the ground. Although the thawing depth decreases with the embankment height increasing, the influence of embankment height on the thawing depth is limited. Thus, it is indicated that, increasing embankment height is helpful to improve the thermal stability of the ground underlying embankment. But the improvement is obliviously weakened by increasing of embankment width, especially when the embankment width exceeds 26 m. Meanwhile, the analysis in this study is based on two decades. According to the analysis in Section 3.1, the temperature and thawing depth of ground permafrost underlying embankment will inevitably increase with service time increasing. Furthermore, the determination of embankment height needs to consider many complex factors such as mechanical properties of ground and embankment, engineering effort, financial cost.Therefore, other effective measurements need to be considered to protect the thermal stability of ground permafrost underlying expressway with wide embankment.
4 Conclusions
1) It is found that embankment construction causes serious disturbance to the thermal regime of underlying ground. The ground temperatures show periodic variation annually while the annual average ground temperature keeps increasing with service life increasing. It is the most important reason for ground permafrost degradation.
2) It is indicated that larger embankment width has more negative influence on the thermal stability of embankment. At the same service life, the ground temperature and maximum thawing depth increase with embankment width increasing. Meanwhile, larger embankment width leads to more seriously uneven ground temperature field. It can cause serious thawing and uneven settlement problems to wide embankment.
3) The thermal regime of embankment can be improved by raising the embankment height. However, it cannot change the degradation trend of ground thermal stability. And the improvement is limited for wide embankment. Thus, other effective measures need to be considered to improve the thermal stability of ground permafrost underlying wide embankment of expressway.
References
[1] WANG Shuang-jie, CHEN Jian-bing, QI Ji-lin. Study on the technology for highway construction and engineering practices in permafrost regions [J]. Sciences in Cold and Arid Regions, 2009, 1(5): 412-422.
[2] ALFAR M C, CIRO G A, THIESSEN K J, NG T. Case study of degrading permafrost beneath a road embankment [J]. Journal of Cold Regions Engineering, 2009, 23(3): 93-111.
[3] PENG Hui, MA Wei, MU Yan-hu, JIN Long. Impact of permafrost degradation on embankment deformation of Qinghai-Tibet Highway in permafrost regions [J]. Journal of Central South University, 2015, 22(3): 1079-1086.
[4] WU Qing-bai, NIU Fu-jun. Permafrost changes and engineering stability in Qinghai-Xizang plateau [J]. Chinese Science Bulletin, 2013, 58(10): 1079-1094.
[5] SHENG Yu, ZHANG Jian-ming, LIU Yong-zhi, WU Jing-min. Thermal regime in the embankment of Qinghai-Tibetan highway in permafrost regions [J]. Cold Region Science and Technology, 2002, 35(1): 35-44.
[6] WU Qing-bai, LIU Yong-zhi, ZHANG Jian-ming, TONG Chang-jiang. A review of recent frozen soil engineering in permafrost regions along Qinghai-Tibet highway, China [J]. Permafrost and Periglacial Processes, 2002, 13(3): 199-205.
[7] WANG Shao-ling, NIU Fu-jun, ZHAO Lin, LI Shu-xun. The thermal stability of roadbed in permafrost region along the Qinghai-Tibet highway [J]. Cold Regions Science and Technology, 2003, 37(1): 25-34.
[8] WU Qing-bai, NIU Fu-jun. Permafrost changes and engineering stability in Qinghai-Xizang plateau [J]. Chinese Science Bulletin, 2013, 58(10): 1079-1094.
[9] WU Qing-bai, ZHANG Ting-jun. Changes in active layer thickness over the Qinghai�CTibetan plateau from 1995 to 2007 [J]. Journal of Geophysical Research Atmospheres, 2010, 115(D9): 736-744.
[10] YU Qi-hao, LIU Yong-zhi, TONG Chang-jiang. Analysis of the subgrade deformation of the Qinghai-Tibetan Highway [J]. Journal of Glaciology and Geocryology, 2002, 24(5): 623-627. (in Chinese)
[11] ZHANG Chen, WANG Hai-nian, YOU Zhan-ping, MA Biao. Sensitivity analysis of longitudinal cracking on asphalt pavement using MEPDG in permafrost region [J]. Journal of Traffic and Transportation Engineering: English Edition, 2015, 2(1): 40-47.
[12] NIU Fu-jun, CHENG Guo-dong, NI Wan-kui, JIN De-wu. Engineering-related slope failure in permafrost regions of the Qinghai�CTibet Plateau [J]. Cold Regions Science and Technology, 2005, 42(3): 215�C225.
[13] ZHANG Jun-wei, LI Jin-ping, QUAN Xiao-juan. Thermal stability analysis under embankment with asphalt pavement and cement pavement in permafrost regions [J]. The Scientific World Journal, 2013, 2013 (Article ID549623): 1-12.
[14] LI Jin-ping, SHENG Yu. Analysis of the thermal stability of an embankment under different pavement types in high temperature permafrost regions [J]. Cold Regions Science and Technology, 2008, 54(2): 120-123.
[15] WEN Zhi, YU Sheng, MA Wei, QI Ji-lin. In situ experimental study on thermal protection effects of the insulation method on warm permafrost [J]. Cold Regions Science and Technology, 2008, 53(3): 369�C381.
[16] WU Jun-jie, MA Wei, SUN Zhi-zhong, WEN Zhi. In-situ study on cooling effect of the two-phase closed thermosyphon and insulation combinational embankment of the Qinghai�CTibet [J]. Cold Regions Science and Technology, 2010, 60(3): 234�C244.
[17] SUN Bin-xiang, YANG Li-jun, LIU Qi, WANG Wei, XU Xue-zu. Experimental study on cooling enhancement of crushed rock layer with perforated ventilation pipe under airtight top surface [J]. Cold Regions Science and Technology, 2011, 68(3): 150�C161.
[18] WANG Shuang-jie, CHEN Jian-bing, ZHANG Jin-zhao, LI Zhu-long. Development of highway constructing technology in the permafrost region on the Qinghai-Tibet plateau [J]. Science in China Series E: Technological Sciences, 2009, 52(2): 497�C506.
[19] HARLAN R L. Analysis of coupled heat-fluid transport in partially frozen soil [J]. Journal of Water Resource Research, 1973, 9(5): 1314�C1323.
[20] WANG Shuang-jie, HUANG Xiao-ming, HOU Shu-guang. Numerical analyses of pavement deformation and stress in permafrost regions [J]. Journal of Glaciology and Geocryology, 2006, 28(2): 217�C222. (in Chinese)
(Edited by YANG Hua)
Foundation item: Project(2014BAG05B04) supported by the National Science and Technology Support Program, China; Project(51378006) supported by the National Natural Science Foundation of China; Project(2242015R30027) supported by the Excellent Young Teacher Program of Southeast University, China
Received date: 2015-09-30; Accepted date: 2016-03-22
Corresponding author: MA Tao, Associate Professor, PhD; Tel: +86-25-83790551; E-mail: matao@seu.edu.cn
Abstract: This study investigated the temperature field and thawing depth of wide embankment for expressway in permafrost regions based on numerical analysis by using finite element method (FEM). According to specific embankment section of Qinghai-Tibet highway, computational region for numerical analysis was defined. And numerical model was developed through FEM software named as ABAQUS and was verified by field observed data. The effects by width and height of embankment on the thermal regime of computational region were analyzed based on FEM modeling. Numerical analysis showed that embankment construction has serious disturbance on the thermal stability of ground permafrost showing as annual average ground temperature and the maximum thawing depth keeps increasing with service time increasing. And larger embankment width leads to poorer thermal stability and more serious uneven temperature field of embankment. Raising embankment height can improve the thermal stability; however, the improvement is restricted for wide embankment and it cannot change the degradation trend of thermal stability with service life increasing. Thus, to construct expressway with wide embankment in permafrost regions of Qinghai-Tibet Plateau, effective measures need to be considered to improve the thermal stability of underlying permafrost.
