
J. Cent. South Univ. Technol. (2011) 18: 1248-1255
DOI: 10.1007/s11771-011-0829-9![]()
Performance index limits of high reinforced concrete shear wall components
LAO Xiao-chun(������)1, 2, HAN Xiao-lei(����)1, 2
1. School of Civil Engineering and Transportation, South China University of Technology,
Guangzhou 510640, China;
2. State Key Laboratory of Subtropical Architecture Science, South China University of Technology,
Guangzhou 510640, China
? Central South University Press and Springer-Verlag Berlin Heidelberg 2011
Abstract:
The deformation performance index limits of high reinforced concrete (RC) shear wall components based on Chinese codes were discussed by the nonlinear finite element method. Two typical RC shear wall specimens in the previous work were first used to verify the correctness of the nonlinear finite element method. Then, the nonlinear finite element method was applied to study the deformability of a set of high RC shear wall components designed according to current Chinese codes and with shear span ratio �ˡ�2.0. Parametric studies were made on the influence of shear span ratio, axial compression ratio, ratio of flexural capacity to shear capacity and main flexural reinforcement ratio of confined boundary members. Finally, the deformation performance index and its limits of high RC shear wall components under severe earthquakes were proposed by the finite element model results, which offers a reference in determining the performance status of RC shear wall components designed based on Chinese codes.
Key words:
1 Introduction
Reinforced concrete (RC) shear wall component is a very important lateral force-resisting member of the tall buildings. Its seismic behavior has a great impact on the seismic performance of the overall structure. The method recommended by current Chinese codes [1-2] for RC shear wall component design is based on its load-carrying capacities, and the ductility demand of RC shear wall components under fortified earthquakes and severe earthquakes is only guaranteed by using corresponding structure measures. There are no criteria in current Chinese codes to determine the performance status and deformability of RC shear wall components under earthquakes. A lot of works have been done to study the seismic behavior and impact factors of RC shear wall components. For example, QIAN and XU [3] have developed a displacement-based deformation capacity design method for RC shear walls and given an expression for the stirrup characteristic value for a specified drift demand. XIN et al [4] have proposed the length of confined zones and the transverse reinforcement characteristic values of boundary element of RC shear walls in different seismic grades and axial compression ratios. ZHANG et al [5] have discussed the influence of the boundary stirrup on the damage mode, the bearing capacity, the displacement ductility ratio, the stiffness as well as the energy dissipation capacity of the RC shear walls and proposed the correlative suggestions for RC shear wall design. However, the deformation performance criteria of the RC shear wall components are still unspecified and unavailable in practical project.
On the other hand, due to the differences of seismic fortification level, materials and construction requirements between Chinese codes and American codes, the deformation performance criteria of RC shear wall components in FEMA 356 [6] and ASCE 41-06 [7] cannot be applied directly in practical projects in China. In order to develop the performance-based design method, it is necessary to build up the acceptance performance criteria of RC shear wall components based on Chinese codes.
By using the nonlinear finite element method, parametric studies were carried on the influence of shear span ratio, axial compression ratio, ratio of flexural capacity to shear capacity and main flexural reinforcement ratio of confined boundary members. The deformation performance index and its limits of high RC shear wall components with shear span ratio, �ˡ�2.0, are presented based on Chinese codes.
2 Nonlinear finite element model verification
RC shear wall specimens were used to verify the correctness of the nonlinear finite element model. The simulation of two RC shear wall specimens in the previous work [8] and the comparison between the analysis results and experimental data were discussed.
2.1 Details of RC shear wall specimens
Each RC shear wall specimen was subjected to a combination of axial loading and cyclic horizontal loading/displacement on the top. The principal experiment data of the RC shear wall specimens are listed in Table 1.
2.2 Nonlinear finite element models
The RC shear wall specimens were simulated by the nonlinear finite element software ABAQUS. The related model parameters are stated below.
1) The independent micro-element model was applied. The concrete was modeled using solid element C3D8R and two elements were created along the thickness direction of the RC shear wall component. The reinforcing bar was modeled using 3-D truss element T3D2. The *embedded technology was used to handle the interaction between the reinforcing bar elements and the concrete elements. There was no consideration about the bond-slip behavior in the model because it was noticeable only in the circumstance that the deformation of the component was very large.
2) The concrete damage plasticity model provided by ABAQUS was used as the constitutive model of concrete. The strength of the concrete is listed in Table 1, and the uniaxial compressive and tensile stress-strain curves used in the model are recommended by ��Code for design of concrete structures�� [9]. The parameters related to the plasticity of the concrete are specified below: the dilation angle took 38�� according to experience and the concrete strength; the flow potential eccentricity took 0.1; the ratio of initial equibiaxial compressive yield stress to initial uniaxial compressive yield stress took 1.16; the ratio of the second stress invariant on the tensile meridian to that on the compressive meridian took 2/3; the viscosity parameter took 1��10-5, which could promote the convergence rate with little impact on the calculation precision. The strength and stress-strain curve of the reinforcing bars were determined by the results of the reinforcing bar tensile tests.
3) The research in Ref.[10] indicated that the shape of the skeleton curve of cyclic loading test was similar to that of the load-displacement curve of monotonic loading test when the axial compression ratio of RC shear wall component was relatively low (��=0-0.368), and the difference of the peak capacity was less than 10%. Thus, the monotonic loading mode was applied in the specimen simulation with the calculation error within the allowable range.
2.3 Comparison of results
The finite element model results and the experimental results of the specimens were compared. Figure 1 shows the comparison of load-displacement curves between experiment and simulation of specimen 1 and specimen 2, respectively. When the displacement on the top is more than 19 mm, the deformation of the specimen is of no concern because it exceeds the limits of ��Technical specification for concrete structures of tall building�� [1] under sever earthquakes and the simulation model may have numerical distortion at that time. Moreover, the comparison of the strain of outermost tensile and compressive reinforcing bar in the bottom between experiment and simulation of the specimens is demonstrated in Figs.2 and 3. Due to the measuring range of the strain gauge, only the former stage of strain can be obtained in experiments. The variation of the strain with load of the finite element model is consistent with that of the experiment, and the differences of the strain are minor between the simulation and experiment.
In conclusion, the mechanical behavior, failure mode and deformation of the finite element models are basically in accordance with those of the specimens. As a consequence, the nonlinear finite element model can reliably be used to analyze RC shear wall components.
Table 1 Principal experiment data of RC shear wall specimens
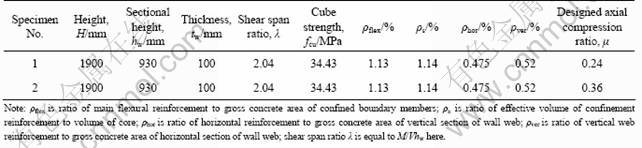
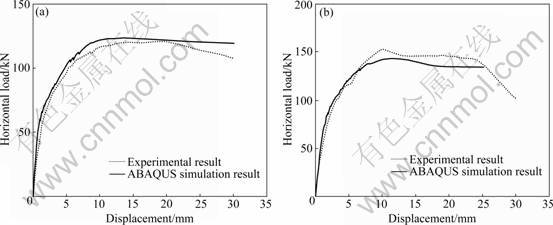
Fig.1 Load-displacement curves of specimens: (a) No.1; (b) No.2
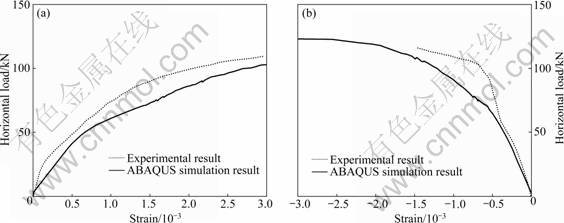
Fig.2 Strains of outermost rebar in bottom of specimen 1: (a) Tensile rebar; (b) Compressive rebar
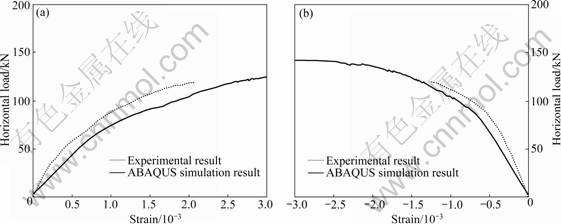
Fig.3 Strains of outermost rebar in bottom of specimen 2: (a) Tensile rebar; (b) Compressive rebar
3 Performance status of RC shear wall components
3.1 Yield status and yield deformation of RC shear wall components
The energy-equivalent method and geometric graphic method are commonly used to determine the yield point of components. The method recommended by ��Design specification for joints and connections of precast monolithic reinforced concrete frames�� [11] is stated below: 1) When there is an obvious inflection on the load-deformation skeleton curve, the load of the inflection point can be taken as the yield load Fy and the corresponding deformation is the yield deformation uy; 2) For the load-deformation skeleton curve with no obvious inflection, the ultimate load ![]() on the curve can be found out and a horizontal line whose load is
on the curve can be found out and a horizontal line whose load is ![]() intersects with the ascending part of F-u curve at point A. Then, prolong OA and intersect with the horizontal line whose load is
intersects with the ascending part of F-u curve at point A. Then, prolong OA and intersect with the horizontal line whose load is ![]() at point B. Finally, sketch a vertical line that passes point B to intersect with the F-u curve at point E (as shown in Fig.4). Point E is the yield point of the F-u curve while the corresponding load is the yield load Fy and the corresponding deformation is the yield deformation uy of the components, respectively. In some literatures, the yield point of the tensile reinforcing bar in the outermost layer of the section is taken as the yield point of the components. The smaller yield deformation derived from the above two methods is taken as the yield deformation of RC shear wall components for safety in this work.
at point B. Finally, sketch a vertical line that passes point B to intersect with the F-u curve at point E (as shown in Fig.4). Point E is the yield point of the F-u curve while the corresponding load is the yield load Fy and the corresponding deformation is the yield deformation uy of the components, respectively. In some literatures, the yield point of the tensile reinforcing bar in the outermost layer of the section is taken as the yield point of the components. The smaller yield deformation derived from the above two methods is taken as the yield deformation of RC shear wall components for safety in this work.
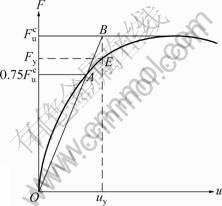
Fig.4 Yield point on load-deformation curve of components
3.2 Ultimate status and ultimate deformation of RC shear wall components
For high RC shear wall components controlled by flexure, it is considered to have reached the ultimate status when one of the following four conditions occurs.
1) Tensile longitudinal reinforcing bar reaches the ultimate tensile strain. The lower limits of total elongation at the maximum force Agt for common HPB235, HRB335 and HRB400 reinforcing bars are given in ��Steel for the reinforcement of concrete�� [12-13]. The total elongation at the maximum force is taken as the ultimate tensile strain of reinforcing bars for safety. Consequently, the ultimate tensile strain of HPB235 reinforcing bars is 0.100, and that of HRB335 and HRB400 reinforcing bars is 0.075.
2) Concrete reaches the ultimate compressive strain. Based on Refs.[14-16], the ultimate compressive strain of the concrete in compressive zone is determined by the following two standards and the smaller value is taken as the ultimate compressive strain ��cm. Standard 1: The convergence point E on the descending part of the compressive stress-strain curve is taken as the failure point of the concrete and the corresponding strain ��E is taken as the ultimate compressive strain ��cm. Generally, it is advisable to take the point of which the stress decreases to 50% of the peak stress as the convergence point [16], namely ��cm=��0.5; Standard 2: Ref.[15] indicates that the ultimate compressive strain of the concrete confined by common stirrups is less than 0.015, therefore it takes ��cm��0.015 in this work.
3) Compressive longitudinal reinforcing bar reaches the buckling strain. It is common to find that the longitudinal reinforcing bars buckle and form a shape of lantern in experiments. In this case, the spilling of concrete cover is serious, meanwhile, the large bond-slip occurs and the bond force decreases sharply. Without the confinement of concrete, the compressive longitudinal reinforcing bars between stirrups buckle and the compressive stress of core concrete decrease sharply. When the stirrup space is relatively small, the buckling of reinforcing bars is not the controlling factor of the ultimate status for RC shear wall components.
4) The bearing capacity decreases to 85% of the peak capacity. Take the point of which load is 85% of the peak load on the descending part as the ultimate status point of the component according to ��Design specification for joints and connections of precast monolithic reinforced concrete frames�� [11].
In the above four conditions, condition 3) usually occurs after condition 2) and it is not a controlling factor, thus conditions 1), 2) and 4) are taken as the criteria to determine the ultimate status of RC shear wall components. The minimum deformation of the components in ultimate status obtained by the above criteria is taken as the ultimate deformation.
3.3 Ultimate plastic deformation of RC shear wall components under earthquakes
The inelastic deformation and structural damage of RC shear wall components are very small before yielding. The yield deformation can be taken as the deformation limit of RC shear wall components under frequent earthquakes to satisfy the seismic design demands ��no damage in frequent earthquakes�� of current Chinese codes. The components are seriously damaged and their bearing capacity decreases obviously after RC shear wall components have reached the ultimate status. Therefore, the ultimate deformation can be considered as the deformation limit of RC shear wall components under severe earthquakes to ensure the seismic design demands ��no collapse in severe earthquakes��. The performance status of RC shear wall components is closely related to their plastic deformation, hence the plastic deformation, the current deformation minus the yield deformation, is regarded as the seismic performance index of RC shear wall components. Thus, the plastic deformation under frequent earthquakes is limited to 0, and the plastic deformation under severe earthquakes is limited to the ultimate plastic deformation, the ultimate deformation minus the yield deformation, which is expressed using the parameter a. The plastic deformation under fortified earthquakes is limited to the value between 0 and a. The determination of the limits of plastic deformation of RC shear wall components under sever earthquakes will be discussed in detail.
4 Performance index limits of high RC shear wall components
Many factors impact on the deformability of RC shear wall components such as shear span ratio, axial compression ratio, ratio of flexural capacity to shear capacity, and confining conditions of boundary members. The deformability of RC shear wall components with �ˡ�2.0 and the impact factors are studied by the nonlinear finite element method.
4.1 Design of high RC shear wall components
The failure of RC shear wall usually occurs in the bottom of the wall. Thus, 224 high RC shear wall components were designed based on the demands in ��Technical specification for concrete structures of tall building�� [1] for strengthening the bottom part of RC shear wall whose seismic class was two. The concrete strength was C30. The design parameters of the RC shear wall components are listed in Table 2. The shear span ratio �� varied from 2.0 to 3.5, the main flexural reinforcement ratio of confined boundary members ��flex from 1% to 4%, and the axial compression ratio �� from 0 to 0.7 (all the designed axial compression ratios exceeded the requirements of the codes). The ratio of flexural capacity to shear capacity m=Mreal/(VrealH) was calculated according to ��Technical specification for concrete structures of tall building�� [1] and included the following two cases: 1) Take m=0.7 and ensure the reinforcement ratio of horizontal distribution bars to meet the construction requirements; 2) Take the same reinforcement ratio of horizontal distribution bars for the components with different axial compression ratios in a shear span ratio and ensure m��0.7. Both cases met the requirements of ��strong shear weak bending�� in the codes. The stirrups in boundary members and the vertical distribution reinforcing conditions both satisfied the corresponding demands in current Chinese codes.
4.2 Nonlinear finite element model of designed RC shear wall components
ABAQUS was applied to simulate the designed RC shear wall components. The standard values of concrete and reinforcing bar strength were used in the nonlinear finite element models. The other model parameters are the same as Section 2. The element side length of concrete was 100 mm and along the thickness direction the RC shear wall component was divided into two concrete elements. The element side length of reinforcing bar was about 100 mm. The monotonic displacement was exerted on the top of the wall. Because the axial compression ratio has an impact on the pinch effect of the load-displacement hysteretic curve, the relatively conservative plastic deformation is taken for the components with high axial compression ratio (��=0.5- 0.7).
4.3 Performance index limits of high RC shear wall components
The performance index should well reflect the performance status and damage degree of the components since it is the criterion to determine the performance of the components. The finite element simulation analysis indicates the following facts. 1) For RC shear wall components with 2.5�ܦˡ�3.5, the flexure failure usually occurs and there is a plastic zone of which the height is equal to or less than 0.5hw in the bottom when the demand ��strong shear weak bending�� is satisfied. The plastic rotation of the plastic zone can be taken as the performance index of these RC shear wall components. The rotation of the plastic zone of the component is shown in Fig.5. 2) For RC shear wall components with ��=2.0, the components are controlled by flexure when ��flex is 1%-2%, as shown in Fig.6(a). Nevertheless, when ��flex is 3%-4%, relatively obvious shear deformation occurs in the central wall web and the components are controlled by flexure-shear because the confined boundary members are relatively strong, as shown in Fig.6(b). In the latter condition, it cannot change the failure mode to increase shear reinforcing bars. Consequently, it is not suitable to take the plastic rotation of the plastic zone as the performance index of these RC shear wall components. The harmless drift of the component caused by the rotation of the plastic zone is small when �� is relatively small. Thus, the plastic drift is taken as the performance index of the RC shear wall components with 2.0�ܦ�<2.5 in this work. The total drift of the component is shown in Fig.7.
Table 2 Design parameters of RC shear wall components
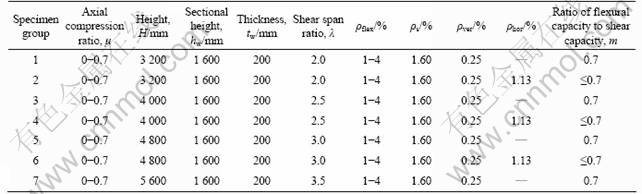
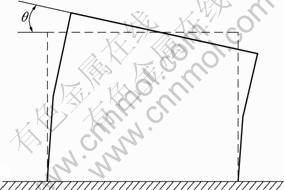
Fig.5 Plastic zone rotation
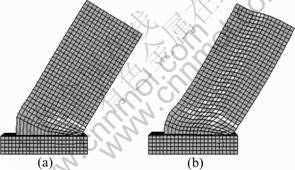
Fig.6 Deformation of RC shear wall components: (a) ��flex=1%- 2%; (b) ��flex=3%-4%
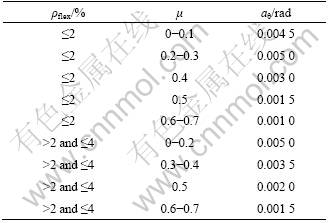
Based on the finite element result and the calculation of the ultimate plastic deformation for the RC shear wall components under severe earthquakes as mentioned in Section 3, the evolution of the ultimate plastic rotation a�� of the RC shear wall components with 2.5�ܦˡ�3.5 can be obtained under different impact factors (as shown in Fig.8). It can be seen that ��flex and �� are two important factors for a�� when �� is greater than or equal to 2.5. And �� and m have little influence on a�� under the same situation. When �� varies from 0 to 0.2, the main factor that controls the ultimate status of the components is the ultimate tensile strain of reinforcing bar. The ultimate plastic rotation a�� for these components is smaller than the value obtained by experiments since the ultimate tensile strain of reinforcing bar based on the codes is smaller than the experimental value. When �� changes from 0.3 to 0.5, the main factor that controls the ultimate status of the components is the ultimate compressive strain of concrete. When �� varies from 0.6 to 0.7, the main factor that controls the ultimate status of the components is the bearing capacity of the component. The limits of ultimate plastic rotation a�� for the components under severe earthquakes are given based on different ��flex and �� when �� is greater than or equal to 2.5, as listed in Table 3.
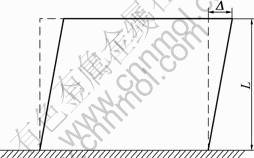
Fig.7 Total drift (=��/L)
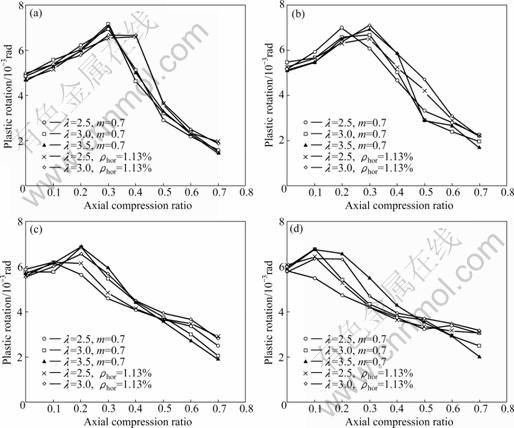
Fig.8 Ultimate plastic rotation a�� of RC shear wall components: (a) ��flex��1%; (b) ��flex��2%;(c) ��flex��3%;(d) ��flex��4%
Table 3 Limits of ultimate plastic rotation a�� of RC shear wall components with �ˡ�2.5
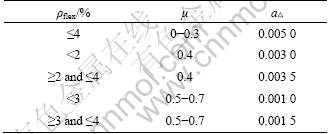
The finite element results show that there is obvious shear deformation in some RC shear wall components with ��=2.0. When ��flex is relatively large, it is probable that large shear deformation occurs in the web before the boundary members reach the ultimate status. Therefore, it is necessary to raise the control conditions of shear deformation to determine the ultimate status of RC shear wall components with ��=2.0. Since the normal strain in the web is comparatively small when the shear strain is relatively large (always less than 15% of shear strain), it is advisable to take the condition that the shear strain of the web reaches 0.015 (the corresponding equivalent principal compressive strain is about 0.015) as the one that determines the ultimate status of the components. According to the above condition and discussion in Section 3.2, the smallest deformation in those conditions is taken as the ultimate plastic deformation of the component under severe earthquakes. The evolution of the ultimate plastic drift a�� of RC shear wall components with ��=2.0 under different impact factors is shown in Fig.9. It illustrates that ��flex and �� are two important factors for a�� when �� is equal to 2.0. Meanwhile, m has some influences on a�� when �� is relatively small. The limits of ultimate plastic drift a�� for the components under severe earthquakes are given based on different ��flex and �� when �� is between 2.0 and 2.5, as listed in Table 4.
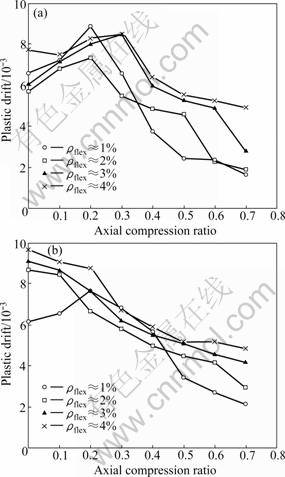
Fig.9 Ultimate plastic drift a�� of RC shear wall components with ��=2.0: (a) Group 1; (b) Group 2
Table 4 Limits of ultimate plastic drift a�� of RC shear wall components with 2.0�ܦ�<2.5
5 Conclusions
1) A nonlinear finite element method was used to simulate RC shear wall specimens. It is found that the nonlinear finite element model can well predict the force status and deformability of RC shear wall components.
2) Based on the failure characteristics of RC shear wall components, the criteria of yield status and ultimate status are proposed for RC shear wall components.
3) Parametric studies were carried on the influence of shear span ratio ��, axial compression ratio ��, ratio of flexural capacity to shear capacity m and main flexural reinforcement ratio of confined boundary members ��flex.
4) According to the nonlinear finite element analysis results, the limits of ultimate plastic rotation a�� of the RC shear wall components with �ˡ�2.5 and the limits of ultimate plastic drift a�� of those with 2.0�ܦ�<2.5 under severe earthquakes are proposed to offer a reference in determining the performance status of RC shear wall components designed based on Chinese codes.
References
[1] Industry Standard of People��s Republic of China. JGJ 3��2002. Technical specification for concrete structures of tall building [S]. Beijing: China Building Industry Press, 2002. (in Chinese)
[2] National Standard of People��s Republic of China. GB 50011��2001. Code for seismic design of buildings [S]. Beijing: China Building Industry Press, 2001. (in Chinese)
[3] QIAN Jia-ru, XU Fu-jiang. Displacement-based deformation capacity design method of RC cantilever walls [J]. Journal of Tsinghua University: Science and Technology, 2007, 47(3): 305-308. (in Chinese)
[4] XIN Li, LIANG Xing-wen, DENG Ming-ke. Plastic hinge rotation-based design method of shear wall��s boundary elements [J]. Industrial Construction, 2009, 39(6): 50-54, 64. (in Chinese)
[5] ZHANG Hong-mei, LU Xi-lin, YANG Xue-ping, ZHANG song. Influence of boundary stirrup on seismic behavior of reinforced concrete shear walls [J]. Structural Engineers, 2008, 24(5): 100-104, 118. (in Chinese)
[6] FEMA 356. Prestandard and commentary for the seismic rehabilitation of buildings [S]. Reston, Virginia: American Society of Civil Engineers, 2000.
[7] ASCE 41-06. Seismic Rehabilitation of Existing Buildings [S]. Reston, Virginia: American Society of Civil Engineers, 2007.
[8] JI Jing, LI Shou-fang, HAN Xiao-lei, YANG Zhi-qiang, ZHENG Yi. Study on comparative experiments of shear walls without boundary elements [J]. Building Science, 2007, 23(11): 41-45. (in Chinese)
[9] National Standard of People��s Republic of China. GB 50010��2002. Code for design of concrete structures [S]. Beijing: China Building Industry Press, 2002. (in Chinese)
[10] SHEN Ju-min, WENG Yi-jun, FENG Shi-ping. Behavior of R. C. compression-flexure members under cyclic loading [J]. China Civil Engineering Journal, 1982, 15(2): 53-64. (in Chinese)
[11] China Engineering Construction Standardized Association Standard. CECS 43: 92. Design specification for joints and connections of precast monolithic reinforced concrete frames [S]. Beijing: China Building Industry Press, 1992. (in Chinese)
[12] National Standard of People��s Republic of China. GB 1499.1��2008. Steel for the reinforcement of concrete-Part 1: Hot rolled plain bars [S]. Beijing: Standards Press of China, 2008. (in Chinese)
[13] National Standard of People��s Republic of China. GB 1499.2��2007. Steel for the reinforcement of concrete-Part 2: Hot rolled ribbed bars [S]. Beijing: Standards Press of China, 2007. (in Chinese)
[14] ZHANG Xiu-qin, GUO Zhen-hai, WANG Chuan-zhi. The complete stress-strain curve for confined concrete with Stirrups under cyclic loading [J]. Industrial Buildings, 1985, (12): 16-20. (in Chinese)
[15] LU Wen, QIAN Jia-ru, FANG E-hua. Experimental and computational studies on ductility of reinforced concrete shear walls [J]. Journal of Tsinghua University: Science and Technology, 1999, 39(4): 88-91. (in Chinese)
[16] QIAN Jia-ru, CHENG Li-rong, ZHOU Dong-liang. Behavior of axially loaded concrete columns confined with ordinary hoops [J]. Journal of Tsinghua University: Science and Technology, 2002, 42(10): 1369-1373. (in Chinese)
(Edited by YANG Bing)
Foundation item: Project(2009ZA04) supported by the Independent Research Foundation of State Key Laboratory of Subtropical Architecture Science, China
Received date: 2010-07-05; Accepted date: 2010-10-29
Corresponding author: LAO Xiao-chun, PhD candidate; Tel: +86-20-87113349; E-mail: morningspring80@163.com
