

Adiabatic shear sensitivity of ductile metal based on
gradient-dependent JOHNSON-COOK model
WANG Xue-bin
College of Mechanics and Engineering, Liaoning Technical University, Fuxin 123000, China
Received 18 June 2010; accepted 5 November 2010
Abstract:
Based on the expression proposed by WANG for the local plastic shear deformation distribution in the adiabatic shear band (ASB) using gradient-dependent plasticity, the effects of 10 parameters on the adiabatic shear sensitivity were studied. The experimental data for a flow line in the ASB obtained by LIAO and DUFFY were fitted by use of the curve-fitting least squares method and the proposed expression. The critical plastic shear strains corresponding to the onset of the ASB for Ti-6Al-4V were assessed at different assigned ASB widths. It is found that the proposed expression describes well the non-linear deformation characteristics of the flow line in the ASB. Some parameters in the JOHNSON-COOK model are back-calculated using different critical plastic shear strains. The adiabatic shear sensitivity decreases as initial static yield stress, work to heat conversion factor and strain-rate parameter decrease, which is opposite to the effects of density, heat capacity, ambient temperature and strain-hardening exponent. The present model can predict the ASB width evolution process. The predicted ASB width decreases with straining until a stable value is reached. The famous model proposed by DODD and BAI only can predict a final stable value.
Key words:
adiabatic shear band; Ti-6Al-4V; JOHNSON-COOK model; width; gradient-dependent plasticity theory; local plastic shear deformation distribution;
1 Introduction
Because titanium alloys possess the properties of high strength, low density and low thermal conductivity, they are very sensitive to adiabatic shear under dynamic loading conditions [1-4]. Adiabatic shear bands (ASBs) are narrow bands in which deformational lines (or called flow lines) are curved (Fig. 1(a)), showing highly nonuniform deformation characteristics. Curved flow lines are observed in the later stage of the plateau stage of the shear stress-nominal shear strain curve(Fig. 1(b)). The flow lines in Fig. 1(a) correspond to the position of number 3 in Fig. 1(b). Using traditional elastoplastic theories, the distribution of the strain, deformation, temperature and damage extent in the ASB and the band width cannot be predicted.
The ASB width can provide a measure of the adiabatic shear sensitivity. Some experimental results show that ASBs become narrow at high strain rates and low ambient temperatures. To model the thickness of the ASB for Ti-6Al-4V at different loading rates [5-7], WANG [8] proposed a simple model. In the model, the ASB width was defined as the width (w5%) of the region surrounding the band center over which the temperature differed from its peak value by less than 5%, which was similar to the viewpoint proposed by BATRA and KIM [9]. In the proposed model, the temperature distribution in the ASB was nonuniform [10-11], which was dependent on the plastic shear strain distribution [12-13]. The plastic shear strain distribution and the total thickness of the ASB were controlled by the internal length parameter in gradient-dependent plasticity (GDP) [14-15]. Based on the gradient-dependent JOHNSON- COOK model, the width w5% was calculated [8]. It is shown that the ASB becomes wide at low strain rates; the width w5% is decreased rapidly as strain rate increases; and the width w5% remains a constant at high strain rates. The theoretical result is very consistent with the experimental result for tungsten alloy by WEERASOORIYA and BEAULIEU [7].
The present work based on the WANG��s model is to study the effects of parameters on the ASB width w5%. The experimental data of the local shear deformation distribution in an ASB for Ti-6Al-4V [3] are fitted by use of the curve-fitting least squares method. Using the different critical plastic shear strains, some parameters in the JOHNSON-COOK model are back-calculated and the influence of some parameters on the adiabatic shear sensitivity is investigated.
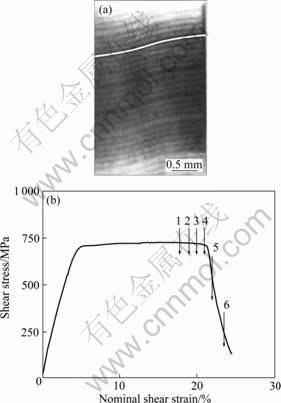
Fig. 1 Flow lines for Ti-6Al-4V specimen using high-speed photography (a) and measured shear stress��shear strain curve (b) in dynamic torsion test [3]
2 Theoretical analyses
2.1 Local plastic shear deformation distribution in ASB and coordinate transformation
A narrow ASB subjected to shear stress is shown in Fig. 2. A simple expression for the local plastic shear deformation distribution ��p(y) in an ASB was proposed by WANG [8, 10-12] using GDP:
![]() (1)
(1)
where y is the coordinate whose original point is set at the ASB center; ![]() is the critical plastic shear strain corresponding to the onset of the ASB; if the ASB is assumed to be initiated just at the peak shear stress, then
is the critical plastic shear strain corresponding to the onset of the ASB; if the ASB is assumed to be initiated just at the peak shear stress, then ![]() is equal to the average plastic shear strain corresponding to the peak shear stress;
is equal to the average plastic shear strain corresponding to the peak shear stress; ![]() is the average plastic shear strain of the ASB, which is a variable and is increased with loading time; and l is the internal length parameter in GDP, reflecting the heterogeneous extent of ductile metal material. For material with a higher internal length parameter, it is more nonuniform in microstructures. The internal length parameter depends on the total thickness w of the ASB: l=w/(2��).
is the average plastic shear strain of the ASB, which is a variable and is increased with loading time; and l is the internal length parameter in GDP, reflecting the heterogeneous extent of ductile metal material. For material with a higher internal length parameter, it is more nonuniform in microstructures. The internal length parameter depends on the total thickness w of the ASB: l=w/(2��).
Fig. 2 ASB subjected to shear stress
Integrating ��p(y) leads to the local plastic shear deformation distribution sp(y) in the ASB:
![]() (2)
(2)
It can be found that the expression for sp(y) includes four parameters: ![]() , l,
, l, ![]() and y. For a flow line in high-speed photographs,
and y. For a flow line in high-speed photographs, ![]() , l and
, l and ![]() are specific, while y is a variable denoting different positions in the ASB. Introducing two coefficients c1 and c2 leads to:
are specific, while y is a variable denoting different positions in the ASB. Introducing two coefficients c1 and c2 leads to:
![]() (3)
(3)
where c1=![]() and
and ![]() . The expression for
. The expression for ![]() is expressed by c1 and c2:
is expressed by c1 and c2:
![]() (4)
(4)
In Eq. (2), the original point is set at the ASB center O. For a flow line in the ASB, the determination of the ASB center is not easy. Therefore, a coordinate transformation is necessary. The coordinate axis y is moved to axis y1 and the coordinate axis sp(y) is moved to ![]() . Thus, the new original point is O�� (Fig. 2). In the point O��, the local plastic shear deformation
. Thus, the new original point is O�� (Fig. 2). In the point O��, the local plastic shear deformation ![]() is zero and local plastic shear deformations of other points are the relative values to the point O��.
is zero and local plastic shear deformations of other points are the relative values to the point O��.
Apparently, the coordinates y, y1, ![]() and
and ![]() have the following relations:
have the following relations:
![]() (5)
(5)
![]() (6)
(6)
After substituting Eqs. (3) and (5) into Eq. (6), the expression for ![]() is
is
![]() (7)
(7)
2.2 Curve-fitting of experimental data based on theoretical expression
The two coefficients c1 and c2 in Eq. (7) can be obtained by the curve-fitting least squares method. The value of the length parameter l needs to be determined by the total thickness w of the ASB. Obtaining optimal c1 and c2 is the aim of the curve-fitting least squares method. They make the sum of the difference squared between the experimental data (![]() ,
,![]() ) and theoretical results minimum:
) and theoretical results minimum:
![]() (8)
(8)
where i=1, 2, ��, N, and N is the number of data.
2.3 Central region thickness w5% of ASB
In the ASB, the temperature is nonuniform, as shown in Fig. 3. WANG [8] introduced an assumption in the determination of the central region thickness w5% of the ASB. It is similar to the viewpoint proposed by BATRA and KIM [9]. Using the GDP and JOHNSON-COOK model, the width w5% for Ti-6Al-4V was calculated and the strain rate effect was studied. The deduced width w5% was [8]
 (9)
(9)
where �� is the shear stress acting on the ASB (Fig. 2); T0 is the ambient temperature or initial temperature (Fig. 3); �� is the work to heat conversion factor; cp is the heat
capacity; and �� is the density. In Fig. 3, T1 is ![]() ;
;
T(y) is the temperature distribution in the ASB; and T(0) is peak temperature.��.
In the JOHNSON-COOK model, the shear stress �� and temperature T were expressed as [8, 10-11, 13]
 (10)
(10)
![]() (11)
(11)
where A is the initial static yield stress; B is the strain-hardening coefficient; C is the strain-rate parameter; m is the thermal-softening parameter; n is the strain-hardening exponent; Tm is the melting temperature; ��0 is the reference shear strain rate; and �� is the exerted shear strain rate.

Fig. 3 Temperature distribution in ASB and definition of ASB width w5%
3 Results and discussion
3.1 Curve-fitting of experimental flow line data
The process of initiation and formation of ASBs in Ti-6Al-4V alloy was investigated in dynamic torsional experiments with strain rate of about 103 s-1 at room temperature [3]. In these tests, thin-wall tubular specimens were deformed dynamically in a torsional Kolsky bar and high-speed photography was used. For the specimen TA-43, six high-speed photographs of the grid pattern were taken during the formation of an ASB [3]. In these photographs, some curved flow lines can be found. These lines are oriented parallel to the axis of specimen before experiment. Some flow lines are bold and clear. The fitted data are taken in a bold flow line in Fig. 1(a). The flow line has been pained white. In the white line, a total of 41 data from left to right is selected. The horizontal distance between two adjacent data points is 0.05 mm.
Firstly, all of 41 data are fitted by use of Eqs. (7)-(8). The first data point is selected as the original point O��. Thus, the total thickness of the ASB is assigned to be 2 mm. Then, a part of data, i.e., 39, 37, 35, 33, 31, 29, 27 and 25, are selected and fitted, respectively. When 39 is selected, the first and last data are omitted. When 37 is selected, the former two and last two data are omitted, and so on.
The total thickness w of the ASB can be calculated by the number N of data:
![]() (12)
(12)
A total of nine times curve-fitting is conducted in the work. Only the six times results are plotted in Fig. 4. Figure 4 shows that the agreement between the experimental data and theoretical results is very good at different N. It is found that the theoretical expression for the local plastic shear deformation distribution in the ASB can well describe the nonlinear characteristics of the flow line. When the total thickness is assigned to be a higher value, the flow line in the ASB is more curved at the two ends of the band, while when the total thickness is assigned to be a lower value the flow line is straighter.
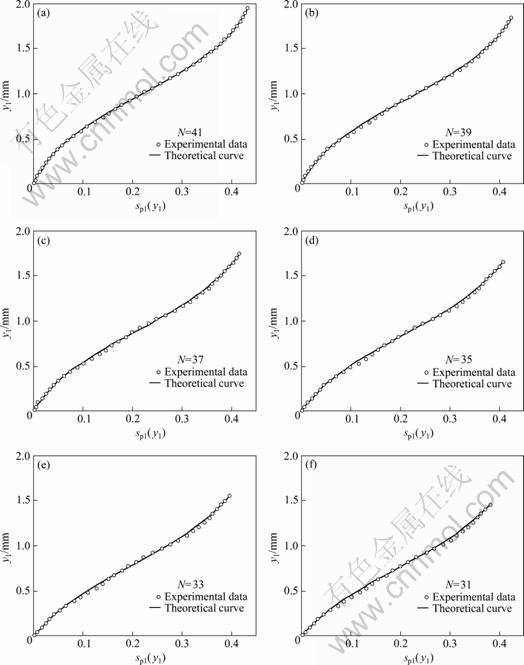
Fig. 4 Comparisons of experimental data [3] and theoretical results for local deformation distribution in ASB at different number
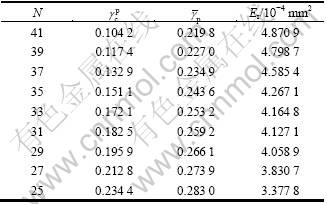
Table 1 shows the obtained ![]() ,
, ![]() and residual errors Er by curve-fitting. It can be found that
and residual errors Er by curve-fitting. It can be found that ![]() and Er become high as N is low.
and Er become high as N is low.
3.2 Back-calculation of parameters in JOHNSON- COOK
The JOHNSON-COOK model needs some parameters, such as A, B, C, m and n. Different sets of parameters predict different ![]() and the maximum shear stress (��max). Possibly, several sets of parameters predict the same
and the maximum shear stress (��max). Possibly, several sets of parameters predict the same ![]() and ��max. Herein, m,
and ��max. Herein, m, ![]() ,
, ![]() , T0, Tm, ��, �� and cp are assumed to be constants, i.e., m=0.5, Tm=1 932 K, ��=4 430 kg/m3, T0=300 K,
, T0, Tm, ��, �� and cp are assumed to be constants, i.e., m=0.5, Tm=1 932 K, ��=4 430 kg/m3, T0=300 K, ![]() =10-5 s-1, cp=564 J/(kg��K),
=10-5 s-1, cp=564 J/(kg��K), ![]() =1 100 s-1 and ��=0.9 [6]. For the given
=1 100 s-1 and ��=0.9 [6]. For the given ![]() and ��max, only four parameters (A, B, C and n) will be back-calculated.
and ��max, only four parameters (A, B, C and n) will be back-calculated.
The back-calculation process is briefly introduced as follows. The searching aims (i.e., the values of ![]() and ��max) are given and the possible variation range of each parameter (A, B, C and n) is set. A special set of parameters will be selected by which the calculated new values of
and ��max) are given and the possible variation range of each parameter (A, B, C and n) is set. A special set of parameters will be selected by which the calculated new values of ![]() and ��max using the JOHNSON-COOK model are the closest to the initially given values. The special set of parameters is the set of back-calculated parameters in the JOHNSON-COOK model.
and ��max using the JOHNSON-COOK model are the closest to the initially given values. The special set of parameters is the set of back-calculated parameters in the JOHNSON-COOK model.
Table 1 Critical plastic shear strains, average plastic shear strains and residual errors obtained by curve-fitting at different number
The value of ��max has been determined as 729 MPa that corresponds to the nominal shear strain of 12% according to Fig. 1(b). It is found that for the aims of ![]() =0.1 and ��max=729 MPa, the back-calculated parameters are A=473.4 MPa, B=482.4 MPa, C=0.003 5 and n=0.198 (the 1st set of parameters); for the aims of
=0.1 and ��max=729 MPa, the back-calculated parameters are A=473.4 MPa, B=482.4 MPa, C=0.003 5 and n=0.198 (the 1st set of parameters); for the aims of ![]() =0.12 and ��max=729 MPa, the back-calculated parameters are A=447.1 MPa, B=482.4 MPa, C=0.005 5 and n=0.2 (the 2nd set of parameters); and for the aims of
=0.12 and ��max=729 MPa, the back-calculated parameters are A=447.1 MPa, B=482.4 MPa, C=0.005 5 and n=0.2 (the 2nd set of parameters); and for the aims of ![]() =0.14 and ��max=729 MPa, the back-calculated parameters are A=420.8 MPa, B=536 MPa, C=0.004 2 and n=0.19 (the 3rd set of parameters). The predicted values of ��max are 730.26 MPa, 729.9 MPa and 728.86 MPa, respectively, which are close to the aim value of 729 MPa using three sets of parameters.
=0.14 and ��max=729 MPa, the back-calculated parameters are A=420.8 MPa, B=536 MPa, C=0.004 2 and n=0.19 (the 3rd set of parameters). The predicted values of ��max are 730.26 MPa, 729.9 MPa and 728.86 MPa, respectively, which are close to the aim value of 729 MPa using three sets of parameters.
Figure 5 shows the three shear stress��average plastic shear strain curves with three sets of parameters. The results are almost identical. Only minor difference exists. At pre-peak, the highest shear stress is expected using the first set of parameters, while at post-peak this set of parameters obtains the lowest shear stress.

Fig. 5 Comparisons of three shear stress��average plastic shear strain curves obtained by three sets of parameters
3.3 Parametric study of ASB width w5%
Herein, only the effects of 10 parameters on the ASB width w5% are investigated with N=41 (i.e., w = 2 mm). The back-calculated parameters (A=473.4 MPa, B= 482.4 MPa, C= 0.003 5 and n=0.198) when ![]() =0.1 will be used and the parameters (m=0.5, Tm=1 932 K, ��=4 430 kg/m3, T0=300 K,
=0.1 will be used and the parameters (m=0.5, Tm=1 932 K, ��=4 430 kg/m3, T0=300 K, ![]() =10-5 s-1, cp=564 J/(kg��K),
=10-5 s-1, cp=564 J/(kg��K), ![]() =1 100 s-1 and ��=0.9) [6] which are seen as constants in the back-calculation process will also be used. When the effect of a parameter is studied, the other parameters are equal to the values given above.
=1 100 s-1 and ��=0.9) [6] which are seen as constants in the back-calculation process will also be used. When the effect of a parameter is studied, the other parameters are equal to the values given above.
Figure 6 shows the influence of 10 parameters on the ASB width w5%. It can be found that these calculated results can be classified into three categories.
For the first category, the markers with a circle are always above the other two makers at the same average plastic shear strain (Figs. 6(a), (c) and (j)). These results show that the width w5% increases or adiabatic shear sensitivity decreases as A, �� and C decrease.
The second category that is opposite to the first category, shows that the markers with a circle are always below the other two makers at the same average plastic shear strain (Figs. 6(d), (f), (h) and (i)). These results suggest that adiabatic shear sensitivity increases as ��, cp, T0 and n decrease.
For the third category, the markers with a circle are at left side of the other two markers at very low ![]() (Figs. 6(b), (e) and (g)). When
(Figs. 6(b), (e) and (g)). When ![]() reaches a certain value, three kinds of markers are very close. Even, the markers with a circle are above the other two markers at very high
reaches a certain value, three kinds of markers are very close. Even, the markers with a circle are above the other two markers at very high ![]() . This suggests that the adiabatic shear sensitivity increases as B, m and Tm decrease at low
. This suggests that the adiabatic shear sensitivity increases as B, m and Tm decrease at low ![]() ; and that at high
; and that at high ![]() the adiabatic shear sensitivity is nearly independent of the three parameters. Seemingly, the effects of B, m and Tm on the adiabatic shear sensitivity depend on the value of
the adiabatic shear sensitivity is nearly independent of the three parameters. Seemingly, the effects of B, m and Tm on the adiabatic shear sensitivity depend on the value of ![]() . However, the effects of A, ��, C, ��, cp, T0 and n on the adiabatic shear sensitivity are strictly monotonic.
. However, the effects of A, ��, C, ��, cp, T0 and n on the adiabatic shear sensitivity are strictly monotonic.
Figure 6(f) predicts that the adiabatic shear sensitivity increases as the ambient temperature decreases, which is consistent with the experimental results [1, 4]. Figure 6 shows that w5% tends to be a constant value as ![]() exceeds a certain value. The reason for the stable ASB width w5% is possibly due to the stable temperature distribution profile in the ASB in its later deformational stage. The stable temperature distribution profile in the ASB stems from little plastic work done by the flow shear stress acting on the ASB. The present analysis is carried out in the adiabatic condition and the assumption that plastic work rate and heat conduction reach equilibrium is not necessary in obtaining a stable ASB width. In the adiabatic condition, the model proposed by DODD and BAI [5] cannot be applied. In addition, the assumed equilibrium condition is satisfied difficultly at high strain rates. The model proposed by DODD and BAI [5] only can predict the stable ASB width, while the present model proposed can predict the overall evolution process that an ASB becomes thin until a stable value is reached.
exceeds a certain value. The reason for the stable ASB width w5% is possibly due to the stable temperature distribution profile in the ASB in its later deformational stage. The stable temperature distribution profile in the ASB stems from little plastic work done by the flow shear stress acting on the ASB. The present analysis is carried out in the adiabatic condition and the assumption that plastic work rate and heat conduction reach equilibrium is not necessary in obtaining a stable ASB width. In the adiabatic condition, the model proposed by DODD and BAI [5] cannot be applied. In addition, the assumed equilibrium condition is satisfied difficultly at high strain rates. The model proposed by DODD and BAI [5] only can predict the stable ASB width, while the present model proposed can predict the overall evolution process that an ASB becomes thin until a stable value is reached.

Fig. 6 ASB width evolution with average plastic shear strain at different parameters
4 Conclusions
1) To assess the critical plastic shear strain corresponding to the onset of the ASB for Ti-6Al-4V, the experimental data for a flow line in the ASB obtained by LIAO and DUFFY are fitted by use of the curve-fitting least squares method and the theoretical expression for the local plastic shear strain distribution proposed by WANG. It is found that the proposed expression well describes the non-linear deformation characteristics of the flow line in the ASB.
2) Some parameters in the JOHNSON-COOK model are back-calculated at different critical plastic shear strains. The influence of 10 parameters on the adiabatic shear sensitivity is studied. The present model can predict the ASB width evolution process. The predicted ASB width decreases with straining until a stable value is reached. The famous model proposed by DODD and BAI only can predict a final stable value.
References
[1] LI Xin, LU Shi-qiang, WANG Ke-lu, DING Lin-hai, LI Zhen-xi, CAO Chun-xiao. Hot deformation behavior of TC11 alloy with thick lamellar microstructure in two phase field based on murty criterion [J]. The Chinese Journal of Nonferrous Metals, 2008, 18(8): 1407-1413. (in Chinese)
[2] YANG Yang, ZENG Yi, WANG Bing-feng. Dynamic constitutive relationship of TC16 titanium alloy based on JOHNSON-COOK model [J]. The Chinese Journal of Nonferrous Metals, 2008, 18(3): 505-510. (in Chinese)
[3] LIAO S C, DUFFY J. Adiabatic shear bands in a Ti-6Al-4V titanium alloy [J]. Journal of the Mechanics and Physics of Solids, 1998, 46(11): 2201-2231.
[4] SESHACHARYULU T, MEDEIROS S C, FRAZIER W G, PRASAD Y V R K. Hot working of commercial Ti-6Al-4V with an equiaxed ��/�� microstructure: Materials modeling considerations [J]. Materials Science and Engineering A, 2000, 284(1-2): 184-194.
[5] DODD B, BAI Y. Width of adiabatic shear bands [J]. Materials Science and Technology, 1985, 1(1): 38-40.
[6] KLEPACZKO J R, REZAIG B. A numerical study of adiabatic shear banding in mild steel by dislocation mechanics based constitutive relations [J]. Mechanics of Materials, 1996, 24(2): 125-139.
[7] WEERASOORIYA T, BEAULIEU P A. Effects of strain rate on the deformation and failure behavior of 93wt.%W-5wt.%Ni-2wt.%Fe under shear loading [J]. Materials Science and Engineering A, 1993, 172(1-2): 71-78.
[8] WANG Xue-bin. Theoretical analysis of the adiabatic shear band width and strain rate effect of Ti-6Al-4V[J]. Rare Metal Materials and Engineering, 2009, 38(2): 214-218. (in Chinese)
[9] BATRA R C, KIM C H. Effect of thermal conductivity on the initiation, growth and bandwidth of adiabatic shear bands [J]. International Journal of Engineering Science, 1991, 29(8): 949-960.
[10] WANG Xue-bin. Temperature distribution in adiabatic shear band for ductile metal based on JOHNSON-COOK and gradient plasticity models [J]. Transactions of Nonferrous Metals Society of China, 2006, 16(2): 333-338.
[11] WANG X B. Effects of temperature and strain rate on the evolution of thickness of transformed adiabatic shear band [J]. Solid State Phenomena, 2008, 138: 385-392.
[12] WANG X B. A new method for calculating the peak temperature evolution in the adiabatic shear band of steel [J]. Journal of Mechanics of Materials and Structures, 2010, 5(1): 95-106.
[13] WANG Xue-bin. A method for calculating damage evolution in adiabatic shear band of titanium alloy [J]. Transactions of Nonferrous Metals Society of China, 2009, 19(5): 1280-1285.
[14] M?HLHAUS H B, VARDOULAKIS I. The thickness of shear bands in granular materials [J]. G��otechnique, 1987, 37(3): 271-283.
[15] de BORST R, M?HLHAUS H B. Gradient-dependent plasticity: Formulation and algorithmic aspects [J]. International Journal for Numerical Methods in Engineering, 1992, 35(3): 521-539.
�����ݶ�������JOHNSON-COOKģ�͵�
���Ծ��ȼ���������
��ѧ��
�������̼�����ѧ ��ѧ�빤��ѧԺ������123000
ժ Ҫ���Ի����ݶ�������������ľ��ȼ��д��ڲ��ľֲ����Լ��б��ηֲ������۱���ʽΪ�������о�10�������Ծ��ȼ��������Ե�Ӱ�졣��LIAO��DUFFY������Ti-6Al-4V���ȼ��д��ڲ���1�����ߵ�ʵ����������С����������ϡ�������ȼ��д�����ȡֵ��ͬʱ���ٽ����Լ���Ӧ�䡣�������ߺܺõط�ӳ�˾��ȼ��д��ڲ����ߵķ����Ա������������ò�ͬ���ٽ����Լ���Ӧ��ֵ������JOHNSON-COOKģ���е�һЩ�������о����֣����ȼ������������ų�ʼ��̬����Ӧ��������ת�����Ӻ�Ӧ���ʲ����Ľ��Ͷ����ͣ������ܶȡ����ݡ������¶ȼ�Ӧ��Ӳ��ָ����Ӱ��պ��෴���������ģ�Ϳ���Ԥ����ȼ��д��Ŀ����ɸ����͵��ݱ���̣�ֱ���ﵽһ���ȶ�ֵ����һ��DODD��BAIģ����������
�ؼ��ʣ����ȼ��д���Ti-6Al-4V��JOHNSON-COOKģ�ͣ����ȣ��ݶ��������ۣ��ֲ����ηֲ�
(Edited by LI Xiang-qun)
Foundation item: Project (20081102) supported by the Doctor Startup Foundation of Liaoning Province, China
Corresponding author: WANG Xue-bin; Tel: +86-418-3350924; E-mail: wxbbb@263.net
DOI: 10.1016/S1003-6326(11)60865-0
