
J. Cent. South Univ. Technol. (2011) 18: 658-665
DOI: 10.1007/s11771-011-0744-0![]()
Numerical simulation of calm water entry of flatted-bottom seafloor mining tool
HU Xiao-zhou(��С��), LIU Shao-jun(���پ�)
School of Mechanical and Electrical Engineering, Central South University, Changsha 410083, China
? Central South University Press and Springer-Verlag Berlin Heidelberg 2011
Abstract:
The hydrodynamic problem of a two-dimensional model of seafloor mining tool entering still water vertically at constant speed was analyzed based on the velocity potential theory. For the assumption that the water entry occurs with very short time interval, the viscosity and gravity of fluid were neglected. Considering the characteristic shape of it, the seafloor mining tool was simplified as a flat-bottom body. The governing equations were the Reynolds time-averaged equations and the k-�� model. Finite element analysis was undertaken using the CFD software, Fluent. The impact pressures on the bottom of the mining tool were computed based on the improved volume of fluid method (VOF). The pressure distribution, the maximum impact pressure, and the impact duration time during the water entry of mining tool are presented at various deploying velocities, the two peak pressures in the impact process are observed, and the relationship between the maximum impact pressure and the deploying velocity is obtained. The results are compared with those based on other prediction theories and methods.
Key words:
water entry; flatted-bottom body; constant speed; deployment��
1 Introduction
At the beginning of deployment of deep sea mining system, the most attractive stage is the slamming and impact of the crawler mining tool on the sea surface. In hostile sea conditions, the significant impact force might cause localized and even catastrophic damage to the classis and track plates of crawler mining tool, and would also affect the deploying cable and flexible riser. The accurate prediction of the pressure distribution and the maximum impact pressure on the mining tool, as well as the corresponding response of the deploying system located on the mining vessel is therefore of significant importance, which is the practical motivation for the theoretical and simulation studies in this work. To simplify the problem, the crawler mining tool is approximated as a flatted bottom body with small dead-rise angles for theoretical analysis and two-dimensional (2D) numerical simulation.
Water entry and flat bottom impact problem have been extensively studied by von KARMAN [1], who was the first person to apply the conservation of momentum and the concept of added mass to consider a horizontal cylindrical body with a wedge-shape under surface as it struck a horizontal surface of water and to calculate the force acting between the body and the water. He considered the interaction between solid and fluid as that between solid and solid, thus the fluid-solid coupling effect was neglected, and this method depended heavily on the precision calculation of added mass which was difficult to obtain because of the change in boundary condition of water surface. However, he presented a useful and initiative method for the problem of water entry, which was the cornerstone of the relevant later works. WAGNER [2] developed the method of von KARMAN by taking into account of the effects of the change in boundary conditions including the calculation of the piled-up water surface and the spray thickness, and employed a flat plate fitting for approximate calculation of added mass. The results showed that the theoretical analysis was more accordant with the reality [2].
For the situation that the dead-rise angle is large, an assumption can be made that the body impacts water in vacuum, thus the effect of air is neglected, and the results based on this assumption is excellent. However, for small dead-rise angle and flatted-plate body, theoretical calculation based on this assumption would give singular values. von KARMAN had discussed the situation that dead-rise angle was zero, and he believed the reason was that the compressibility of water was not considered. However, because the compressibility of water is very small, it is reasonable to consider water as incompressible fluid. Actually, the main reason of singular value is the effect of air, the compressibility of which is large.
The water entry process of flat plate involves the interaction among air, water and solid body, and the compressible flow of air and nonlinear variation of free surface are considerably complicated. In the water entry process, the coupling effect between flat plate and gas flow field, as well as that between gas flow field and fluid flow field is expressed by the dynamic change of boundaries and pressure transmission. The air between flat plate and water surface is not in one phase state, owing to the impact of the water entry process. Some water particles break away from the water surface and mix with air, forming air-water mixture which is called air cushioning. The state and flow pattern of air cushioning are unstable, and the ratio of air to water is constantly changed, thus it is difficult to describe the air cushioning phenomenon employing an accurate theoretical model.
CHUANG [3] performed drop tests in still basins of water, and firstly discovered the air cushioning effect of the trapped layer of air between the model and the water surface. A rational theoretical approach to the problem was also proposed in Ref.[4].
Based on experiments, YAMAMOTO et al [5] modified the VERHAGEN��s methods, and an assumption was made that the pressure in side of body was much higher than atmospheric pressure. Owing to this assumption, the theoretical results were more identical with the experimental results.
With the development of computer hardware and computational fluid dynamics, numerical methods have been extensively used to solve the water entry of a rigid 2D body under fully nonlinear free surface conditions. The main advantage of numerical methods was that there were no restrictions for the body shape and water entry speed. KOROBKIN et al [6], ERMANYUK and OHKUSU [7], OLIVER [8], SUN [9-10], FALTINSEN [11-12] and GRECO et al [13] had developed various methods about water entry and slamming of flat plate and small dead-rise angle bodies, including boundary element method (BEM), finite difference method (FDM) and finite element method etc. More recently, CFD codes were employed by many researchers to discuss the water entry problem, including MSC, DYTRAN, LS-DYNA, Fluent and CFX [14-15].
In this work, the theoretical methods were introduced and the CFD software, Fluent, was employed to simulate the water entry of 2D model of crawler mining tool. The effect of deploying velocity, pressure distribution, peak pressure and duration time of slamming were obtained and analyzed. The relationship between deploying velocity and peak pressure was presented based on the simulation results.
2 Formatting problem
The problem of two-dimensional vertical impact at constant velocity of the seafloor mining tool onto an initially calm sea water surface is considered. The crawler mining tool is approximated as a 2D flatted bottom body. The following hypotheses are made for numerical simulation:
1) The rigidity of the body is large and the impact velocity is small, so the body can be regarded as a rigid body;
2) Sea water is considered to be an incompressible, irrotational and non-viscous fluid;
3) The free surface of the sea water is initially calm.
2.1 Governing equations
A Cartesian coordinate system is chosen such that z=0 corresponds to the calm water level and z is positive upwards. For an ideal fluid, the fluid velocity can be described by the gradient of velocity potential, f, and then the governing equation of the velocity potential in the fluid domain is given by
![]() (1)
(1)
The continuity equation and the momentum equation for thee-dimensional flows are given by
![]() (i=1, 2, 3) (2)
(i=1, 2, 3) (2)
![]()
(i=1, 2, 3) (3)
where ui is the i-th component of the velocity vector; �� is the density of fluid; p is the pressure; �� is the dynamic viscous coefficient; fi is the mass force.
2.2 Boundary conditions
2.2.1 Free surface boundary conditions
Fully nonlinear dynamic free surface condition can be written as
![]() (4)
(4)
where pa is the pressure on the free surface.
The kinematic free surface condition can be written as
![]() (5)
(5)
Both dynamic and kinematic free surface boundary conditions are satisfied on the exact free surface.
2.2.2 Rigid boundary conditions
No normal-flux condition is applied on bottom, and at the vertical wall of fluid field, there is
![]() (6)
(6)
2.2.3 Body boundary conditions
The body boundary condition is written as
![]() (7)
(7)
where v is the body velocity with respect to gravity center and n is the surface normal vector of body.
3 Simulation by Fluent
The two-dimensional crawler mining tool is simplified as a rectangle with 10 m in length and 3 m in height, and flow field is supposed to be a rectangle with 100 m in length and 30 m in height. Supposing that the water depth is 20 m, at the beginning of deployment, the distance between the mining tool and the water free surface is 2 m. The numerical grid exported by Gambit is shown in Fig.1. For better presentation of actual flow field, the grid surrounding the moving mining tool and free water surface is refined.
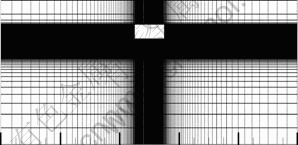
Fig.1 General diagram of mesh
3.1 Time step size and grid refinement
In order to determine the influence of time step size and grid spacing on the predicted impact pressure, two cases are employed to perform numerical simulation using three different time increments and two different grid sizes. The information of the two cases is shown as follows.
Case 1: The total number of grids is 15 730 and the minimum length of grid is 0.2 m.
Case 2: The total number of grids is 33 340 and the minimum length of grid is 0.1 m.
According to related theory and previous research, the time step size can be given by
��t��0.01T (8)
And the characteristic time T can be obtained by
T=lmin/vmax (9)
where lmin is the length of minimum grid, and vmax is the maximum velocity of moving body in flow field.
Supposing that the mining tool moves vertically downward at a prescribed constant velocity of 1 m/s, thus T=0.2 s for Case 1 and T =0.1 s for Case 2 are obtained.
Figure 2 shows the two-dimensional simulation results for Case 2 with three different time increments of ��t=0.01T, 0.005T, 0.001T. It is seen that the predicted pressure histories and the maximum impact pressures are nearly identical for all three time increments, but the calculation time is the most for ��t=0.000 1T, and is ten times and five times that for ��t=0.000 1T and ��t=0.000 5T, respectively. Therefore, to ensure the accurate resolution of the short duration impact pressure forces and save the calculation time, all 2D and 3D simulations are performed using ��t=0.01T.
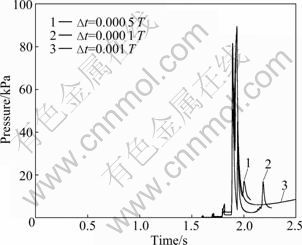
Fig.2 Two-dimensional simulation results for Case 2
A grid refinement study is also performed by comparing results obtained from Case 1 and Case 2, as shown in Fig.3. The time step size ��t= 0.01T is applied and the impact velocity is 1 m/s. It is quite clear that the coarse and fine grid simulations predict about the same level of impact pressures. For Case 1, the maximum impact pressure is 89 563 Pa, and for Case 2 it is 89 346 Pa. However, the curve tendency of two cases has a little difference. On one hand, the obvious difference is the impact time. It is 1.85 s for Case 1 and 1.95 s for Case 2. However, theoretically, the impact time is 2 s. The main reason is as follows. In simulation employing VOF of Fluent, the interface between air and water is not just a line, but an air-water mixture layer with a certain thickness which is determined by the grid refinement of interface zone. Therefore, the thickness of so-called air-water mixture layer of Case 1 is larger than that of Case 2. On the other hand, there are obviously two peak pressures on the curve of Case 2. That is to say, when the coarse grid is employed, some important characteristics may be neglected. Therefore, for the optimal usage of the available computer resource and at the same time obtaining precise simulation results, all 2D and 3D simulations are performed using the grid refinement of Case 2.
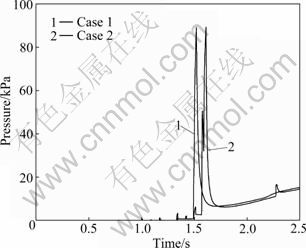
Fig.3 Grid refinement result
3.2 Maximum pressures on bottom of body
There have been many researches concerning the impact pressure of water entry of flatted bottom bodies. Three researches are mainly discussed and compared.
3.2.1 Acoustic theory
Based on several hypotheses, the peak pressure drawn from acoustic theory can be given by
pmax��109 540v1.1 (10)
3.2.2 Experimental results of CHUANG
According to experiments conducted by CHUANG, the maximum impact pressure is approximately proportional to the square of the impact velocity:
pmax��50 470v2 (11)
3.2.3 CHEN��s equation
CHEN and XIAO [14] obtained an empirical equation from simulations, and the pink pressure pmax can be given by
pmax=ka?��w?v2 (12)
The influence factor ka can be calculated by
 (13)
(13)
3.2.4 Simulation results based on Fluent
In this work, CFD code, Fluent, is employed to simulate the water entry process of seafloor mining tool, the motion of which is defined by the UDF (user-defined function) of Fluent.
The pressure histories of bottom of mining tool with different deploying velocities are shown in Fig.4. A similar characteristic from Figs.4(a) and (b) is that a less impact pressure appears before the maximum impact pressure comes out, and this pressure is called the first peak pressure. Just as mentioned by CHUANG, the reason is that during the rigid-body impact, the first positive peak of the impact pressure occurs at the instant when the air is trapped momentarily between the falling body and the fluid, and the air cushioning effect reducing the peak pressure occurs.
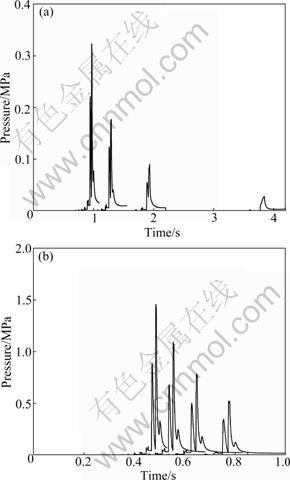
Fig.4 Pressure histories of bottom of 2D mining tool: (a) v= 0.5-2 m/s; (b) v=2.5-4 m/s
After the first peak pressure, owing to the effect of deploying equipment, the mining tool still keeps moving in constant velocity equal to that before water entry. At the same time, the air cushion breaks into some air bubbles, eventually escapes from the place between the water surface and the bottom of mining tool. After the air cushioning effect disappears, the impact pressure increases once again, and the second peak pressure is obviously larger than the first one.
As shown in Fig.5, the second pressure is obviously much larger than the first peak pressure, and with impact velocity increasing, the difference between the first peak pressure and the second peak pressure is also increased.
Figure 6 shows the impact time of the first peak pressure and the second peak pressure with different impact velocities. There is only a little difference between the two curves, and the difference does not change with velocity.
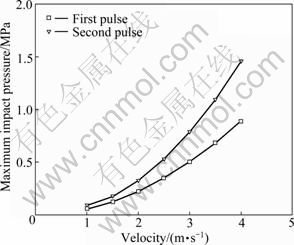
Fig.5 First peak and second peak pressures on bottom
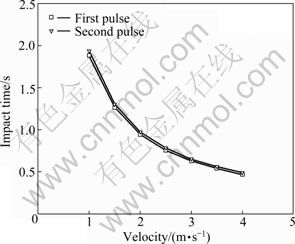
Fig.6 Impact time at different impact velocities
Figure 7 shows the comparison between the results obtained by simulation and three other methods. It is obvious that the simulation results show a good agreement with the experimental data of CHUANG and the empirical equation of CHEN.
When v��2.5 m/s, the maximum impact pressures of the four methods are almost identical. However, when v> 2.5 m/s, the curve of acoustic theory results ascends most slowly, partly because a series of hypothesis is not proper for larger velocity. Except the curve of acoustic theory, the other three ones are similar. From Figs.4(a) and (b), the second peak pressure can also be observed; however, this pressure is not mentioned in the other methods. As mentioned above, the reason is that the velocity of mining tool is constant during the impact process in this simulation, while for the other three methods, after the impact has occurred, the velocity of moving bodies is not constant but determined by the impact pressure.
3.2.5 Curve fitting of simulation results
According to experiments and theory, generally, the relationship between the maximum impact pressure pmax and impact velocity v can be written as
pmax=k��wv2 (14)
where ��w is the water density, and k is the coefficient which has a relationship with velocity.
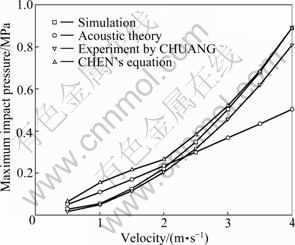
Fig.7 Comparisons maximum impact pressure
Regression analysis is employed to obtain the coefficient k based on the simulation results. At the water entry instant, both the velocity and water density can be supposed to be constant, thus Eq.(14) can be transformed into
![]() (15)
(15)
Curve fitting of MATLAB software is used to obtain the relationship equation between k and water entry velocity. Thus, for the first peak pressure, there is
![]()
55.930 9 (16)
For the second peak pressure, there is
![]()
202.167 5v+199.862 (17)
The regression curves of the first peak pressure and the second peak pressure are shown in Figs.8(a) and (b), respectively.
3.3 Impact pressure distribution
Figure 9(a) shows the impact pressure distribution of the first peak pressure. The impact pressure at the center of the flat-bottom of mining tool model is somewhat larger than that near the center of the model. This is because the trapped air acts as a cushioning medium and causes the impact load to be distributed more evenly over the entire area of the flat bottom. Two points attract attention in Fig.9(a). From the two points, the impact pressure descends rapidly, and at the two edges of the flat-bottom, the impact pressure is relatively smaller. Figure 9(b) shows the impact pressure distribution of the second peak pressure. Because of the disappearance of air cushion, the pressure distribution is not even, and the pressure at the center of bottom is much larger than that at other positions.
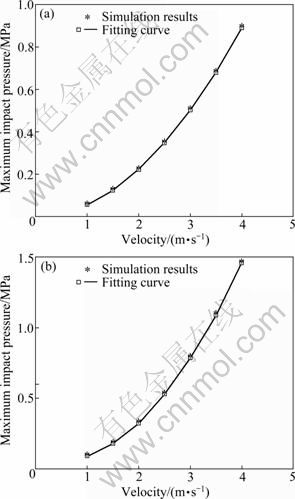
Fig.8 Fitting curves of first (a) and second (b) peak pressure
The total pressure can be calculated for 2D model by the following equation:
![]() (18)
(18)
where l is the length of bottom of mining tool. The total pressures for the first and the second pulses are about 2.1��107 N and 1.6��107 N, respectively, at v=2 m/s. Thus, it is evident that although the first peak pressure is smaller than the second peak pressure, the total pressure is just contrary.
3.4 Maximum velocity in flow field
During the impact process of water entry of body, the maximum velocity in the whole flow field is neglected early. Fluent can clearly reflect the velocity changing in the flow field. It can be observed that in the impact process, the maximum velocity in the flow field is just the velocity of air trapped between the bottom of body and the water free surface.
The relationship between the impact velocity and the maximum velocity in the flow field is shown in Fig.10. The curve is linear with a slope of 51.5. Figure 11 shows the maximum velocity with v=4 m/s.
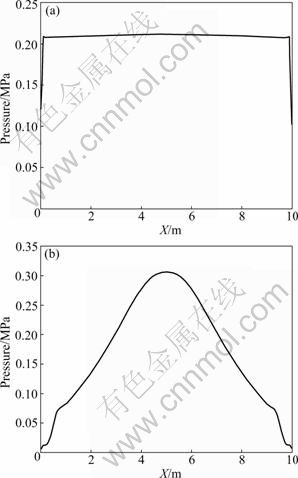
Fig.9 Impact pressure distributions on bottom: (a) First peak pressure (v=2 m/s); (b) Second peak pressure (v=2 m/s)
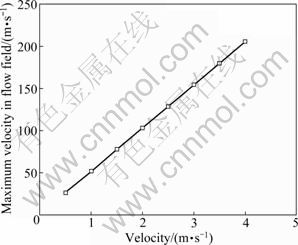
Fig.10 Relationship between maximum velocity and impact velocity in flow field
3.5 Duration time of impact
When the air between the moving body and the water surface is compressed remarkably, the pressure on the flatted bottom of body correspondently ascends rapidly, and this moment is defined as the beginning of water entry. However, at this time, the body does not really impact with water. After the initial instant, the body continues to move down, and the compressed air begins to escape to two sides of the body. The escaping velocity is increased rapidly when the maximum velocity comes out, and the first peak pressure appears. Then, the compressed air continues to escape until the moving body impacts with water, and the second peak pressure appears. After the second peak pressure, the pressure on the flatted-bottom recovers to the normal state.
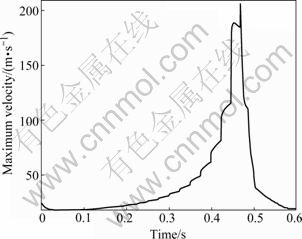
Fig.11 Maximum velocity in flow field (v=4 m/s)
The related information about the impact duration time is shown in Figs.12 and 13. T1 is the duration time of the first peak pressure, T2 is the duration time of the second peak pressure, T3 is the time gap between the first and the second peak pressure, and T4 is the total impact duration time. According to Figs.12 and 13, it can be seen that for both the first and the second peak pressures, the duration time varies inversely with the impact velocity. When the velocity is smaller than 2.5 m/s, the duration time of the first peak pressure is larger than that of the second peak pressure; when the velocity is larger than 2.5 m/s, the case is reversed. The curve of T2 is much steeper than that of T1.
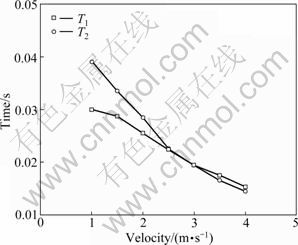
Fig.12 Impact duration time of T1 and T2
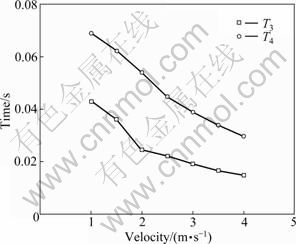
Fig.13 Impact duration time of T3 and T4
3.6 Impact pressure and duration time
According to the simulation results, during the impact, the relationship between the impact pressure and the duration time can be expressed by the following equations.
For the first peak pressure, there is
![]()
![]() (19)
(19)
For the second peak pressure, there is
![]()
![]() (20)
(20)
where pmax1 and pmax2 are the first peak pressure and the second peak pressure. T1 and T2 are the duration times of the first peak pressure and the second peak pressure. t1 and t2 are the starting times of the first peak pressure and the second peak pressure. Figure 14 shows the comparison between fitting curves and simulation curve at v=2 m/s.
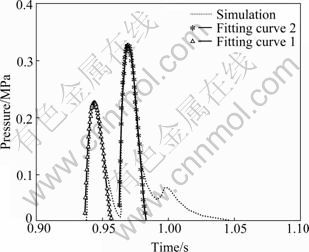
Fig.14 Comparison between fitting curves and simulation curve at v=2 m/s
According to the flat plate body water entry experiments, if the half width of the flat plate is L=5 m, the time that impact pressure reaches the maximum value requires 10/Cair, thus the duration time of impact pressure can be given:
T=20/Cair (21)
The speed of sound in air cushioning Cair can be calculated by
![]() (22)
(22)
where pa is the atmospheric pressure, p is the pressure in air cushioning, Ca is the speed of sound in the atmosphere at pa, and �� is the ratio of the specific heat at constant pressure to that at constant volume. Under the normal condition of atmosphere, ��=1.4 is used. Substituting Eqs.(19), (20) and (22) into (21) yields
![]()
![]() (23)
(23)
pmax1, pmax2, T1, T2, t1 and t2 are obtained from the simulation results. The right side of Eq.(23) is compared with the left side, as shown in Fig.15. It can be basically considered that the two sides are equal.
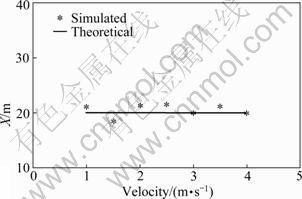
Fig.15 Comparison between simulation results and theoretical results
4 Conclusions
1) Time-domain simulations of calm water entry of seafloor mining tool in constant impact speed are performed using the Navier-Stokes numerical method in conjunction with an interface-capturing VOF method employing the CFD code Fluent.
2) The influence of time increment and grid refinement are studied, then the proper time step size and grid are determined. The impact pressures of bottom at different velocities are obtained, and the results of the present method are validated against the theoretical and published results. Air cushion and splashing are observed, and the effects of them are discussed.
3) The first peak and the second peak pressure are observed, and the reason is analyzed. The duration time of impact and the relationship between impact pressure and duration time are presented, showing good agreement with the theoretical solutions. The pressure distributions on the bottom at different times are also presented.
4) It can be concluded that the numerical simulation by the Fluent can obtain perfect and visual results, and this simulation method is able to predict the impact loads and impact duration time.
References
[1] von KARMAN. The impact of seaplane floats during landing [R]. National Advisory Committee for Aeronautics, TN 321, 1929: 1-8.
[2] WAGNER H. Trans phenomena associated with impacts and sliding on liquid surfaces [J]. Math Mechanics, 1932, 12(4): 193-215.
[3] CHUANG S L. Experiments on flat-bottom slamming [J]. Journal of Ship Research, 1966, 10: 10-17.
[4] Verhagen J H G. The impact of a flat plate on a water surface [J]. Journal of Ship Research, 1967, 12: 211-223.
[5] Yamamoto Y. Structure-fluid interaction problem for a ship among waves [C]// Proceedings of the Fifteenth International Conference of Theoretical and Applied Mechanics. Toronto, 1980: 209-222.
[6] Korobkin A A, Khabakhpasheva T I, WU G X. Coupled hydrodynamic and structural analysis of compressible jet impact onto elastic panels [J]. Journal of Fluids and Structures, 2008, 24: 1021-1041.
[7] Ermanyuk E V, Ohkusu M. Impact of a disk on shallow water [J]. Journal of Fluids and Structures, 2005, 20: 345-357.
[8] OLIVER J M. Second-order Wagner theory for two-dimensional water-entry problems at small dead-rise angles [J]. Journal of Fluid Mechanics, 2007, 572: 59-85.
[9] SUN Hui. A boundary element method applied to strongly nonlinear wave-body interaction problems [D]. Trondheim: Norwegian University of Science and Technology, 2007.
[10] SUN Hui, FALTINSEN O M. Water impact of horizontal circular cylinders and cylindrical shells [J]. Applied Ocean Research, 2006, 28: 299-311.
[11] Faltinsen O M. Water entry of a wedge with finite dead-rise angle [J]. Journal of Ship Research, 2002, 46(1): 39-51.
[12] Faltinsen O M, SEMENOV Y A. Nonlinear problem of ?at-plate entry into an incompressible liquid [J]. Journal of Fluid Mechanics, 2008, 661: 151-173.
[13] Greco M, Colicchio G, Faltinsen O M. Bottom slamming for a very large floating structure: Uncoupled global and slamming analyses [J]. Journal of Fluids and Structures, 2009, 25: 406-419.
[14] CHEN Zhen, XIAO Xi. Analysis about the slamming pressure peak value on a flat-bottom structure [J]. Journal of Shanghai Jiaotong University, 2006, 40(6): 983-987. (in Chinese)
[15] CAO Zheng-lin, WU Wei-guo. 2-D simulation research on the air cushion effect on the slamming pressure peak value of trimaran cross structure [J]. Journal of Ship Mechanics, 2008, 12(2): 237-242. (in Chinese)
(Edited by YANG Bing)
Foundation item: Project(2006AA09Z240) supported by the National High Technology Research and Development Program of China; Project (DYXM 115-04-02-01) supported by the National Deep-Sea Technology Program of Development and Research of the Eleventh Five-year Plan of China
Received date: 2010-05-31; Accepted date: 2010-10-11
Corresponding author: HU Xiao-zhou, PhD; Tel: +86-13755111783; E-mail: smallboathu@163.com
