

J. Cent. South Univ. (2020) 27: 1290-1305
DOI: https://doi.org/10.1007/s11771-020-4367-1

Investigation on seismic response of a three-stage soil slope supported by anchor frame structure
LIN Yu-liang(������)1, 2, 3, LI Ying-xin(��Ӣ��)1, ZHAO Lian-heng(������)1, YANG T Y2, 4
1. School of Civil Engineering, Central South University, Changsha 410075, China;
2. Department of Civil Engineering, the University of British Columbia, Vancouver V6T 1Z4, Canada;
3. Key Laboratory of Engineering Structures of Heavy Haul Railway of Ministry of Education,Central South University, Changsha 410075, China;
4. International Joint Research Laboratory of Earthquake Engineering, Tongji University,Shanghai 200092, China
 Central South University Press and Springer-Verlag GmbH Germany, part of Springer Nature 2020
Abstract:
Based on a typical prototype of a soil slope in engineering practice, a numerical model of a three-stage soil slope supported by the anchor frame structure was established by means of FLAC3D code. The dynamic responses of three-stage soil slope and frame structure were studied by performing a series of bidirectional Wenchuan motions in terms of the failure mode of three-stage structure, the acceleration of soil slope, the displacement of frame structure, and the anchor stress of frame structure. The response accelerations in both horizontal and vertical directions are the most largely amplified at the slope top of each stage subjected to different shaking cases. The platforms among the stages reduce the amplification effect of response acceleration. The residual displacement of frame structure increases significantly as the intensity of shaking case increases. The frame structure at each stage presents a combined displacement mode consisting of a translation and a rotation around the vertex. The anchor stress of frame structure is mainly increased by the first intense pulse of Wenchuan seismic wave, and it is sensitive to the intensity of shaking case. The anchor stress of frame structure at the first stage is the most considerably enlarged by earthquake loading.
Key words:
three-stage soil slope; anchor frame structure; acceleration; displacement; anchor stress��
Cite this article as:
LIN Yu-liang, LI Ying-xin, ZHAO Lian-heng, YANG T Y. Investigation on seismic response of a three-stage soil slope supported by anchor frame structure [J]. Journal of Central South University, 2020, 27(4): 1290-1305.
DOI:https://dx.doi.org/https://doi.org/10.1007/s11771-020-4367-11 Introduction
The tremendous power of large earthquake poses a huge potential threat to the existing slopes and supporting structures. It is widely reported that many previous large earthquakes have induced a large number of landslides and failures of supporting structure that resulted in a long-term traffic interruption [1-4]. Consequently, the seismic stability of slope and supporting structure in high seismic intensity area is increasingly concerned by many researchers in the field of engineering construction [5-7].
The stability of soil slope is influenced by many factors, such as soil strength, slope height and slope configuration. The strength of soil may not ensure the safety of soil slope for many engineering cases [8], and a variety of supporting structures are generally adopted to enhance the stability of soil slope [9-12]. The soil slope and the supporting structure perform as a whole system, and they interact with each other under earthquake loading, which makes it difficult to understand the mechanical behavior of such structure system clearly. The current code mainly adopts a pseudo-static method in seismic design for both the soil slope and the supporting structure, by which the dynamic characteristics of soil slope and supporting structure are neglected [13-17]. Apart from the pseudo-static method, some other methods were also developed to evaluate the dynamic stability of soil slope or supporting structure under some given assumptions, such as strength reduction method [18], pseudo-dynamic analysis method [19-21], energy-based analysis method [22, 23], and sliding analysis method [24, 25]. Meanwhile, the dynamic model test and the dynamic numerical simulation are also widely concerned in recent years for their validity [26-29]. LIN et al [30-34] investigated the response acceleration and response displacement of a frame-supported slope and a combined retaining structure in earthquakes by model test and numerical analysis. YE et al [35] applied a strength reduction analysis method in the numerical simulation based on FLAC3D platform, and studied the seismic stability of a slope by applying different types of shaking case. YAZDANDOUST [36] studied the effect of seismic parameters and reinforcement length on the response of reinforced earth wall regarding the earth pressure behind wall and the stress distribution of reinforcement by using shaking table test. LEE et al [37] investigated the displacement of wall face, the settlement of backfill, the lateral earth pressure behind wall, and the response acceleration of three geosynthetic reinforced soil walls by numerical simulation with a calibration of numerical parameters with laboratory data.
In engineering practice, the high slope is commonly divided into a series of stages with horizontal platforms. The seismic response of a three-stage soil slope supported by the anchor frame structure is not involved in above mentioned research work. The multistage anchor frame structure is widely adopted to stabilize the high- steep slope in engineering practice. However, the seismic performance of such multistage structure is not well understood. In this study, according to a three-stage soil slope supported by the anchor frame structure in Dali-Ruili Class-I Railway, Southwest China, a 3D dynamic numerical model was established by means of FLAC3D code. A series of Wenchuan motion were performed to investigate the element failure mode, the response acceleration, the response displacement, and the response anchor stress. The aim of this study was to provide a basic information for the seismic design regarding the seismic response of the three-stage soil slope and the anchor frame structure.
2 Methodology
2.1 Three-stage structure prototype
Geological investigation showed that a thick overlying soil stratum was laying on a rock mass in a typical cross section of Dali-Ruili Class-I Railway, China. The overlying soil stratum was about 21 m in height, and the interface was approximately an arc surface between the overlying soil stratum and the rock mass. The soil slope would not get a sufficient safety reserve due to an overburden, and particularly it might collapse subjected to earthquake loading. The soil slope was shaped into three stages to improve its mechanical behavior, and each stage was supported by the anchor frame structure, as shown in Figure 1. There were two platforms among these three stages of soil slope, and each platform was 4 m in width. The height of the first stage of soil slope was 9 m, and the height was 6 m for both the second and the third stages. The slope ratio for each stage was 1:0.8. The dimension for each lattice unit of frame structure was 4 m��3 m. A series of anchors with a 30�� inclined angle were set at the intersections of lattice unit to link the frame structure to the rock mass. Several typical measuring points, Points 1-23, were marked along the surface of slope soil, as shown in Figure 1.
2.2 Three-dimensional numerical model
Figure 2 showed a 1:1 numerical model of a three-stage soil slope supported by the anchor frame structure established by using FLAC3D code. The overlying soil stratum was established by using M-C model. The unit weight of overlying soil stratum was 19.8 kN/m3, and the elastic modulus was 78 MPa. The soil cohesion was 19.8 kPa, and its friction angle was 35.0��. The frame structure and the rock were both established by using elastic model with the values of elastic modulus being 24.5 and 30.0 GPa, and 24.5 and 25.0 kN/m3 for unit weight, respectively. Some other parameters for the three-stage soil slope and the anchor frame structure are shown in Table 1.
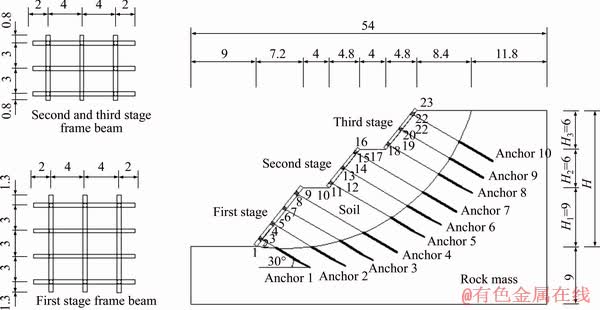
Figure 1 Profile of three-stage slope supported by anchor frame structure and measuring points layout (Unit: m)
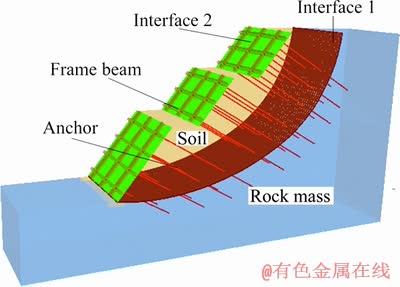
Figure 2 Dynamic numerical model of three-stage slope supported by anchor frame structure
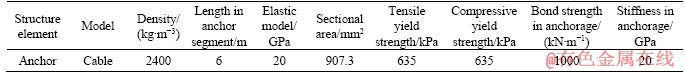
In addition, two interface elements (Interfaces 1 and 2) were modeled at special surfaces among the rock mass, the overlying soil stratum and the frame structure, whose main mechanical parameters are shown in Table 2. Four rows of anchor were set along the soil slope at the first stage, which were marked as Anchors 1, 2, 3 and 4 (see Figure 1). There were three rows of anchor in both the second stage and the third stage of soil slope, and they were named as Anchors 5, 6, 7 in the second stage, and Anchors 8, 9, 10 in the third stage. The anchors in frame structure were simulated by using cable structural element, whose main parameters are given in Table 3. The bonding strength and the friction coefficient between the anchor and the overlying soil stratum were neglected in free segment because the anchor was covered by a tube that would greatly reduce the interaction between the anchor and the overlying soil stratum. Besides, a 50 kPa pretension anchor stress was applied to the anchors according to engineering design and construction situation. During the dynamic numerical analysis, the response acceleration and the response displacement at Points 1-23 were tracked, and the time history of anchor stress for each anchor node was monitored.
2.3 Seismic ground motion
The Wenchuan seismic wave was typical selected to shake the three-stage slope supported by the anchor frame structure. Figure 3 presented the acceleration time history as well as the spectrum curve of original Wenchuan wave. The acceleration time history of Wenchuan wave was a long-lasting motion that was greater than 150 s with two intense pulses. In order to speed up the numerical calculation, the data section of 0-50 s of Wenchuan wave with an inclusion of these two intense pulses was taken in numerical analysis. Since the frequency of Wenchuan wave mainly concentrated on a frequency range of 0-15 Hz, the high- frequency band (more than 15 Hz) was filtered to avoid a negative effect of high-frequency part on the propagation of seismic wave in numerical analysis.
Table 1 Main mechanical parameters for different materials
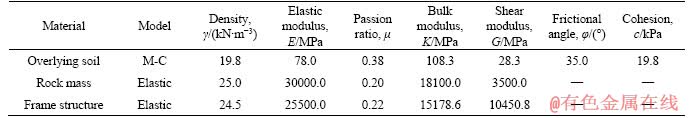
Table 2 Main mechanical parameters for interface elements
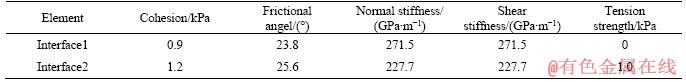
Table 3 Main physical and mechanical parameters of anchor cables
The Wenchuan wave could be applied by means of acceleration time history in FLAC3D software. However, the ending point of the displacement time history curve of original Wenchuan wave might deviate from zero line, which would cause a continuous displacement in numerical model at the end of shaking case. In order to avoid or reduce such deviation, the acceleration time history curve of original Wenchuan wave was calibrated by superimposing a series of low-frequency waveform. Thereafter, the final point of displacement time history curve of adjusted Wenchuan wave would end around the zero line (see Figure 4). Subsequently, the residual deformation of three-stage slope and frame structure subjected to Wenchuan ground motion could be determined based on the offset of the final point in displacement time history curve [38].
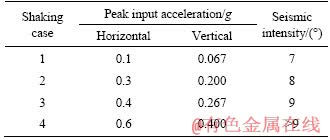
The seismic ground motion was bidirectionally applied at the bottom of numerical model. The relationship between the horizontal acceleration coefficient (kh) and the vertical acceleration coefficient (kv) was expressed as kv=��kh, where �� was a proportional coefficient that ranged from 1/2 to 2/3. In this study, the peak values of horizontal input acceleration in dynamic numerical simulation were scaled to 0.1g, 0.3g, 0.4g and 0.6g, which were marked as shaking cases 1, 2, 3 and 4, respectively, and the proportional coefficient (��) was set as 2/3. The above mentioned four shaking cases corresponded to four seismic intensities of 7��, 8��, 9�� and larger than 9��, respectively, as shown in Table 4. Before applying the seismic ground motion in numerical analysis, the numerical model was equilibrated statically by self-weight, and the displacement and the velocity induced by the self-weight were removed for a better evaluation of seismic loading effect.
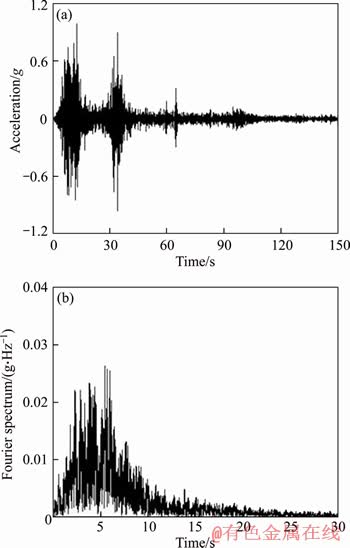
Figure 3 Acceleration time history (a) and Fourier spectrum of Wenchuan ground motion (b)
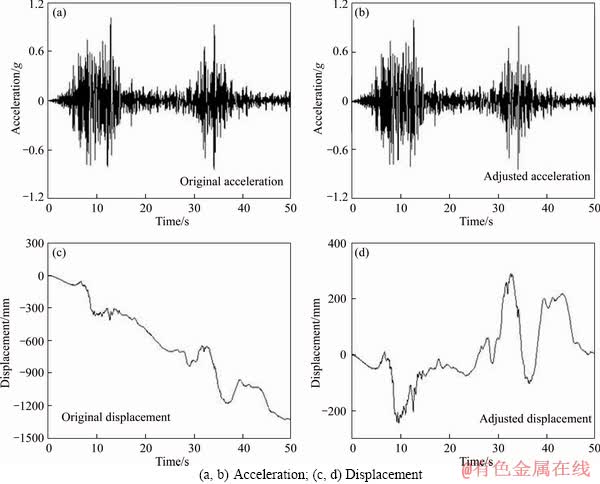
Figure 4 Time history of original Wenchuan ground motion (a, c) and adjusted Wenchuan ground motion (b, d):
Table 4 Shaking cases in dynamic numerical simulation
2.4 Model boundary and damping
The boundary condition is essential for the accuracy of numerical simulation result. In this study, a free field boundary was used to avoid a boundary reflection effect of seismic wave in numerical analysis. The free field, performing like an infinite field, was created along the model border, and it could combine with the main structure mesh. The free field could significantly reduce or even avoid the distortion of seismic wave along the numerical model��s boundary.
In dynamic numerical analysis, the damping setting was crucial to make the dynamic equation achieve a convergent equilibrium. Three types of damping were available in FLAC3D software, namely Rayleigh damping, local damping and hysteresis damping. Generally, a satisfactory numerical result could be acquired by using Rayleigh Damping with regard to the dynamic response of geotechnical structure. However, the Rayleigh Damping would considerably reduce the calculation time step, which might subsequently cause a substantial increase in calculation time of dynamic analysis. The local damping would make the dynamic calculation achieve a convergence by increasing or decreasing the mass of nodes or elements. Meanwhile, the local damping would not decrease the calculation time step. Nevertheless, a high-frequency noise might be generated regarding the response of geotechnical structure by using the local damping if the seismic ground motion comprises some high-frequency components. In this study, the high-frequency band (��15 Hz) of Wenchuan ground motion was filtered out, which well overcame the above drawback of local damping. Consequently, in this study, the dynamic numerical simulation was performed by adopting the local damping with a critical damping ratio (D) of 5%, and the local damping coefficient (��L) was determined as 0.157 by applying the formula of ��L=��D.
3 Results and analysis
3.1 Element failure mode
The element failure mode of the three-stage soil slope and the frame structure is traced in dynamic numerical simulation. Figure 5 presents the element failure mode at different duration by taking Shaking case 4 for a typical study, where, ��Shear�� and ��Tension�� represent a shear failure and a tension failure respectively. ��None�� means that neither a shear failure nor a tensile failure is observed in the element. ��n�� and ��p�� refer to the failure time of element, and they indicate that the element is failing now or it used to fail, respectively. The element failure mode differs at different duration subjected to Shaking case 4. At the beginning of the first 5 s, the top zone of soil slope at each stage has experienced tension failure, and the volume for tension failure is quite close among the different stages. A shear failure mainly occurs at the bottom of soil slope at each stage. After 10 s, most elements of overlying soil stratum have experienced both the shear failure and the tension failure, and some soil elements next to the interface between the rock mass and the overlying soil are experiencing a shear failure once again. After 15 s, the element failure mode for such three-stage structure does not change greatly, and most of soil elements are marked by a shear failure together with a tension failure. The elements of overlying soil stratum near the arc interface of the rock mass and the overlying soil only experience a shear failure without a tension failure. Besides, no failure is observed at the rock mass and the frame structure during the whole process of seismic shaking.
The element failure mode subjected to different shaking cases is shown in Figure 6. Under Shaking case 1, the soil elements at the slope top of the first stage and the second stage mainly experience tension failure. At the slope top of the third stage, no failure is observed around the outer slope surface, and the soil elements close to the arc interface of the overlying soil and the rock mass also experience a tension failure. The soil elements at the lower part of soil slope for each stage experience both the shear failure and the tension failure. Many inner elements of overlying soil stratum are marked with ��None��, indicating a non-failure state. When the horizontal acceleration of shaking case is larger than 0.2g, more and more soil elements along the soil slope have experienced both the shear failure and the tension failure after earthquake shaking. Meanwhile, the volume of overlying soil stratum that experiences both the shear failure and the tension failure increases with an increase in seismic intensity. However, there is no obvious sliding deformation observed in such three-stage structure, which indicates that the anchor frame structure plays an important role in stabilizing the three-stage soil slope subjected to earthquake loading.
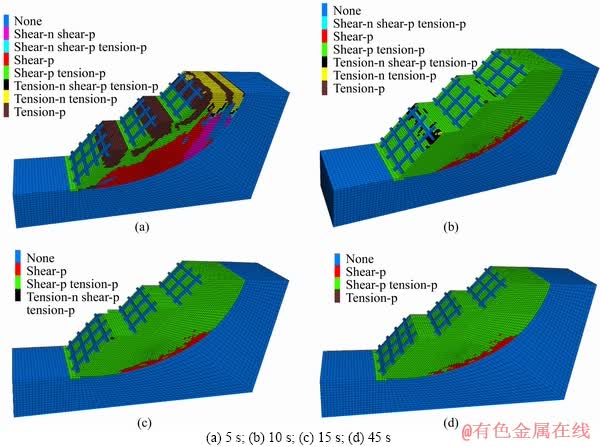
Figure 5 Element state at different moments subjected to Shaking case 4:
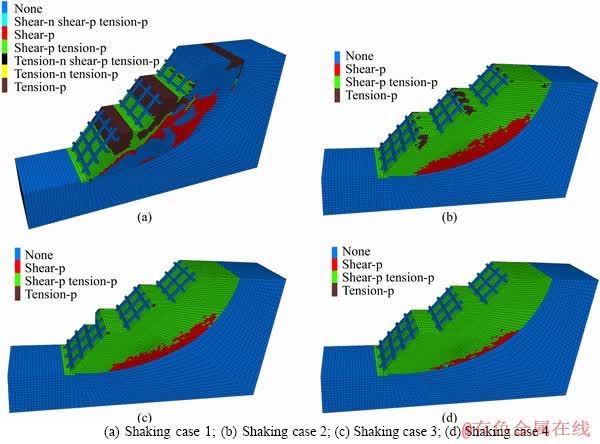
Figure 6 Element state of three-stage structure subjected to different shaking cases:
3.2 Horizontal acceleration response
Figure 7 presents the horizontal acceleration time history curves for typical measuring points along the soil slope surface by taking Shaking case 2 for a typical study. Similar to the original Wenchuan wave, two great pulses were monitored in horizontal acceleration time history curve, and the first one was much more intense than the second one. The horizontal response acceleration is related to the elevation of measuring points. To quantify the amplification effect of response acceleration, the peak response acceleration at measuring points divided by the peak value of input acceleration is taken as an acceleration amplification coefficient, as presented in Figure 8. With an increase in the intensity of shaking case, an increasing tendency is observed for the horizontal acceleration amplification coefficient, which is different from the observation of embankment slope in previous published work [39-41]. For example, the range of horizontal acceleration amplification coefficient of soil slope changes from 1.471-2.150 to 1.643-2.888 when the peak horizontal acceleration of shaking case increases from 0.1 to 0.6g. Generally, the acceleration amplification of soil slope may show a decreasing tendency with an increase in seismic intensity due to an earthquake- induced loosening of soil. However, as for the soil slope supported by the anchor frame structure, the anchor stress of frame structure is significantly enlarged with an increase in seismic intensity (see Section 3.5), that enhances the constraint on the overlying soil stratum and subsequently improves the stiffness of soil mass. Thereafter, the acceleration amplification of soil slope even presents an increasing tendency as the seismic intensity increases.
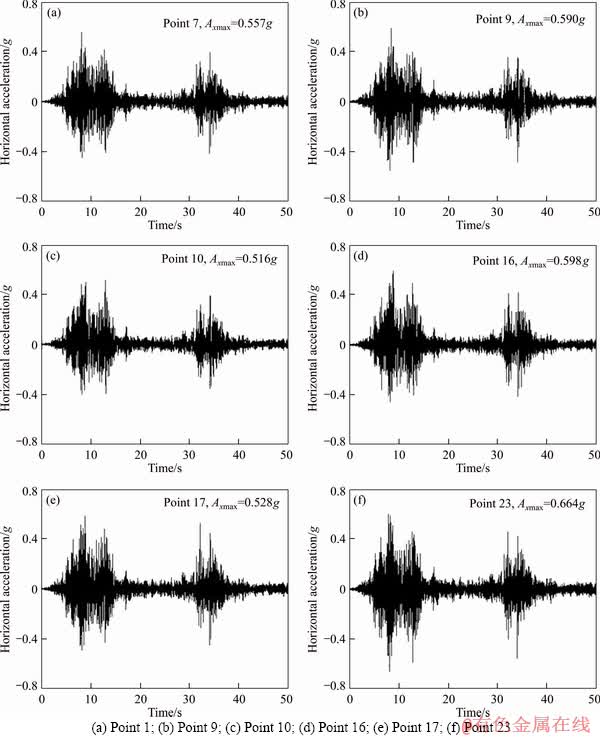
Figure 7 Time history curve of horizontal acceleration response subjected to Shaking case 2 for several points:
Figure 9 shows the relationship of the horizontal acceleration amplification coefficient with the soil slope height subjected to different shaking cases. Along the height of soil slope at each stage, the horizontal acceleration amplification coefficient increases nonlinearly. The horizontal response acceleration is the most considerably enlarged at the slope top of the third stage by earthquake loading. The horizontal acceleration amplification coefficient at the slope toe of the third stage is smaller than that at the second stage due to the existence of the stage platform, even though these two measuring points are at a same elevation. A similar result is also observed between the soil slopes at the first stage and the second stage. For example, the horizontal acceleration amplification coefficient at the slope top of the first stage (Measuring point 9) is about 1.771 under Shaking case 2, which is larger than that at the slope toe of the second stage (i.e., 1.548 at Measuring point 10). The observation is not consistent with the response acceleration of a rigid retaining wall (concrete gravity wall or sheet-pile wall) combined with an upper anchor frame structure in our previous work [31-33, 42], where the response acceleration near the top of rigid retaining wall is not so intense as that near the bottom of upper anchor frame structure in spite of a same elevation for these two positions. It is noted that the anchor frame structure in combined retaining structure is tightly linked to the rock mass by a series of anchors near the bottom of upper anchor frame structure. The local rigid constraint of upper anchor frame on soil mass may be a factor that makes the response acceleration near the platform of such combined retaining structure quite different from that of the three-stage soil slope supported by the anchor frame structure. For a more comprehensive interpretation, a further research work is required regarding this issue. However, based on the observations in the three-stage anchor frame structure, it is recommended to configurate the high slope into several stages with a platform between the adjacent stages to weaken the response acceleration, and subsequently to enhance the overall seismic stability of soil slope.
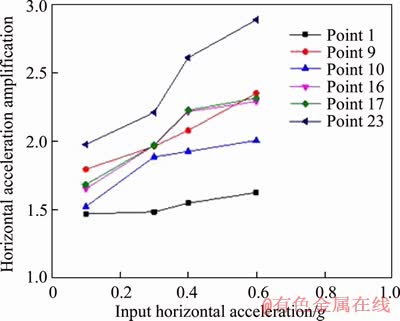
Figure 8 Relationship between horizontal acceleration amplification coefficient and input acceleration
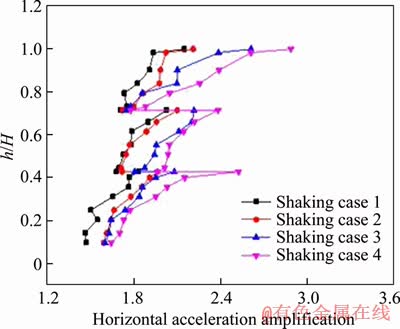
Figure 9 Distribution of horizontal acceleration amplification coefficient along height of soil slope
3.3 Vertical acceleration response
The seismic inertial force in vertical direction is also a crucial factor which may cause a failure of soil slope or retaining structure. Information about the vertical response acceleration of soil slope or retaining structure is indispensable for making a reasonable seismic design. Figure 10 presents the vertical acceleration time history curves for some measuring points of three-stage soil slope by taking Shaking case 3 for a typical study. The intensity of vertical response acceleration varies at the different positions of soil slope. The vertical amplification effect near the slope top for each stage is much more intense than the other points.
The relationship of the vertical acceleration amplification coefficient with the three-stage soil slope height subjected to different shaking cases is shown in Figure 11. Along the relative height of soil slope at each stage, the vertical acceleration amplification coefficient increases nonlinearly. An increasing tendency is also observed for the vertical acceleration amplification coefficient as the intensity of shaking case increases. Generally, the acceleration amplification coefficient in vertical is larger than the one in horizontal. For the adjacent stages, the vertical acceleration amplification coefficient at the slope toe of the upper stage is smaller than that at the slope top of the lower stage, which is similar with the observation for the response acceleration in horizontal. For example, the vertical acceleration amplification coefficient at the slope top of the first stage (Measuring point 9) is 2.597, which is larger than that at the slope toe of the second stage (i.e., 2.093 at Measuring point 10). Consequently, it is inferred that the platforms among the soil slope stages can reduce the amplification effect of response acceleration in both the horizontal and the vertical directions.
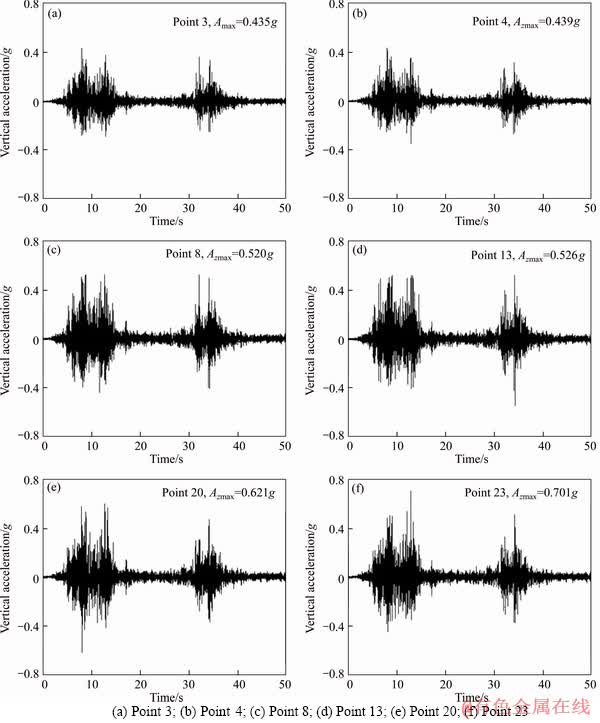
Figure 10 Vertical acceleration time history curve subjected to Shaking case 3 for several points:
3.4 Displacement response
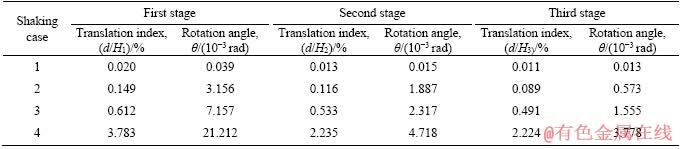
It is essential to ensure that the residual displacement of structure would not exceed a serviceability limit or capacity limit in seismic design. Figure 12 typically shows the time history curves of horizontal displacement for some measuring points in the three-stage soil slope supported by the anchor frame structure subjected to Shaking cases 2 and 4. Where, the positive value represents that the horizontal displacement moves towards the soil slope. The time history curve of horizontal response displacement presents two distinctive periods (at 7-13 s and 29-40 s), during which a large amplitude vibration is observed.At 38 s during the shaking case, the positive displacement of frame structure accumulates dramatically. The residual displacement of frame structure decreases as the local height of each stage increases. The largest horizontal displacement occurs at the toe of frame structure for each stage, which indicates that the toe of frame structure is more likely to be damaged by earthquake loading. The frame structure at each stage presents a combined residual displacement mode comprising a horizontal translation and a rotation around the vertex. The residual displacement of the frame structure at each stage subjected to different shaking cases is quantitatively shown in Table 5, in which the translation displacement index (d/Hi) is determined by dividing the horizontal displacement by the height of frame structure at each stage, and ���ȡ� represents the rotation radian angle of frame structure. The residual displacement of frame structure at each stage increases as the seismic intensity increases. When the peak horizontal acceleration of shaking case changes from 0.1g to 0.6g, the translation displacement index of the frame structure at the first stage increases from 0.020 to 3.783 by 185 times, and the rotation angle changes from 0.039��10-3 rad to 21.212��10-3 rad by 543 times. The residual seismic displacement of the frame structure at the first stage is larger than that at the other two stages. It is suggested that the anchorage strength of the frame structure at the first stage should be enhanced in seismic design for such three-stage anchor frame structure in order to prevent the anchors being pulled out or the frame structure being overturned.
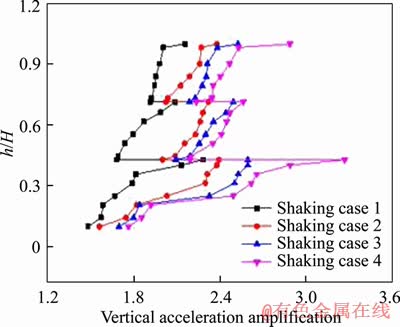
Figure 11 Distribution of vertical acceleration amplification coefficient subjected to different shaking cases
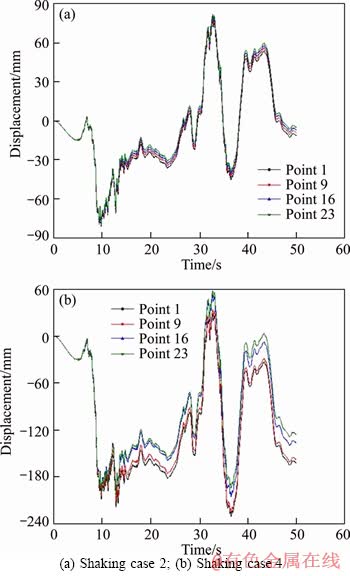
Figure 12 Horizontal displacement response of several typical measuring points at frame structure under different shaking cases:
Table 5 Deformation of frame structure at each stage under different shaking cases
3.5 Anchor stress response
The anchor stress time history curves of frame structure subjected to Shaking cases 2 and 4 are shown in Figure 13. The response anchor stress shows two conspicuous increments under Wenchuan ground motion, and the first increment is quite larger than the second one. The observation indicates that the anchor is more likely to yield subjected to the first intense pulse of Wenchuan seismic wave. For instance, the stress of Anchor 1 changes from 33.423 to 519.504 kPa subjected to Shaking case 4, where 81.2% of the increment arises during the first intense pulse of Wenchuan seismic wave. Under Shaking case 2, about 98.3% increment of anchor stress arises at the first intense pulse of Wenchuan seismic wave at Anchor 1.
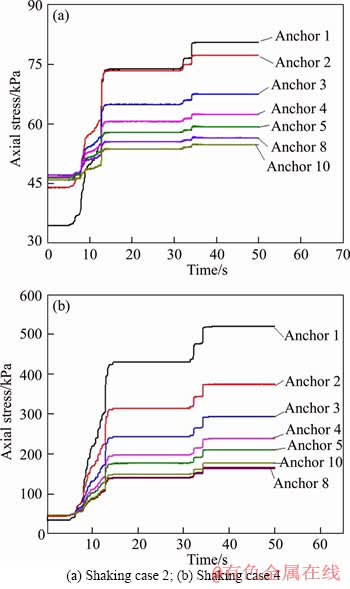
Figure 13 Time history curve of maximum axial force of anchors in anchor frame structure under different shaking cases:
Figure 14 presents the maximum anchor stress of frame structure along the three-stage soil slope height under different shaking cases. For each stage, the anchor stress at the slope toe is much larger than that in other positions, and it presents a decreasing tendency along the local height of frame structure. The phenomenon is related to the observation that the maximum displacement of frame structure exists near the toe of frame structure for each stage. Therefore, it is indicated that the anchors at the lower part of frame structure at each stage is more vulnerable to Wenchuan ground motion, and the anchors with a higher tensile strength are required in engineering practice.
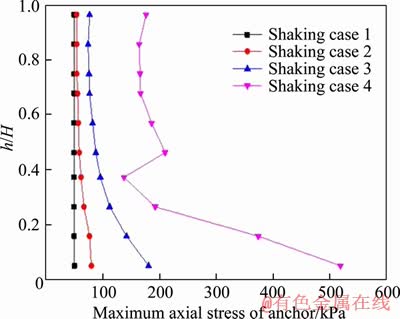
Figure 14 Distribution of maximum anchor stress along height of three-stage anchor frame structure
Typically, the distributions of anchor stress for Anchors 1, 3, 5 and 8 along their length subjected to different shaking cases are presented in Figure 15, in which, the pre-earthquake anchor stress is mainly caused by prestressing force and structure weight. The maximum anchor stress is observed at the anchoring head for each anchor. Because the frictional and cohesive interaction between the anchor and the overlying soil stratum is neglected in numerical simulation, the stress of anchor does not change obviously along its length within the overlying soil stratum section. Besides, the anchor stress reduces sharply and immediately turns to naught in rock section. Therefore, a long anchoring length in rock section seems unnecessary if the anchor fulfills the requirement of drawing strength. Apart from that, the distribution of post-earthquake anchor stress for Shaking case 1 shows a very small change compared with the pre-earthquake condition, which makes these two distribution curves almost overlap. It is indicated that the three-stage soil slope supported by the anchor frame structure performs quite well subjected to Shaking case 1.
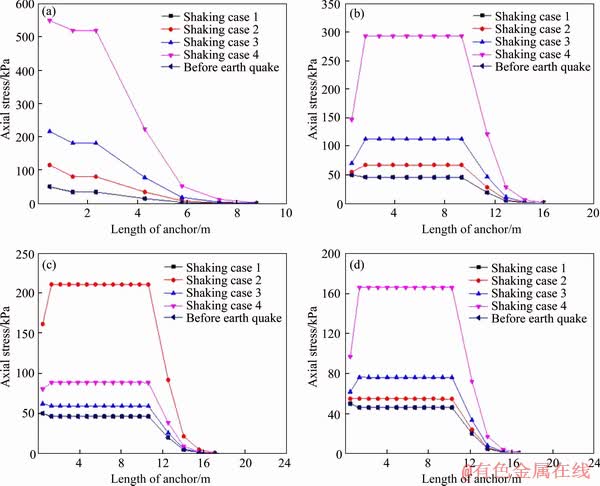
Figure 15 Distribution of anchor stress at Anchor 1 (a), Anchor 3 (b), Anchor 5 (c) and Anchor 8 (d) before and after earthquake loading
4 Discussions
A large number of elements in three-stage soil slope experience both the tension failure and the shear failure as the intensity of shaking case reaches 0.2g. However, due to the function of anchor frame structure, the soil slope does not collapse subjected to shaking cases. It is effective to improve the seismic stability of soil slope by using different types of retaining structure. With regard to the seismic design, it is crucial to make a full use of the strength of retaining structure rather than the soil mass.
Most of previous studies reveal that the response acceleration probably monotonically increases along the height of soil slope or retaining structure [43-46]. However, as for the three-stage soil slope, due to the horizontal platforms among the different stages, the response acceleration at the slope toe of the upper stage is much smaller than that at the slope top of the lower stage even if these two positions share a same elevation. Consequently, it is reasonable to take the engineering measure of ��multiple stage�� to improve the seismic mechanical behavior of high soil slope.
The anchor frame structure is a typical flexible supporting structure, and a certain amount of deformation is allowable in engineering practice. Since the residual displacement of anchor frame structure is sensitive to earthquake loading, it is necessary to check the residual displacement of anchor frame structure by applying a series of shaking cases with different intensities to make a reasonable seismic design.
The anchor stress is related to the displacement of frame structure. The anchor stress of frame structure near the slope toe is considerably larger due to a large residual displacement. Meanwhile, the anchor stress of frame structure is also considerable enlarged by earthquake loading. Consequently, the anchor with a larger tensile strength is required at the bottom of anchor frame structure, especially in the areas with a high seismic intensity.
5 Conclusions
The top zone of soil slope at each stage experiences a tensile failure first. Many soil elements near the arc interface between the soil and the rock experience a shear failure without a tension failure. No failure occurs at the frame structure and the rock mass during shaking cases. Many inner soil elements do not experience any failure as the input acceleration is 0.1g.
The response acceleration can be weakened by configurating the soil slope into different stages with platforms. The acceleration amplification coefficient at the slope toe of upper stage is smaller than that at the slope top of lower stage due to the existence of platform. The response acceleration near the slope top is the most amplified for each stage.
The residual displacement of three-stage frame structure is significantly increased by earthquake loading with the largest increment near the slope toe at each stage. The horizontal residual displacement of frame structure decreases along its height. The frame structure presents a translation displacement combined with a rotation around the vertex.
The anchor stress of frame structure is mainly increased by the first intense pulse of Wenchuan ground motion. The anchor stress of frame structure near the bottom of slope is considerably increased, and it decreases along the height of frame structure. The anchor stress of frame structure at the first stage is generally larger than the other two stages.
References
[1] SUN Ping, LI Rong-jian, JIANG Hao, IGWE O, SHI Ju-song. Earthquake-triggered landslides by the 1718 Tongwei earthquake in Gansu province, northwest China [J]. Bulletin of Engineering Geology and the Environment, 2017, 76(4): 1281-1295. DOI:10.1007/s10064-016-0949-4.
[2] XU Chong,XU Xi-wei,SHYU J B H. Database and spatial distribution of landslides triggered by the Lushan, China Mw 6.6earthquakeof 20 April 2013 [J]. Geomorphology, 2015, 248:77-92. DOI:10.1016/j.geomorph.2015.07.002.
[3] LING H I,LESHCHINSKY D, CHOU N N S. Post- earthquake investigation on several geosynthetic-reinforced soil retaining walls and slopes during the Ji-Ji earthquake of Taiwan [J]. Soil Dynamics and Earthquake Engineering, 2001, 21(4): 297-313. DOI: 10.1016/S0267-7261(01) 00011-2.
[4] ZHANG Jian,QU Hong-lue,LIAO Yi,MA Yao-xin. Seismic damage of earth structures of road engineering in the 2008 Wenchuan earthquake [J]. Environmental Earth Sciences, 2012, 65(4): 987-993. DOI:10.1007/s12665-011-1519-5.
[5] HACK R, ALKEMA D, KRUSE G, LEENDERS N, LUZI L. Influence of earthquakes on the stability of slopes [J]. Engineering Geology, 2007, 91(1): 4-15. DOI: 10.1016/ j.enggeo.2006.12.016.
[6] WU Zhi-jian, WANG Lan-min, WANG Ping, CHEN Tuo, SHI Hang, YANG Xiao-peng. Influence of site conditions on ground motion at far field loess sites during strong earthquake [J]. Journal of Central South University, 2013, 20(8): 2333-2341. DOI:10.1007/s11771-013-1741-2.
[7] LI Xin-po, WU Yong,HE Si-ming. Seismic stability analysis of gravity retaining walls [J]. Soil Dynamics and Earthquake Engineering, 2010, 30(10): 875-878. DOI: 10.1016/j.soildyn. 2010.04.005.
[8] XU Jing-shu, YANG Xiao-li. Seismic and static stability analysis for 3D reinforced slope in nonhomogeneous and anisotropic soils [J]. International Journal of Geomechanics, 2018, 18(7): 04018065. DOI: 10.1061/(ASCE)GM.1943- 5622.0001177.
[9] LIN Yu-liang, YANG Guo-lin, LI Yun, ZHAO Lian-heng. Engineering behaviors of reinforced gabion retaining wall based on laboratory test [J]. Journal of Central South University of Technology, 2010, 17(6): 1351-1356. DOI: 10.1007/s11771-010-0641-y.
[10] CHEN R H,CHIU Y M. Model tests of geocell retaining structures [J]. Geotextiles and Geomembranes, 2008, 26(1): 56-70. DOI:10.1016/j.geotexmem.2007.03.001.
[11] LI J, THAM L G,JUNAIDEEN S M,YUE Z Q,LEE C F. Loose fillslopestabilization withsoilnails: Full-scale test [J]. Journal of Geotechnical and Geoenvironmental Engineering, 2008, 134(3): 277-288. DOI: 10.1061/ (ASCE)1090-0241(2008)134:3(277).
[12] CHEHADE H A, DIAS D,SADEK M, JENCK O, CHEHADE F H. Seismic analysis of geosynthetic-reinforced retaining wall in cohesive soils [J]. Geotextiles and Geomembranes, 2019, 47(3): 315-326. DOI: 10.1016/ j.geotexmem.2019.02.003.
[13] SEED H B. Considerations in the earthquake resistant design of earth and rock fill dams [J]. Geotechnique, 1979, 29(3): 215-263.
[14] ABOUZAR S. Pseudo-static lateral earth pressures on broken-back retaining walls [J]. Canadian Geotechnical Journal, 2010, 47(11): 1247-1258. DOI:10.1139/T10-025.
[15] RANJBAR A, KARKANAKI N, GANJIAN F A. Pseudo-static analysis of cantilever retaining walls using upper bound limit analysis approach [J]. Journal of Central South University, 2019, 26(1): 241-255. DOI: 10.1007/ s11771-019-3997-7.
[16] LIN Yu-liang, LENG Wu-ming, YANG Guo-lin, ZHAO Lian-heng, LI Liang, YANG Jun-sheng. Seismic active earth pressure of cohesive-frictional soil on retaining wall based on a slice analysis method [J]. Soil Dynamics and Earthquake Engineering, 2015, 70: 133-147. DOI: 10.1016/ j.soildyn.2014.12.006.
[17] LIN Yu-liang, YANG Xiao, YANG Guo-lin, LI Yun, ZHAO Lian-heng. A closed-form solution for seismic passive earth pressure behind a retaining wall supporting cohesive- frictional backfill [J]. Acta Geotechnica, 2017, 12(2): 453-461. DOI:10.1007/s11440-016-0472-6.
[18] BAKER R, SHUKHA R,OPERSTEIN V, FRYDMAN S. Stability charts for pseudo-static slope stability analysis [J]. Soil Dynamics and Earthquake Engineering, 2006, 26(9): 813-823. DOI:10.1016/j.soildyn.2006.01.023.
[19] GHOSH S, SHAMRMA R. Pseudo-dynamic active response of non-vertical retaining wall supporting c-�� backfill [J]. Geotechnical and Geological Engineering, 2010, 28(5): 633-641. DOI: 10.1007/s10706-010-9321-9.
[20] GHOSH P. Seismic vertical uplift capacity of horizontal strip anchors using pseudo-dynamic approach [J]. Computers and Geotechnics, 2009, 36(1, 2): 342-351. DOI: 10.1016/ j.compgeo.2008.01.002.
[21] GHOSH P. Seismic active earth pressure behind a nonvertical retaining wall using pseudo-dynamic analysis [J]. Canadian Geotechnical Journal, 2008, 45(1): 117-123. DOI: 10.1139/T07-071.
[22] HE Si-ming, OUYANG Chao-jun, LUO Yu. Seismic stability analysis of soil nail reinforced slope using kinematic approach of limit analysis [J]. Environmental Earth Sciences, 2011, 66(1): 319-326. DOI:10.1007/s12665-011-1241-3.
[23] YAN Min-jia, XIA Yuan-you, LIU Ting-ting, BOWA V M. Limit analysis under seismic conditions of a slope reinforced with prestressed anchor cables [J]. Computer and Geotechnics, 2019, 108: 226-223. DOI: 10.1016/j.compgeo. 2018.12.027.
[24] NEWMARK N M. Effects of earthquakes on dams and embankment: Fifth Rankine lecture [J]. Geotechnique, 1965, 25(2): 139-159.
[25] MICHALOWSKI R L. Displacements of multiblock geotechnical structures subjected to seismic excitation [J]. Journal of Geotechnical and Geoenvironmental Engineering, 2007, 133(11): 1432-1439. DOI: 10.1061/(ASCE)1090- 0241(2007)133:11(1432).
[26] LIN Yu-liang. Deformation behavior of reinforced embankment slopes under seismic excitation [J]. Disaster Advances, 2013, 6(7): 12-19.
[27] LEE K Z Z, CHANG N Y, KO H Y. Numerical simulation of geosynthetic-reinforced soil walls under seismic shaking [J]. Geotextiles and Geomembranes, 2010, 28(4): 317-334. DOI: 10.1016/j.geotexmem.2009.09.008.
[28] WANG L,CHEN S,GAO P. Research on seismic internal forces of geogrids in reinforced soil retaining wall structures under earthquakeactions [J]. Journal of Vibroengineering, 2014, 16(4): 2023-2034
[29] WILSON P, ELGAMAL A. Large-scale passive earth pressure load-displacement tests and numerical simulation [J]. Journal of Geotechnical and Geoenvironmental Engineering, 2010, 136(12): 1634-1643. DOI: 10.1061/ (ASCE)GT.1943-5606.0000386.
[30] LIN Yu-liang, LI Ying-xin, YANG Guo-lin, LI Yun. Experimental and numerical study on the seismic behavior of anchoring frame beam supporting soil slope on rock mass [J]. Soil Dynamics and Earthquake Engineering, 2017, 98: 12-23. DOI: 10.1016/j.soildyn.2017.04.008.
[31] LIN Yu-liang, YANG Guo-lin, YANG Xiao, ZHAO Lian-heng, SHEN Quan, QIU Ming-ming. Response of gravity retaining wall with anchoring frame beam supporting a steep rock slope subjected to earthquake loading [J]. Soil Dynamics and Earthquake Engineering, 2017, 92: 633-649. DOI: 10.1016/j.soildyn.2016.11.002
[32] LIN Yu-liang, CHENG Xue-ming, YANG Guo-lin. Shaking table test and numerical simulation on a combined retaining structure response to earthquake loading [J]. Soil Dynamics and Earthquake Engineering, 2018, 108: 29-45. DOI: 10.1016/j.soildyn.2018.02.008.
[33] LIN Yu-liang, CHENG Xue-ming, YANG Guo-lin. Seismic response of a sheet-pile wall with anchoring frame beam by numerical simulation and shaking table test [J]. Soil Dynamics and Earthquake Engineering, 2018, 118: 352-364. DOI: 10.1016/j.soildyn.2018.07.028.
[34] LIN Yu-liang, LU Li, YANG Guo-lin. Seismic behavior of a single-form lattice anchoring structure and a combined retaining structure supporting soil slope: A comparison [J]. Environmental Earth Sciences, 2020, 79(3): 78. DOI: 10.1007/s12665-020-8817-8.
[35] YE Hai-lin, HUANG Run-qiu, ZHENG Ying-ren, DU Xiu-li, Li An-hong. Sensitivity analysis of parameters for bolts in rock slopes under earthquakes [J]. Chinese Journal of Geotechnical Engineering, 2010, 32(9): 1374-1379. (in Chinese)
[36] YAZDANDOUST M. Laboratory evaluation of dynamic behavior of steel-strip mechanically stabilized earth walls [J]. Soils and Foundations, 2018, 58(2): 264-276. DOI: 10.1016/ j.sandf.2018.02.016.
[37] LEE K Z Z, CHANG N Y,KO H Y. Numericalsimulationof geosynthetic-reinforced soil walls under seismic shaking [J]. Geotextiles and Geomembranes, 2010, 28(4): 317-334. DOI: 10.1016/j.geotexmem.2009.09.008.
[38] LIN Yu-liang, SHI Feng, YANG Xiao, YANG Guo-lin, LI Li-min. Numerical analysis on seismic behavior of railway earth embankment: A case study [J]. Journal of Central South University, 2016, 23(4): 906-918. DOI: 10.1007/s11771- 016-3138-5.
[39] LIN Yu-liang, YANG Guo-lin. Dynamic behavior of railway embankment slope subjected to seismic excitation [J]. Natural Hazards, 2013, 69(1): 219-235. DOI: 10.1007/ s11069-013-0701-3.
[40] LIN Yu-liang, LENG Wu-ming, YANG Guo-lin, LI Liang, YANG Jun-sheng. Seismic response of embankment slopes with different reinforcing measures in shaking table tests [J]. Natural Hazards, 2015, 76(2): 791-810. DOI: 10.1007/ s11069-014-1517-5.
[41] HUANG C C, HORNG J C, CHANG W J, CHUEH S Y, CHIOU J S, CHEN C H. Dynamic behavior of reinforced slopes: horizontal acceleration response [J]. Geosynthetics International, 2010, 17(4): 207-219. DOI: 10.1680/gein. 2010.17.4.207.
[42] LIN Yu-liang, ZHAO Lian-heng, YANG T Y, YANG Guo-lin, CHEN Xiao-bin. Investigation on seismic behavior of combined retaining structure with different rock shapes [J]. Structural Engineering and Mechanics, 2020, 73(5): 599-612. DOI: 10.12989/sem.2020.73.5.599.
[43] WANG Li-ping, ZHANG Ga. Centrifuge model test study on pile reinforcement behavior of cohesive soil slopes under earthquake conditions [J]. Landslides, 2013, 11(2): 213-223. DOI: 10.1007/s10346-013-0388-2.
[44] YANG B, LUO Y, JENG D S, FENG J. Effects of moisture content on the dynamic response and failure mode of unsaturated soil slope subjected to seismic load [J]. Bulletin of the Seismological Society of America, 2019, 109(2): 489-504. DOI:10.1785/0120180222.
[45] LIN Yu-liang. Shaking table modeling of embankment slope response to earthquake loading [J]. Disaster Advances, 2013, 6(12): 69-77.
[46] FAN G,ZHANG J J, WU J B,YAN KM.Dynamic response and dynamic failure mode of a weak intercalated rockslopeusing a shaking table [J]. Rock Mechanics and Rock Engineering, 2016, 49(8): 3243-3256. DOI: 10.1007/s00603-016-0971-7.
(Edited by HE Yun-bin)
���ĵ���
ê�˿�ܽṹ֧���������µĵ�����Ӧ�����о�
ժҪ�����ij����ʵ���еĵ��ͱ���ԭ�ͣ�����FLAC3D���뽨����ê�˿�ܽṹ֧���������µ���ֵģ�͡�ͨ��ʩ��һϵ��˫���봨���������о��������º�ê�˿�ܽṹ�Ķ�����Ӧ������������ṹ���ƻ�״̬�����µļ��ٶ���Ӧ����ܽṹ��λ����Ӧ�Լ�ê������Ӧ�����ڲ�ͬ�ļ��������£�ÿ�����¶����ˮƽ�ʹ�ֱ���ٶ���Ӧ����������¼����õ�ƽ̨�����˼��ٶ���Ӧ�ķŴ�ЧӦ�����ŵ���ǿ�ȵ����ӣ���ܽṹ�ĵ������λ���������ӡ�ÿһ����ܽṹ���ֳ�ƽ�Ƽ��ƶ�����ת�����λ��ģʽ����ܽṹ��ê������Ӧ�����봨�������ĵ�һ����ǿ��ʱ���������ӣ��ҶԵ���ǿ�����С�������������µ�һ����ܽṹ��ê������Ӧ��������Ϊ������
�ؼ��ʣ��������£�ê�˿�ܽṹ�����ٶȣ�λ�ƣ�ê��Ӧ��
Foundation item: Projects(51878667, 51678571) supported by the National Natural Science Foundation of China; Project(2018zzts657) supported by the Central South University Postgraduates�� Innovation, China; Project(2018JJ2517) supported by the Hunan Provincial Natural Science Foundation of China
Received date: 2019-03-10; Accepted date: 2020-04-02
Corresponding author: LIN Yu-liang, PhD, Associate Professor; Tel: +86-13508477813; E-mail: linyuliang11@csu.edu.cn, linyuliang11@163.com; ORCID: 0000-0001-9314-7957; ZHAO Lian-heng, PhD, Professor; Tel: +86- 13755139425; E-mail: zlh8076@163.com; ORCID: 0000-0002-8406-5973
Abstract: Based on a typical prototype of a soil slope in engineering practice, a numerical model of a three-stage soil slope supported by the anchor frame structure was established by means of FLAC3D code. The dynamic responses of three-stage soil slope and frame structure were studied by performing a series of bidirectional Wenchuan motions in terms of the failure mode of three-stage structure, the acceleration of soil slope, the displacement of frame structure, and the anchor stress of frame structure. The response accelerations in both horizontal and vertical directions are the most largely amplified at the slope top of each stage subjected to different shaking cases. The platforms among the stages reduce the amplification effect of response acceleration. The residual displacement of frame structure increases significantly as the intensity of shaking case increases. The frame structure at each stage presents a combined displacement mode consisting of a translation and a rotation around the vertex. The anchor stress of frame structure is mainly increased by the first intense pulse of Wenchuan seismic wave, and it is sensitive to the intensity of shaking case. The anchor stress of frame structure at the first stage is the most considerably enlarged by earthquake loading.
