
Trans. Nonferrous Met. Soc. China 25(2015) 3753-3759
Ambient electrical conductivity of carbon cathode materials for aluminum reduction cells
Jun ZHU1,2, Ji-lai XUE1,2, Ya-nan ZHANG1, Xiang LI1, Tong CHEN1
1. School of Metallurgical and Ecological Engineering, University of Science and Technology Beijing, Beijing 100083, China;
2. State Key Laboratory of Advanced Metallurgy, University of Science and Technology Beijing, Beijing 100083, China
Received 22 December 2014; accepted 8 March 2015
Abstract:
The ambient electrical conductivity (AEC) of carbon cathode materials was investigated in respect to their open porosity, crystal structure and graphite content using hydrostatic method, four-probe technique and X-ray diffraction (XRD), respectively. The AEC is proportional to the specific conductivity (��0) and the exponential of (1-��) (�� is porosity) by a quasi-uniform formula based on the percolation theory. The ��0 can reflect the intrinsic conductivity of the carbon cathodes free of pores, and it depends on the mean crystallite size parallel to the layer (002). The exponent n is dependent on the materials nature of the cathode aggregates, while an averaged value, 4.65, can practically work well with 5 types of cathode materials. The calculation of ��0 can be extended to the graphitic cathodes containing different aggregates using the simple rule of mixture.
Key words:
carbon cathode; electrical conductivity; porosity; crystal structure; aluminium reduction cell;
1 Introduction
Carbon cathode materials are widely applied to electrolytic cells, arc furnaces and energy storage devices [1-4]. The ambient electrical conductivity (AEC) of the cathode materials is a key property for these applications. In modem aluminum reduction cells, especially for the super-high amperage cells up to 500-600 kA, a small improvement in the AEC may lead to significant energy savings [5]. The major methods in improving the conductivity of the carbon cathodes include the increase of graphite content (GC) in the cathode materials, for instances, semi- and full-graphitic cathodes [6,7], and the perfection of the crystal structure of the carbon cathodes, i.e., the graphitized cathodes [8]. The better AECs through these method above have been reported in the literature [1,9], but most of the results are limited to a rough treatment for the relationship of the AEC with the crystal structure and the GC in the carbon cathodes.
On the other hand, the cathodes have porous structures which may change during the heat treatment process [10] and have important influences on the cathode properties [11-13]. Open porosity is considered as one of the most universal parameters for the porous structures, which can be related to the AEC of carbon materials. WAGNER et al [14] studied the AEC of polycrystalline graphite, and put forward a linear relationship between the AEC and the porosity. RHEE [15] advanced WAGNER��s model using a non-linear formula, while SUN et al [16] proposed another complex formula based on the ideal fluid mechanic for the carbon materials. However, the above formulae are still far from satisfactorily understanding the effects of the porosity on the AEC in carbon cathodes.
In this work, the relationship between AEC and open porosity was studied on the cathodes used for aluminum reduction cells. Experimental data obtained in our laboratory and from the literature were analyzed and modeled to describe their relationship among various carbon cathodes. The effects of crystal structures of the cathodes on the AEC were also discussed quantitatively. Moreover, a mathematical formula was developed to theoretically calculate the conductivity of graphitic cathodes with various GC values. The work is aimed to establish close relationships among the AEC, porosity, crystal structure and GC for quantitatively evaluating the electrical conductivity of carbon cathodes.
2 Experimental
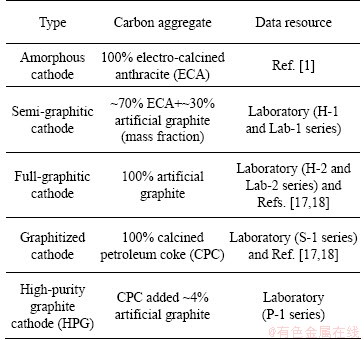
There are five types of carbon cathodes investigated in this work, which are classified according to their aggregate materials and listed in Table 1. The data of AEC and porosity of the cathodes were tested in our laboratory, together with some collected from the Refs. [1,17,18] for a more systematic investigation. The tested samples were taken from the commercial products used in industrial reduction cells (H-1, H-2, S-1 and P-1 series), or prepared in our laboratory (Lab-1 and Lab-2 series). All the samples were machined to a cylindrical form (50 mm in length and 25 mm in diameter).
Table 1 Selected carbon cathode materials under investigation
The porosity of the sample was measured by the hydrostatic method [19]. 1) Determine the dry mass (m1) of the sample (accurate to 0.01 g) after being dried at 110 ��C to constant mass. 2) Prepare a water saturated sample in the set-up illustrated in Fig. 1. The dried sample was immersed in distilled water under a pressure no more than 133 Pa until water saturation. 3) Suspend the saturated sample in water to obtain the suspended mass (m2) (0.01 g). 4) After Step (3), blot the sample lightly with a moistened cotton towel to remove water drops from the surface and weigh in air to obtain the saturated mass, m3 (0.01 g). Then, the open porosity (��) was calculated as
 (1)
(1)
The AEC was measured in a device based on a standard four-probe method [20], as shown in Fig. 2. A constant current (I) from DC power supplier passed through two Cu plates which were forced (F) to maintain a good contact on both sides of the sample, which was recorded by a high precision amperemeter (TAITAN VC9806A+, 0.001 A). The voltage drop (U) between the two contact points (a and b) that were longitudinally centered on the top of the horizontal sample, was tested using a high precision voltmeter (Tektronix DMM4050, 0.0001 mV). The distance (L) between points a and b was kept constant. The AEC was calculated by
 (2)
(2)
where A is the cross-sectional area of the sample. The test was repeated 8 times by axially rotating the sample every 45��, and the reported value was an average of these measurements.
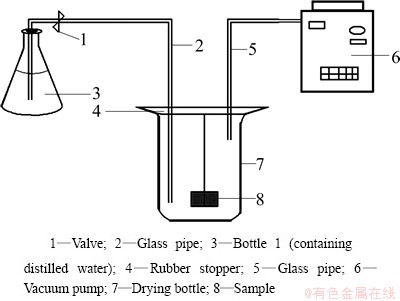
Fig. 1 Schematic drawing of set-up for preparing saturated sample
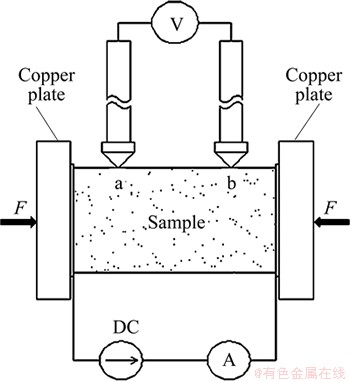
Fig. 2 Schematic drawing of four-probe method for electrical conductivity measurement
The crystal structure of the sample was examined by X-ray diffraction (XRD, Rigaku D/max-2400) using Cu K�� radiation within a range of 10��-90�� (2��) by step scanning of 0.020��. The XRD patterns were analyzed by MDI Jade5.0 software with an internal database of PDF-2 Reference, to obtain the interplanar spacing of the layer (002), d(002), and the mean crystallite size parallel to the layer, a(100). For this purpose, a corrected FWHM (the full-width at half-maximum) curve of the X-ray instrumentation was constructed using high pure Si powders (<42 ��m and annealed) under the same conditions, which was imported into the software during the analyzing.
3 Results and discussion
3.1 Effect of open porosity on electrical conductivity
Figure 3 shows AEC as a function of porosity in the investigated cathode materials. As can be seen, the AEC decreases with the increase of porosity, and the degree of such a decrease can vary with the material types given. The deceasing trends with the graphitized and HPG cathodes are more obvious than that with the amorphous, semi- and full-graphitic cathodes. This phenomenon should be related to the aggregate materials of the cathodes, because the cathodes contained calcined petroleum coke (such as the graphitized and HPG) with their AECs sensitive to the increased porosity.
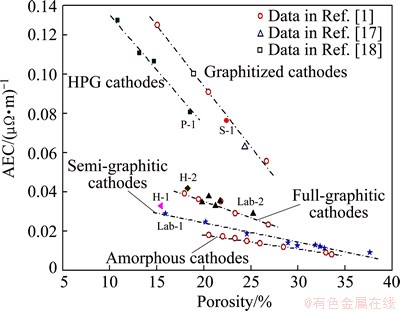
Fig. 3 AEC as function of porosity for five types of carbon cathode materails
In addition, it looks like that some linear relationships exist between the AEC and the porosity in Fig. 3. However, the diverse nature of the slopes of the fitted lines suggests that a simple linear relationship may not be suitable as a uniform expression to describe the complex effects of the porosity on the AEC of the carbon cathode materials with a wide variety.
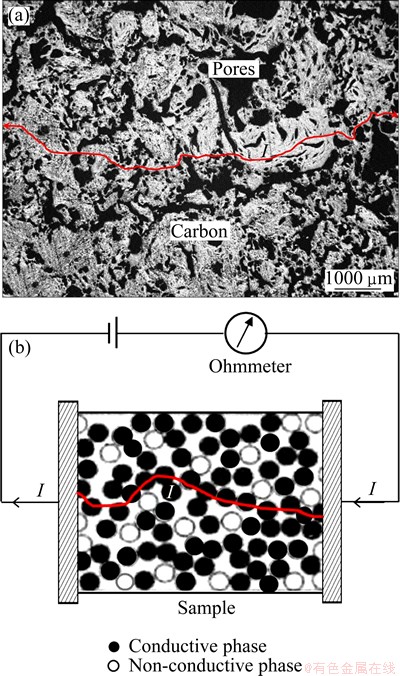
Fig. 4 Optical microscopic photograph showing distribution of conductive (carbon) and non-conductive (pores) phases in carbon cathodes (a) and schematic diagram of percolation theory model for electrical conductivity testing (b)
In our previous work [10], it was found that the aggregates with binder distributed in carbon matrix randomly to form a continuous conductive phase around by pores, as shown in Fig. 4(a). This structure pattern seems very close to the model of percolation theory which has been developed for the materials with random and complicated structure [21], as illustrated in Fig. 4(b). Based on this similarity, therefore, the relationship of the AEC (��) and the porosity (��) can be expressed as
��=��0(1-��)n (3)
where ��0 is the specific conductivity (SC) of a full density (pore-free) sample, which is only dependent on materials. The constant n is also dependent on the materials in a percolating system [21]. Taking natural logarithm on the both sides, Eq. (3) becomes
ln ��=ln ��0+nln(1-��) (4)
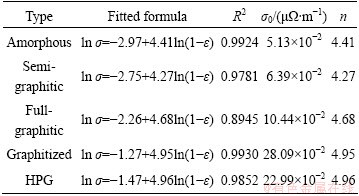
Treating the data in Fig. 3 by Eq. (4), the values of ��0 and n for the investigated cathodes can be obtained using Origin 8.0 software, as listed in Table 2. For all the five types, linear relationships with similar slopes are satisfied between ln �� and ln(1-��) with the adjusted R-square (R2) values more than 0.8945. The five fitted n values are close within the range of 4.4 to 5.0. The reason of the n values varied in different types should be ascribed to the difference in the carbon aggregates contained (see Table 1), because n is mainly dependent on materials in a percolating system. In spite of this, it may still be reasonable to take the n value as one constant for all the five types of carbon cathodes, as the variation among the five fitted n is so small. For a practical convenience, an average value of n=4.65 with the standard deviation of ��0.28 is adopted. To describe the relationship between the AEC and the porosity in carbon cathodes, a quasi-uniform formula is proposed as
��=��0(1-��)4.65��0.28 (5)
It should be noted in this case that ��0 is only dependent on materials which should be a constant for each type of cathode aggregates. This means that ��0 can act as a reflection on the intrinsic electrical conductivity of the carbon aggregates. However, the ��0 of carbon cathodes could be almost impossible to obtain in practice, since it is unable to make any carbon cathode sample pore-free with any technology available for today. Thus, a statistical approach in this work has been applied to obtaining the ��0 values for various carbon cathodes.
Table 2 Fitted results for five types of carbon cathodes using Eq. (4)
3.2 Effect of crystal structure on electrical conductivity
Figure 5 shows the effects of the crystal parameters, a(100) and d(002), on the AEC and SC (��0) for the samples tested. It can be seen that the AEC changes irregularly with the two parameters, but the SC increases with the increase of a(100) (Fig. 5(a)) while decreases with the increase of d(002) (Fig. 5(b)).
In the classical free electron theory, the electrical conductivity of full density materials is determined by [22]
 (6)
(6)
where N is the concentration of carriers, l is the mean free path of carriers, m* is the effective mass of carriers, and v is the average velocity of carriers. The values of (N/m*) are comparable for various carbon cathode materials at room temperature [23], which means that (N/m*) should be a rough constant for carbon cathodes. v is also an approximate constant at room temperature in carbon cathodes [24]. Therefore, the ��0 should be mainly affected by l for various types of carbon cathodes.
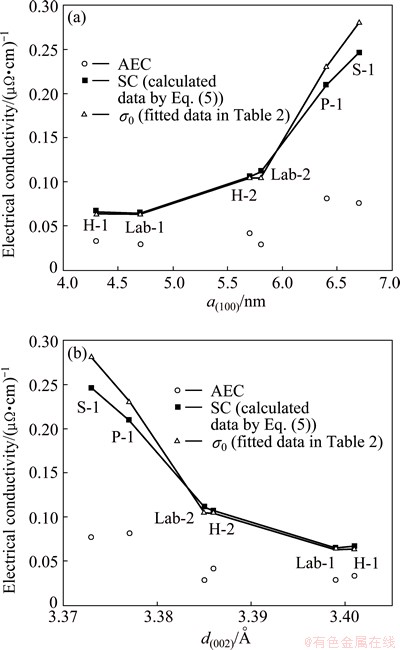
Fig. 5 Effects of a(100) (a) and d(002) (b) on AEC and SC for selected testing samples
The value of l may be dependent on the thermal scattering from the lattice vibrations and the defects within the crystallites as well as at the crystallite boundaries, which can be expressed as [14,25]
 (7)
(7)
where lT is the mean distance between thermal scattering centers, and li are all other scattering mean free paths, where both should be constants at room temperature. By substituting Eq. (7) into Eq. (6), we have
 (8)
(8)
Equation (8) can also be rewritten as
 (9)
(9)
Equation (9) suggests that an approximate linear relationship may exist between (1/��0) and (1/a(100)), as shown in Fig. 6.
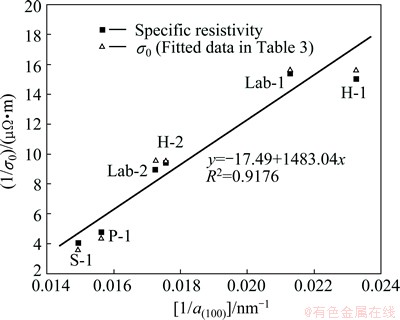
Fig. 6 Linearity between (1/��0) and (1/a(100)) with selected carbon cathode sampsles
In addition, the effect of d(002) on the SC exactly shows an opposite tendency to the effect of a(100) (see Fig. 5(b)). This can be directly due to an inverse linear relationship between a(100) and d(002), as shown in Fig. 7. Under this connection, both d(002) and a(100) can be affected by the types of the carbon aggregates and the heating-treatment temperatures for the carbon cathode materials as well.
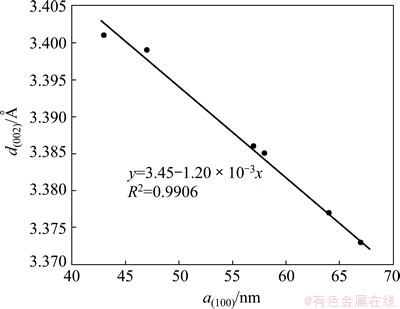
Fig. 7 Inverse linearity between a(100) and d(002)
3.3 Relationship between specific conductivity and graphite content
According to Table 2 and Eq. (5), the AEC of the five types of carbon cathodes could be evaluated and predicted quasi-uniformly. However, the evaluation is still difficult for the cathode materials lack of SC values. A probable solution is to theoretically calculate an unknown SC value by using the known ��0. In this section, we derived the SC of various graphitic cathodes with the mixed aggregates of anthracite and artificial graphite (i.e., the graphite content varied).
For a two-phase composite, if the AEC of each phase is similar to each other, the effective conductivity (��eff, i.e., SC) of the composite can be determined by the simple rule of mixture (ROM) [26,27]:
 (10)
(10)
where ��i is the volume fraction of phase i, and ��i is the SC of phase i. In our case, the SC (��SC) of the mixed aggregates can be calculated as
��SC=��G��G+��A��A (11)
where ��G and ��G are the volume fraction and the SC of artificial graphite (AG), respectively, while ��A and ��A are those for the anthracite, respectively. The volume fractions of the two aggregates can be determined by
 (12)
(12)
where wG and wA are the mass fractions of AG and anthracite, respectively, and wG+wA=1; ��G and ��A refer to the real densities of AG and anthracite, respectively, and ��G��2.08 g/cm3, ��A��1.86 g/cm3 [1], ��G��12.34��10-2 (�̦���m)-1 (2800 ��C), and ��A��6.10��10-2 (�̦���m)-1 (2400 ��C) [23].
A comparison of SC values between the data fitted from Eq. (5) and the values calculated by Eq. (11) is shown in Fig. 8, where the former are higher than the later.
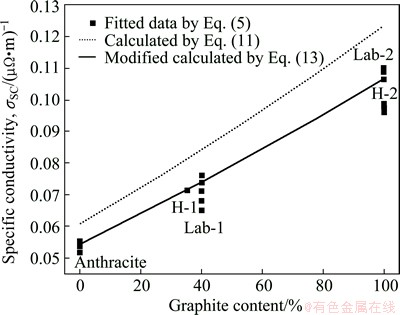
Fig. 8 Comparison of calculation by Eq. (11), modified calculation by Eq. (13) and fitted data by Eq. (5) for specific conductivity vs graphite content in graphitic cathodes
We note that the carbon part of a cathode consists of carbon aggregates and binder baked residues (BBR) [1,2]. Empirically, the mass fraction of BBR is approximate to a constant of (14��2)% so that a modification is as follows:
�ҡ�SC=��G��G+��A��A+��B��B (13)
 (14)
(14)
where ��B, wB, ��B, ��B are the volume fraction, mass fraction, real density, SC of BBR, respectively. wB��14% empirically. As for w��G+ w��A+wB=1, w��G+w��A��86%, there are w��G=0.86wG and w��A=0.86wA. However, the data of ��B and real density for BBR are not abvailable. The SC (1.43��10-2 (�̦���m)-1) and real density (1.85 g/cm3) of a baked hot ramming paste [1] have to be substituted approximately, as the carbon materials and the manufacture process of the baked hot ramming paste, especially its heat-treatment temperature ~1200 ��C, are close to the BBR in the graphitic cathodes. Then, the modified calculated values can be obtained and also shown in Fig. 8. It can be seen that the modified calculation agrees well with the fitted data. According to the modification, the ��0 values of semi- and full-graphitic series are 6.85��10-2 (�̦���m)-1 and 10.66��10-2 (�̦���m)-1, respectively. Both are very close to the corresponding values in Table 2.
A series of graphitic cathodes with 40% graphite content and varied porosity were used to verify Eqs. (5) and (13). According to the modification in Fig. 8, the ��0 of this series cathodes should be 7.41��10-2 (�̦���m)-1. Substituting it into Eq. (5), the AEC of this series can be calculated, as shown in Fig. 9. It can be seen that the calculated values are in good agreement with the experimental data. It means that the formulas proposed in this work represent a better treatment on the fitted parameters and the experimental data.
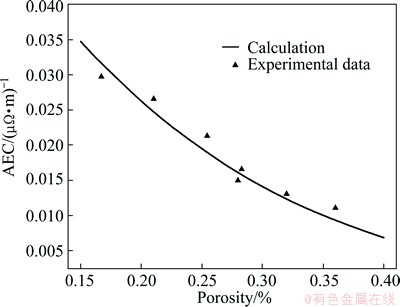
Fig. 9 Validation of Eqs. (5) and (13) for graphitic cathodes with 40% graphitic aggragates
4 Conclusions
1) The relationship between ambient electrical conductivity and open porosity for five types of carbon cathodes classified by their carbon aggregates has been studied. A model based on the percolation theory is proposed to describe the relationship quantitatively and uniformly, as ��=��0(1-��)4.65��0.28.
2) Specific conductivity (��0) independent on the pores can be obtained through fitting model based on the percolation theory. The ��0 value is dependent on the crystal structure and aggregate materials of the carbon cathodes, while the reciprocal of ��0 is linearly related to the reciprocal of the structure parameter a(100).
3) The relationship of ��0 and graphitic content in the carbon cathodes with mixed aggregates of anthracite and artificial graphite can be determined by a simple rule of mixture with the consideration of the binder baked residues. The modified calculations by the proposed formulas agree well with experimental results.
References
[1] SORLIE M, OYE H A. Cathodes in aluminium electrolysis [M]. 3rd ed. Dusseldorf: Aluminium-Verlag Marketing & Kommunikation GmbH, 2010.
[2] FANG Zhao, ZHANG Kai,  Xiao-jun, LI Lin-bo, ZHU Jun, LI Jie. Alkali metals (K and Na) penetration and its effects on expansion of TiB2-C composite cathode during aluminum electrolysis [J]. Transactions of Nonferrous Metals Society of China, 2013, 23(6): 1847-1853.
[3] KAZAK O. Modeling of vortex flows in direct current (DC) electric arc furnace with different bottom electrode positions [J]. Metallurgical and Materials Transactions B, 2013, 44: 1243-1250.
[4] QIN Chuan-li, LU Xing, YIN Ge-ping, BAI Xu-duo, JIN Zheng. Activated nitrogen-enriched carbon/carbon aerogel nanocomposites for supercapacitor applications [J]. Transactions of Nonferrous Metals Society of China, 2009, 19(S3): s738-s742.
[5] LAI Yan-qing, LI Qing-yu, YANG Jian-hong, LI Jie. Ambient temperature cured TiB2 cathode coating for aluminum electrolysis [J]. Transactions of Nonferrous Metals Society of China, 2003, 13(3): 704-707.
[6] WANG Wei, LU Zhi, GU Wan-duo. Creep model of carbon-based cathode materials for aluminum electrolysis under high temperature and electrolysis conditions [J]. The Chinese Journal of Nonferrous Metals, 2014, 24(9): 2339-2344. (in Chinese)
[7] IWASHITA N, IMAGAWA H, NISHIUMI W. Variation of temperature dependence of electrical resistivity with crystal structure of artificial graphite products [J]. Carbon, 2013, 61: 602-608.
[8] CHAUKE L, GARBERS-CRAIG A M. Reactivity between carbon cathode materials and electrolyte based on industrial and laboratory data [J]. Carbon, 2013, 58: 40-45.
[9] RHIM Y R, ZHANG D, FAIRBROTHER D H, WEPASNICK K A, LIVI K J, BODNAR R J, NAGLE D C. Changes in electrical and microstructural properties of microcrystalline cellulose as function of carbonization temperature [J]. Carbon, 2010, 48: 1012-1024.
[10] LI Xiang, XUE Ji-lai, LANG Guang-hui, ZHU Jun, ZHANG Ya-nan, CHEN Tong. Porous structure evolution of graphtic cathode materials for aluminum electrolysis at various baking temperature [J]. Journal of University of Science and Technology Beijing, 2014, 36: 1233-1240. (in Chinese)
[11] FANG Zhao, WU Xiao-lei, YU Juan, LI Lin-bo, ZHU Jun. Penetrative and migratory behavior of alkali metal in different binder based TiB2-C composite cathodes [J]. Transactions of Nonferrous Metals Society of China, 2014, 24(4): 1220-1230.
[12] EIDEM P A, RUNDE M, TANGSTAD M, BAKKEN J A, ZHOU Z Y, YU A B. Effect of contact resistance on bulk resistivity of dry coke beds [J]. Metallurgical and Materials Transactions B, 2009, 40: 388-396.
[13] HILTMANN F, PATEL P, HYLAND M. Influence of internal cathode structure on behavior during electrolysis part I: Properties of graphitic and graphitized material [C]//KVANDE H. Light Metals 2005. USA: TMS, 2005: 751-756.
[14] WAGNER P, O��ROURKE J A, ARMSTRONG P E. Porosity effects in polycrystalline graphite [J]. Journal of the American Ceramic Society, 1972, 55: 214-219.
[15] RHEE S K. Discussion of ��porosity effects in polycrystalline graphite�� [J]. Journal of the American Ceramic Society, 1972, 55: 580-581.
[16] SUN Tian-ming, DONG Li-min, WANG Chen, GUO Wen-li, WANG Li, LIANG Tong-xiang. Effect of porosity on the electrical resistivity of carbon materials [J]. New Carbon Materials, 2013, 28: 349-354.
[17] LARSEN S Y, LIAO X A, GRAN H, MADSHUS S, JOHANSEN J A. Development of high density graphitized cathode blocks for aluminium electrolysis cells [C]//JOHNSON J A. Light Metals 2010. USA: TMS, 2010: 835-840.
[18] YAN Heng-wei, LI Wang-xing, QIU Shi-lin, LI Ji. Corrosion resistance of cathode to NaF-KF-AlF3-based electrolyte [C]// JOHNSON J A. Light Metals 2010. USA: TMS, 2010: 855-858.
[19] ASTM C1039-85. Standard test methods for apparent porosity, apparent specific gravity, and bulk density of graphite electrodes [S]. 2010.
[20] ASTM D6120-97. Standard test method for electrical resistivity of anode and cathode carbon material at room temperature [S]. 2012.
[21] MONAJJEMI M, BAHERI H, MOLLAAMIN F. A percolation model for carbon nanotube-polymer composites using the Mandelbrot-Given curve [J]. Journal of Structural Chemistry, 2011, 52: 54-59.
[22] CHEN Wen, WU Jian-qing, XU Qi-ming. The physical properties of materials [M]. Wuhan: Wuhan University of Technology Press, 2010: 47. (in Chinese)
[23] MROZOWSKI S. Semiconductivity and diamagnetism of polycrystalline graphite and condensed ring systems [J]. Physical Review, 1952, 85: 609-620.
[24] JIANG Wen-zhong. Manufacturing process of carbon production [M]. Beijing: Metallurgy Industry Press, 2009: 453. (in Chinese)
[25] KINCHIN G H. The electrical properties of graphite [J]. Proceedings of the Royal Society of London. Series A, 1953, 217: 9-26.
[26] KOVACIK J. Electrical conductivity of two-phase composite material [J]. Scripta Materialia, 1998, 39: 153-157.
[27] HUANG Zi-qian, HE Yue-hui, CAI Hai-tao, XIAO Yi-feng, HUANG Bai-yun. Finite element analysis of thermal residual stresses at cemented carbide rock drill buttons with cobalt-gradient structure [J]. Transactions of Nonferrous Metals Society of China, 2008, 18(3): 660-664.
�������̼�������ϵ����µ�����
�� ��1,2��Ѧ����1,2�������1���� ��1���� ͨ1
1. �����Ƽ���ѧ ұ������̬����ѧԺ������ 100083��
2. �����Ƽ���ѧ ����ұ���¼��������ص�ʵ���ң����� 100083
ժ Ҫ���о���϶�ʡ�����ṹ��ʯī������5�ֹ�ҵ�����������µ����Ե�Ӱ����ɡ����ñ���̽�뷨�ⶨ���ϵ絼�ʣ�ͨ�����徲��ѧ����XRD�������Ͽ�϶�;���ṹ������������������µ絼��(��)ȡ������ȵ絼��(��0)�Ϳ�϶��(��)������֮��Ĺ�ϵ���û����������۵�ָ����ϵģ�ͽ���������������0��С���϶�أ���ȡ���ڲ��ϵ����ߴ�Ͳ��࣬�ʿɷ�ӳ���ϱ��������ԣ�ָ��n���������ϲ����йأ��������о���5���������ɽ���ȡƽ��ֵ4.65�����⣬ʯī�������ıȵ絼��(��0)���ɻ���������������ʯī����������á�
�ؼ��ʣ�̼�����������ԣ���϶�ʣ�����ṹ��������
(Edited by Yun-bin HE)
Foundation item: Project (20110006110003) supported by the Research Fund for the Doctoral Program of Higher Education of China; Project (51434005) supported by the National Natural Science Foundation of China
Corresponding author: Ji-lai XUE; Tel: +86-10-62333730; E-mail: jx@ustb.edu.cn
DOI: 10.1016/S1003-6326(15)64019-5
Abstract: The ambient electrical conductivity (AEC) of carbon cathode materials was investigated in respect to their open porosity, crystal structure and graphite content using hydrostatic method, four-probe technique and X-ray diffraction (XRD), respectively. The AEC is proportional to the specific conductivity (��0) and the exponential of (1-��) (�� is porosity) by a quasi-uniform formula based on the percolation theory. The ��0 can reflect the intrinsic conductivity of the carbon cathodes free of pores, and it depends on the mean crystallite size parallel to the layer (002). The exponent n is dependent on the materials nature of the cathode aggregates, while an averaged value, 4.65, can practically work well with 5 types of cathode materials. The calculation of ��0 can be extended to the graphitic cathodes containing different aggregates using the simple rule of mixture.
