

Influence of different Fe sources and concentrations on formation of magnetosomes in Acidithiobacillus ferrooxidans
LIU Wen-bin(���ı�), WU Hai-yan(�亣��), LIU Xue-duan(��ѧ��), LIU Xin-xing(������)
Department of Bioengineering, School of Minerals Processing and Bioengineering,
Central South University, Changsha 410083, China
Received 20 September 2008; accepted 5 November 2008
Abstract:
The whole genome of strain Acidithiobacillus ferrooxidans ATCC 23270 was analyzed by bioinformatics and some homolog genes of functional ones in magnetotactic bacteria were available. To obtain further knowledge of the magnetosomes formation mechanisms of Acidithiobacillus ferrooxidans in response to different Fe sources and concentrations, temporal gene expression profiles of mpsA, magA, mamB and thy were examined by using Real-time quantitative reverse transcription-PCR. The microbial formation of magnetosomes and magnetotaxis was also studied under different Fe2+ concentration. The results indicated that ORF numbers of 1622, 0276, 1124 and 2572 of the ATCC 23270 were homologous with mpsA, thy, magA and mamB genes in magnetotactic bacteria. The expression levels of mpsA, magA and mamB were directly related to ferrous concentration, and the highest expression level at 150-200 mmol/L ferrous was gained. The number of magnetosomes in ATCC 23270 and the magnetotaxis of cells were significantly related to the expression level of these three genes, suggesting that these genes were related with the iron transport during the process of magnetosome formation in A. ferrooxidans.
Key words:
Acidithiobacillus ferrooxidans; magnetosome; Real-time quantitative reverse transcription-PCR; magnetophoresis;
1 Introduction
The magnetosome formed by biologically controlled mineralization method could be an ideal kind of bio-nano-magnetic material[1-3], because of its specific properties such as superior crystalline, good biocompatibility, uniform nano-size, non-agglomeration and special magnetic characteristics[4]. The researchers discovered that Acidithiobacillus ferrooxidans (A. ferrooxidans) is able to synthesize intra-cellular electron-dense magnetite[5], which makes it possible to obtain bio-nano-magnetic particles by cultivating A. ferrooxidans[6-7]. Actually, the research of A. ferrooxidans was mainly focused on the bioleaching process, and there is few report about the ability of intracellular magnetosome formation in A. ferrooxidans.
In this work, the genes involved in the biomineralization of magnetosome in magnetotactic bacteria were investigated, and their homologous genes in A. ferrooxidans strain ATCC 23270 were found. To obtain further knowledge of the magnetosomes formation mechanisms of A. ferrooxidans ATCC 23270, temporal gene expression profiles in response to different kinds of Fe ions and different ferrous concentrations were examined by using reserved transcript PCR, and the phenotypes were investigated by using semisolid-plate magnetophoresis method and transmission electron microscopy.
2 Experimental
2.1 Bioinformatics
Since the whole genome sequence of A. ferrooxidans ATCC 23270 is available online (http://cmr. tigr.org/ tigr-scripts/ CMR/ shared/ AllGeneList.cgi? sub_ org_val=gtf&feat_type=ORF) and there are lots of studies already about the genes and proteins involved in magnetosome formation in magnetotactic bacteria[8-9], the homologous genes and proteins were obtained by using BLAST method (http://tigrblast.tigr.org/cmr-blast/), and identities between homologous genes and other bioinformatics information were obtained online from NCBI (http://www.ncbi.nlm.nih.gov).
2.2 Bacterial strains and growth conditions
A. ferrooxidans strain ATCC 23270 was bought from American Type Culture Collection (ATCC). A. ferrooxidans ATCC 23270 was grown at 30 �� under oxic conditions (170 r/min) in modified 9K[10-11] using elemental sulfur as energy source. The number of cells was counted directly in a hemocytometer on a Galen�� Microscope. Unless otherwise stated, all experiments were performed in triplicate. The semisolid-plate magnetophoresis and ISP semisolid medium were manipulated as described previously[12].
2.3 Different ion sources and ferrous concentration shock
In different Fe source treatment experiments, when the cells grow to logarithmic-phase, cells were collected and shocked by FeSO4��7H2O and FeCl3 (final concentration of 20 mmol/L), respectively, with non- shock cells as the control. The cells were treated for 1 h at 30 �� and 170 r/min. After 1 h, the cells treated by different Fe sources were centrifuged for 10 min at 12 000 r/min and 4 �� (Eppendorf, Wesbury, NY, USA). The medium supernatant was removed instantly and the cell pellets were immediately processed for RNA extraction. In different ferrous concentration treatment, other steps were the same as above except that cells were shocked by FeSO4��7H2O 0.05 (benchmark), 2, 50, 100, 150, 200, 250, 300 and 400 mmol/L, respectively.
2.4 Total RNA extraction, purification, and cDNA generation
TRIzol reagent (Invitrogen, Carlsbad, CA, USA) was used to extract total cellular RNA, which was then treated with RNase-free DNase I (QIAGEN, Valencia, CA, USA) to digest residual chromosomal DNA and subsequently purified with a QIAGEN RNeasy Mini kit. Total cellular RNA was quantified at OD260 and OD280 with a NanoDrop ND-1000 spectrophotometer (NanoDrop Technologies, Wilmington, DE, USA). The purified RNA from each sample was served as the template to generate cDNA by using SuperScriptTM��and random primer kit (Invitrogen, Carlsbad, CA, USA).
2.5 Primer pairs design
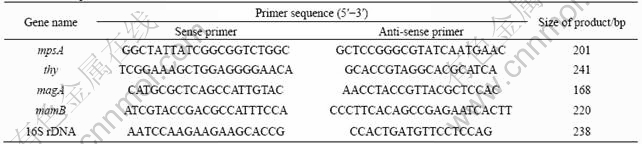
Primer pairs were designed by using Primer Premier 5 software and were synthesized by Shanghai Sangon (China). All primer pairs of genes are summarized in Table 1. The fragments were amplified by using the following cycling conditions: 15 s denaturation at 95 ��, 30 s annealing at 57 ��, and 30 s extension at 72 ��, along with an initial 5 min denaturation at 95 �� and a final extension reaction at 72 �� for 10 min The quality of the amplified products was checked by 1.0% agarose gel electrophoresis. Amplified DNA fragment was considered correct if the gel contained a single product of the expected size.
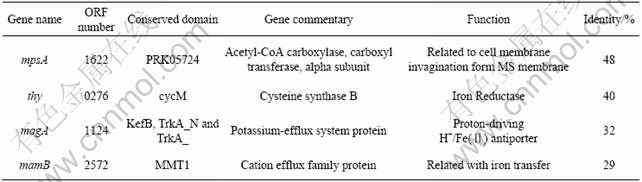
Table 1 Information of homologous genes
2.6 Real-time quantitative reverse transcription-PCR (RT-PCR)
In different Fe source treatment experiments, the products of genes were amplified by PCR with cDNA as the template. In the negative control, the purified RNA was used as the template. The reserved transcription PCR results were checked by 1.0% agarose gel electrophoresis.
In different ferrous concentration treatments, the products of genes amplified by PCR with genomic DNA as the template were used to construct the standard curves. Each RT-PCR mixture (final volume 50 ��L) contained 25 ��L of SYBR? Green Realtime PCR Master Mix (Toyobo, QPK-201) of Taq DNA polymerase, dNTP, MgCl2, and SYBR Green I dye, 2 ��L of a 10 mmol/L solution of the sense/anti-sense primer, 10 ��L of cDNA template, and 11 ��L of nuclease-free water. The reactions were performed with 40 cycles of 30 s at 94 ��, 15 s at 55 ��, and 30 s at 72 �� and monitored in an iCycler iQ Real-time PCR detection system (Bio-Rad, Hercules, CA, USA). These standard curves were derived from PCR products representing each gene with genomic DNA as the template and used to convert threshold crossings to logarithmic copy numbers. The expression of each gene was determined from three replicates on a single real-time PCR experiment. The expression ratio was recorded as the fold difference in quantity of real-time PCR product from samples grown at the treatment versus control concentration. Relative abundance of each gene vs a constitutively expressed gene (16S rDNA) was determined.
2.7 Transmission electron microscope analysis
After 24 h incubation, the cells treated by 0.05 and 200 mmol/L FeSO4��7H2O were collected at 12 000 r/min for 15 min and the pellets were washed by distilled water for three times. Then the cells were thin-sectioned (70 nm) and put onto cuprum grids, and the number of magnetic particles under each treatment was investigated under transmission electron microscope (JEM1230, Japan, JEOL Co).
2.8 Magnetotaxis observation with different ferrous concentration
Semisolid-plate magnetophoresis is as follows[12]. The collected cells grown on elemental sulfur were treated by 0.05 and 200 mmol/L FeSO4��7H2O for 8 h, respectively. Then both treatments were inoculated to the middle of semisolid-plates (containing 0.05 and 200 mmol/L FeSO4��7H2O, respectively) and the plates were incubated at 30 �� for several days. Permanent magnets were put on one side of the plates to offer magnetic force, and the plates without artificial magnetic field (only in the geomagnetic field) were set up as the control.
3 Results and discussion
3.1 Bioinformatics analysis
The whole genome of A. ferrooxidans ATCC 23270 was analyzed. The results indicated that proteins of ATCC 23270 encoded by 8 ORFs of 1622, 0276, 1124, 2572, 1403, 1439, 1143 and 2403 (the ORF numbers accord to sequencing results on TIGR website) were homologous with MpsA, Iron Reductase(Thy), MagA, MamB, Bfr, MamE, MamK and MamH in magnetotactic bacteria, respectively. And the four high identity proteins(MpsA, Thy, MagA and MamB) were selected (Table 1) to be the target genes in which the response to different Fe sources and concentrations shock was tested. All primer pairs for those genes are summarized in Table 2.
Table 2 Primer pairs used for real-time PCR
ULLRICH et al[13] analyzed the whole genome of the magnetotactic bacteria type strain M. gryphiswaldense MSR-1, and the results indicated that 130 kb region (genomic island) may contain all the genes involved in magnetosomes formation, and in another type strain of magnetotactic bacteria Magnetospirillum sp. strain AMB-1, this kind of 98 kb genomic region was found as well[14]. In this work, we found out some genes related to magnetosomes formation, but we did not find this kind of conserved genomic region in the whole genome of A. ferrooxidans ATCC 23270, and the homologous genes (mpsA, thy and magA) found in A. ferrooxidans ATCC 23270 were not in the conserved genomic island of the magnetotactic bacteria either. According to these results, we suggested that ORF numbers of 1622, 1124, 2572 and 2572 in A. ferrooxidans ATCC 23270 were related to the formation of magnetosomes in A. ferrooxidans, but the formation mechanism of magnetosomes in A. ferrooxidans might be different from that in magnetotactic bacteria.
3.2 Growth curves
The growth curve of Acidithiobacillus ferrooxidans ATCC 23270 is shown in Fig.1. According to the growth curve, the 8th day after inoculation was selected to do the different Fe ion source and concentration treatment.
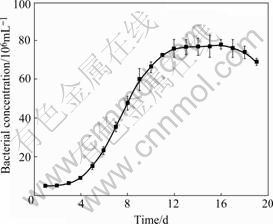
Fig.1 Growth curve of Acidithiobacillus ferrooxidans ATCC 23270
3.3 Quality of total RNA
The total RNA ratio of OD260 to OD280 quantified by the NanoDrop? ND-1000 spectrophotometer (NanoDrop Technologies) was about 1.95-2.05. The integrality of total cellular RNA was checked by 1.0% agarose gel electrophoresis, and imaged by BioSense SC-810 Gel Documentation System (Shanghai Bio-Tech Co., Ltd, China) (Fig.2).
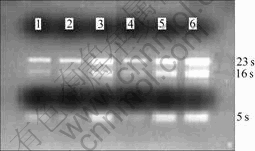
Fig.2 Electrophoresis of total RNA
3.4 Expression of genes of A. ferrooxidans ATCC 23270 to different Fe sources and concentrations shock
Firstly, the temporal gene expression profiles were examined in cells subjected to 20 mmol/L FeCl3 and FeSO4��7H2O shock. In different Fe source treatment, there was significant difference in gene expression (Fig.3). The results indicated that the expressions of mpsA, magA and mamB were related to Fe2+ but not to Fe3+ or elemental sulfur. And the expression of thy gene was constant in either Fe2+ or Fe3+ shock and even Fe starvation control. This result is consistent with the result in magnetotactic bacteria[15].
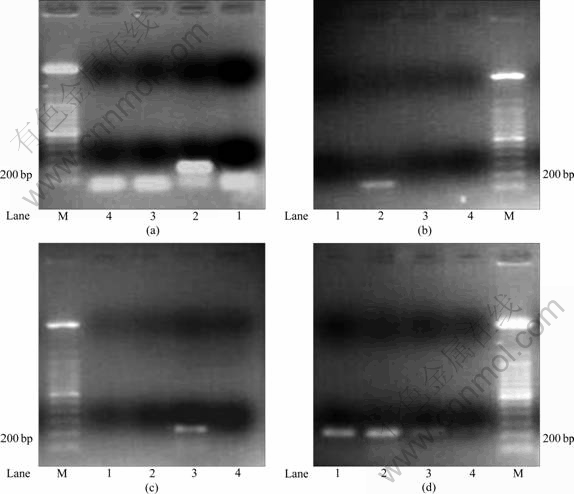
Fig.3 RT-PCR analysis results of different Fe ion shock response of target genes (Lane 1��Iron starvation control; Lane 2��Fe3+ shock; Lane 3��Fe2+ shock; Lane 4��Negative control; Lane M��100 bp marker): (a) mpsA; (b) magA; (c) mamB; (d) thy
Since the expressions of mpsA, magA and mamB were related to Fe2+, the responses of mpsA, magA and mamB gene to different concentrations of Fe2+ stress were also analyzed. In contrast to steady-state or single-concentration-point studies, concentration course experiments are particularly valuable in providing insight into the mechanism regulating a bacterial response to stress and providing useful data for generating computational models of stress response pathways.
Fig.4 shows the relative expression of mpsA, magA and mamB gene under different concentrations of Fe2+ stress. In iron-deficient and iron-excessive conditions, the expressions of genes were decreased. The results indicated that these genes get the highest expression at 150-200 mmol/L concentration of Fe2+ shock.
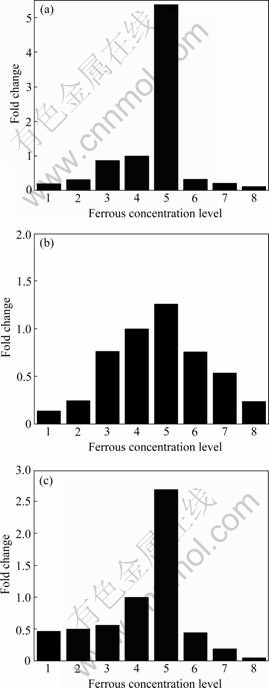
Fig.4 Expression ratio of genes of A. ferrooxidans ATCC 23270 to Fe2+ shock at different concentrations (Ferrous concentration levels 1, 2, 3, 4, 5, 6, 7 and 8 indicating FeSO4��7H2O concentrations of 0.05, 2, 50, 100, 150, 200, 250, 300 and 400 mmol/L, respectively): (a) mpsA; (b) magA; (c) mamB
3.5 Transmission electron microscope observation
Transmission electron microscope (TEM) images (Fig.5) showed the numbers of magnetosomes in different ferrous concentration treated A. ferrooxidans ATCC 23270 cells. Under both ferrous concentrations (0.05 and 200 mmol/L), A. ferrooxidans ATCC 23270 could synthesize intracellular electron-dense magnetosomes (indicated by arrows). Under the condition of higher ferrous concentration number (200 mmol/L), the magnotosome was much more than that under the lower ferrous concentration (0.05 mmol/L), which suggested that the ferrous concentration could directly affect the number of magnetosomes synthesized in the A. ferrooxidans ATCC 23270 cells.
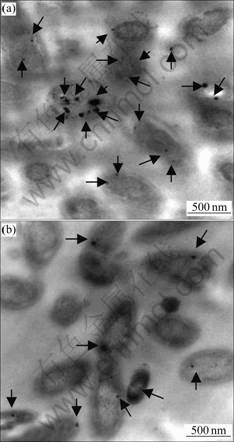
Fig.5 TEM images showing magnetosomes from cells of different concentrations of Fe2+ shock (Arrows indicate magnetosomes): (a) 200 mmol/L Fe2+ shock; (b) 0.05 mmol/L Fe2+ shock
3.6 Magnetotaxis observation
During the process of cultivation under the field of a permanent magnet, the sensitivities of the cells to magnetic field were also observed. The semisolid-plate magnetophoresis results (Fig.6) indicated that cells treated by 0.05 and 200 mmol/L ferrous were able to orient and migrate to the magnet in artificial magnetic field but could not orientedly swim under the geomagnetic field.
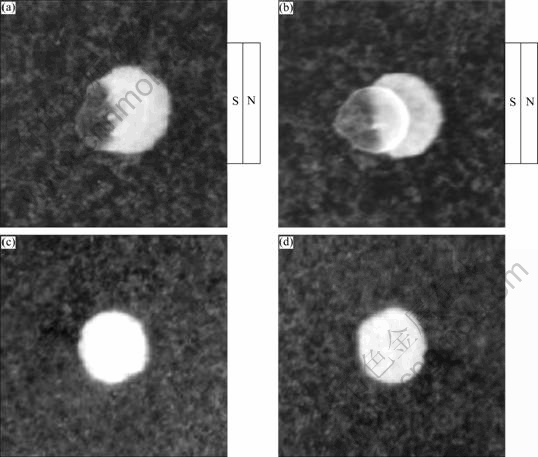
Fig.6 Semisolid-plate magnetophoresis results: (a, b) 0.05 and 200 mmol/L FeSO4��7H2O plates in artificial magnetic field; (c, d) 0.05 and 200 mmol/L FeSO4��7H2O plates in geomagnetic field
These phenomena were due to the fact that magnetosomes in A. ferrooxidans ATCC 23270 were not arranged by lines so that the cells could not orient under weak magnetic field. And there were significant different movement ranges between 200 mmol/L and 0.05 mmol/L ferrous treatments. The trend of cells swimming along magnetic field lines was enhanced by increasing the concentration of Fe2+. According to the results above, cells treated by 200 mmol/L ferrous contained more magnetosomes than those treated by 0.05 mmol/L. It could be concluded that the number of intracellular magnetosomes could directly affect the ability of the orienting movement, and the magnetosomes in A. ferrooxidans ATCC 23270 made it possible for the cells to migrate along with artificial magnetic force.
4 Conclusions
1) Four high identity homologous genes mpsA, magA, thy and mamB involved in magnetosomes formation of magnetotactic bacteria were found in A. ferrooxidans ATCC 23270.
2) The expression levels of mpsA, magA and mamB were related to the concentration of Fe2+. In the iron-deficient and iron-excessive conditions, the expression of genes was decreased. At 150-200 mmol/L concentration of Fe2+, these genes reach the highest expression.
3) The number of intracellular magnetosomes and the magnetotaxis trend were studied under different ferrous concentration treatment, and the results indicated that the less the ferrous, the less the magnetosomes were synthesized and the weaker the magnetotaxis trend was.
4) The results indicated that when mpsA, magA and mamB were in lower expression levels, the cells synthesized less magnetosomes, suggesting that these genes were related with the iron transport during the process of magnetosome formation in A. ferrooxidans and the expression level of these genes would directly influence the number of intracellular magnetosomes.
References
[1] LOWENSTAM H A. Minerals formed by organisms [J]. Science, 1981, 21: 1126-1131.
[2] MOSKOWITZ B M, FRANKEL R B, BAZYLINSKI D A. Rock magnetic criteria for the detection of biogenic magnetite [J]. Earth and Planetary Science Letters, 1993, 120: 283-300.
[3] FRANKEL R B, BAZYLINSKI D A, SCHULER D. Biomineralization of magnetic iron minerals in bacteria [J]. Supramolecular Science, 1998, 5: 383-390.
[4] SCHULER D, FRANKEL R B. Bacterial magnetosomes: Microbiology, biomineralization and biotechnological applications [J]. Appl Microbiol Biotechnol, 1999, 52: 464-473.
[5] LIU Xin-xing, XIE Jian-ping, LIU Wen-bin, HUO Qiang, QIU Guan-zhou. Research on isolating bacteria by using magnetophoresis [J]. China Biotechnology, 2006, 26(4): 70-74.
[6] KELLY D P, WOOD A P. Reclassification of some species of Thiobacillus to the newly designated genera Acidithiobacillus gen. nov., Halothiobacillus gen. nov and Thermithiobacillus gen. nov [J]. International Journal of Systematic and Evolutionary Microbiology, 2000, 50: 511-516.
[7] TEMPLE K L, COLMER A R. The autotrophic oxidation of iron by a new bacterium: Thiobacillus ferrooxidans [J]. Journal of Bacteriology, 1951, 61: 605-611.
[8] MATSUNAGA T, OKAMURA Y. Genes and proteins involved in bacterial magnetic particle formation [J]. Trends Microbiol, 2003, 11(11): 536-541.
[9] GRUNBERG K, MULLER E C, OTTO A, RESZKA R, LINDER D, KUBE M, REINHARDT R, SCHULER D. Biochemical and proteomic analysis of the magnetosome membrane in Magnetospitillum gryphiswaldense [J]. Applied and Environmental Microbiology, 2004, 70(2): 1040-1050.
[10] AMARO A M, CHAMORRO D, SEEGER M, ARREDONDO R, PEIRANO I, JEREZ C A. Effect of external Ph perturbations on invivo protein-synthesis by the acidophilic bacterium Thiobacillus-ferrooxidans [J]. Journal of Bacteriology, 1991, 173: 910-915.
[11] SCHIPPERS A, ROHWERDER T, SAND W. Intermediary sulfur compounds in pyrite oxidation: Implications for bioleaching and biodepyritization of coal [J]. Applied Microbiology and Biotechnology, 1999, 52: 104-110.
[12] LIU Xin-xing, LIU Wen-bin, YAN Ying, WU Hai-yan. Isolation of Acidithiobacillus ferrooxidans by using solid-plate magnetophoresis [J]. China Biotechnology, 2008, 28(3): 79-83.
[13] ULLRICH S, KUBE M, SCHUBBE S. A hypervariable 130-kilobase genomic region of Magnetospirillum gryphiswaldense comprises a magnetosome island which undergoes frequent rearrangements during stationary growth [J]. Journal of Bacteriology, 2005, 187(21): 7176-7184.
[14] FUKUDAA Y, OKAMURAB Y, TAKEYAMA H, MATSUNAGA T. Dynamic analysis of a genomic island in Magnetospirillum sp. strain AMB-1 reveals how magnetosome synthesis developed [J]. FEBS Letters, 2006, 580: 801-812.
[15] NOGUCHI Y, FUJIWARA T, YOSHIMATSU K, FUKUMORI Y. Iron reductase for magnetite synthesis in the magnetotactic bacterium Magnetospirillum magnetotacticum [J]. J Bacteriol, 1999, 181(7): 2142-2147.
Foundation item: Project(50774102) supported by the National Natural Science Foundation of China; Project(2004CB619201) supported the National Basic Research Program of China; Project(1343-77341) supported by Innovative Group of Education of Graduation Student of Central South University, China
Corresponding author: LIU Xin-xing; Tel: +86-731-8879815; E-mail: xinxingliu@hotmail.com
