
J. Cent. South Univ. Technol. (2007)02-0271-07
DOI: 10.1007/s11771-007-0054-8 ![]()
Hybrid scheduling model and analysis of performance for
switched industrial Ethernet
HU Chun-hua(������) 1, 2, WU Min(�� ��)1, LIU Guo-ping(����ƽ)1, WANG Si-chun(���Ĵ�)2
(1. School of Information Science and Engineering, Central South University, Changsha 410083, China;
2. Department of Computer and Electronic Engineering, Hunan Business College, Changsha 410205, China)
Abstract:
The fact that outburst traffic in industrial Ethernet was focused on that would bring self-similar phenomenon leading to the delay increase of the cyclical data, and a hybrid priority queue schedule model was proposed in which the outburst data was given the highest priority. Some properties of the self-similar outburst data were proved by network calculus, and its service curve scheduled by the switch was gained. And then the performance of the scheduling algorithm was obtained. The simulation results are close to those calculated by using network calculus model. Some results are of actual significance to the construction of switched industrial Ethernet.
Key words:
switched industrial Ethernet; scheduling model; self-similar; network calculus ��
1 Introduction
Analyzing and calculating the maximum delay of switched industrial Ethernet, is one of the focus problems in the domain of real-time communication in industrial Ethernet, and is significant for evaluating whether it is adaptable to the industrial field communication[1]. The traditional method of analyzing the delay of network, adopting Poisson or Bernoulli distribution to show the property of data arrival, doesn��t fit for transmitting data by industrial field devices[2]. The method of analyzing delay by network calculus is maturely applied to several research domains[3-6]. However it is unfit for the network based on priority. Ref.[7] made performance analysis of switched Ethernet on the basis of scheduling priority level of cyclic data and presented a method of calculating the maximum delay by network calculus.
The above-mentioned methods assumed that the network data arriving in the same interval procedure without considering about the strict delay requirement as well as the self-similar property of outburst data. Since 1993, it has been found that the network traffic doesn��t satisfy uniform arrival procedure instead of self-similar and long-correlative properties. The character of network flow is that once there is outburst data, terrible things such as long time generation, heavier network load and worse network performance will occur[8]. These behaviors can be found in many industrial field occasions. Outburst data often shows urgent things (such as warning information) of correlation character (for example adjacent devices and correlative devices will be influenced by as well). In this case, outburst data in the devices will increase instantaneously while very rarely in normal scene. It is accordance with the self-similar phenomenon. In previous researches, the self-similar outburst data flow wasn��t considered. However the situation requires much stricter time delay than before in industrial Ethernet. In this paper, a scheduling model based on a outburst data priority was proposed, some properties of the self-similar outburst data were proved, the service curve of the self-similar outburst data scheduled by the switch was gained, and the method of calculating maximum delay was presented. The simulation results are accordance with the theory results based on the conclusion of this paper.
In this paper, some properties were proved by utilizing network calculus, considering about the outburst real-time data in industrial Ethernet and analyzing it according to the self-similar data flow character, and a calculation method of the maximum delay which is fit for industrial field real-time communication was presented.
2 Scheduling algorithm
In switched industrial Ethernet��the data needed to be transferred and can be divided into three categories according periodic and importance, such as outburst data, cyclical data and non-real-time data. Among these three categories, competition will be happened between the outburst real-time data and the cyclical real-time data when the network is busy channel. Especially the outburst real-time data always come in unexpectedly, with long data frame and the long existing time, and often accord with the feature of self-similar network flow. Therefore it is supposed that the outburst data of every collection point in switched industrial Ethernet all obey the feature of self-similar data flow, which parameter was set as H, and considered that there is a rectifier in every collection point, which is different from the leaky barrel shaper used before. In this paper, Fractal Leaky Bucket proposed in Ref.[9] was used instead of leaky barrel shaper of Tspec��s rule. It will be proved in the third chapter that the conclusion based on the Fractal Leaky Bucket will not affect the delay of network. Thus a mathematical expression for outburst network flow can be derived as follows
![]() (2)
(2)
![]() (3)
(3)
where r denotes the long-term average speed, �� denotes a positive constant (for example ��= 6), and �� is the standard deviation, H(1/2��H��1) is the parameter of self-similar.
The cyclical data and non-real-time data can be expressed with the following mathematical expression:
![]() (4)
(4)
In view of different requirements of the three categories of data in the network, the non-grab priority dispatch algorithm based on IEEE802.1p was used in the switch. The priority of the outburst data, the cyclical data and the non-real-time data was set separately to 3, 2 and 1. In the output port of the switch, the dispatcher with the outburst real-time data is entrusted the highest priority for visiting to the channel by the dispatcher. The cyclical real-time data is allowed to be transferred while the queue of the outburst real-time data is empty, and the non-real-time data is allowed to be transferred only when the queues of the cyclical real-time data and the outburst real-time data are empty. The model of scheduling is shown in Fig.1.

Fig.1 Scheduling model of outburst data priority
Algorithm 1 The outburst real-time data priority scheduling algorithm
for (each received data flow ��i) do
{ //do operations to every data stream received from input port
Switch (![]() .priority)
.priority)
// Judge priority of data stream and insert it to different queue
Catch 3: insert it into tail of queue 3;Catch 2: insert it into tail of queue 2;
Catch 1: insert it into tail of queue 1; }
for (each schedule) do
{ //Judge as follows and do operations to every scheduling of output port
if (queue 3 is not null) then schedule queue 3
else if (queue 2 is not null) then schedule queue 2
else if (queue 1 is not null) then schedule queue 1
}
3 Network calculus model
3.1 Basic concept of network calculus
The network calculus, developed by CRUZ[10-11], BOUDEC[3] and CHANG[9]��is a kind of new mathematical tool for quantitatively analyzing performance of network formation system. It can provide certainty analysis for performance of network queuing, and solve the boundary problem of certainty performance in queuing network. Some definitions and lemmas about network calculus are as follows.
Definition 1 Generalized increasing function set
If
![]()
then F is named the generalized increasing function set.
Definition 2 Minimum add convolution
![]() f, g��F��the calculation for the minimum add convolution of function f and g is
f, g��F��the calculation for the minimum add convolution of function f and g is
![]()
Definition 3 Sub-add function
Supposing f ��F and ![]() s, t��0��if f(t+s)��f(t)+ f(s)��then f is named the Sub-add function.
s, t��0��if f(t+s)��f(t)+ f(s)��then f is named the Sub-add function.
Definition 4 Minimum add except convolution
Giving ![]() f, g��F��the minimum add except convolution of function f and function g is
f, g��F��the minimum add except convolution of function f and function g is
![]()
Lemma 1 ![]()
Definition 5 Horizontal Deviation Giving ![]() f, g��F��the horizontal deviation is the larger horizontal distance between function f and function g.
f, g��F��the horizontal deviation is the larger horizontal distance between function f and function g.
Definition 6 Virtual delay
d(t)=inf{�ӡ�0: R(t)��R *(t+��)}
Definition 7 Arrival curve
Giving a function ![]() , and
, and ![]() , if t��0 the input function R satisfies R��
, if t��0 the input function R satisfies R��![]() , then �� is called the arrival curve of R.
, then �� is called the arrival curve of R.
Definition 8 Service curve
Giving![]() ,
,![]() , if it satisfies R*��
, if it satisfies R*��![]() , then it is called that the system provides the service curve ��(t) for the data flow.
, then it is called that the system provides the service curve ��(t) for the data flow.
Lemma 2 The limitation of the virtue delay satisfies d(t)��h(��,��).
Lemma 3 The total service curve �� of the system connected by system 1 and system 2, is the minimum add convolution of the service curve provided by system 1 and the service curve provided by system 2, that is, ![]() .
.
3.2 Features of outburst data based on self-similar characteristic
Supposing that the total service ability of switch can be described by a service curve with the delay T and the service speed R:
Using Fractal Leaky Bucket proposed in Ref.[9] instead of leaky barrel shaper of Tspec��s rule in this paper, the mathematical expression is shown in Eqn.(1).
The topology graph consisting of FLB (Fractal Leaky Bucket) and multi-switches is shown in Fig.2. The data transmitted by a FLB in the data collection node, connect the controller through several connected switch. The flow rule parameter of FLB satisfies Eqn.(1), the service curve of switch satisfies the Eqn.(5).
![]()
Fig.2 Topology graph
The following theorems 1-3 deduces the conclusion that the FLB will not increase the limitation of delay and give the point-to-point certainty limitation of the connected switch.
Theorem 1 Greed FLB will not increase the limitation of delay.
Proof Giving the service curve ��r,��,H(t) and the arrival curve �� of the Greed FLB, the output curve is the arrival curve �� of the next switch.
According to lemma 1:
![]()
Because �áݦ�, it can be concluded with definition 5:
![]()
It can be proved easily by Eqn.(1) and definition 4 that, ��(t) satisfies the sub-add rule, also, ��(0)=0, so ![]() ��. Therefore,
��. Therefore,
![]()
According to definition 6, thus,
![]() ,
,
so it can be deduced as

Therefore, Greed FLB will not increase the limitation of delay.
Theorem 2 Top limitation of single node
Supposing that a similar data flow with the arrival curve ��r,��,H passes through a switch whose service curve is ��R,T, and r��,H d(t)��T+b��,H/R Proof Considering lemma 3 and definition 5 and definition 6, it can be deduced that:
So, Then out of Eqn.(1) and Eqn.(5), it can be concluded that the delay of switch satisfies a Also, r��,H d(t)��T+b��,H/R Utilizing the conclusion of theorem 1, it can be proved that the delay of a single point is equal to the delay of a switch. Theorem 3 Top limitation of point-to-point delay Supposing that the similar data flow with a serial arrival curves d(t)�� Proof Using mathematical induction, we can obtain: 1) When i=1, it can be deduced by Eqn.(6), then we can obtained d1(t)�� Out of theorem 2, the expression given above is right. 2) Supposing theorem 3 is right when i=n-1, that is: 3) The case that i=n will be proved. The service curve It can be deduced by theorem 2 that the top limitation of output delay in the nth switch is
Evidently, the total n nodes�� point-to-point delay d(t) is equal to the sum of the former n-1 nodes�� delay dn-1(t) and the nth node��s delay dn(t), that is d(t)= dn-1(t)+ dn(t) (9) It can be deduced from Eqns.(7)-(9) as
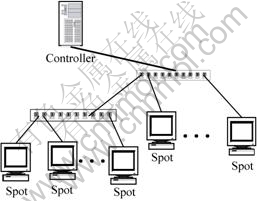
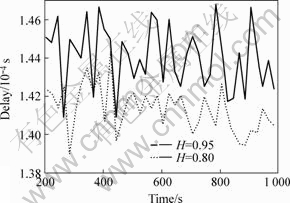
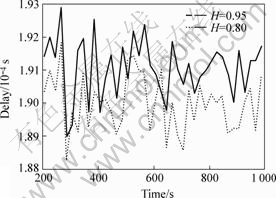
The definition of the parameters used in the above expression can be seen in Eqns.(2), (3) and (5), the above expression indicates that theorem 3 is right when i=n, so the theorem 3 is proved. 3.3 Service curve and delay calculation of switch In this section, according to the amalgamative scheduling algorithm, we will deduce the service curve and service delay of the service queue, and service curve of the single data flow, using the conclusion given in the above paragraph. The data structure F of a micro data flow could express like that: typdef struct f{ int priority // The priority of the micro data flow int length // The longest data frame float H // The similar parameter �� // The other parameters } F We defined ��k={fi |fi. priority=k} to express the gathering of micro data flow with the priority of k: to mean the gathering of micro data flow with the higher priority than k: to denote the gathering of micro data flow with the higher or the same priority with k: to signify the longest data frame with the lower priority than k. Supposing the micro data flow with the priority of k and with the arrival curve as expression 1 and expression 4, it can be gotten Ak(t)={ to express the arrival curve of the micro data flow with the priority of k: and AHk(t) ={ to denote the arrival curve of the micro data flow with the higher priority than k. Consider data flow ��k first, and deduce the service curve of ��k, while ��k and ��h receive the server of switch by the method of non-grab priority. Give that the total service ability of the switch is R, that is, the total service curve of all data flow is Then conduce the service curve of mix flow So, the service curve of data flow ��k is Since = Then ��( (12) The service speed and the service delay parameters are S( D( Then we studied micro data flow The store-and-forward way in switch leads to the service delay to increase a data frame transferring additional time. Therefore, the service speed and service delay of S(fk)= S( D(fk)=D( 4 Performance evaluation 4.1 Structure of switched Ethernet An example for maximum network delay in switched industrial Ethernet based on network calculus is given as follows. The two-levels tree structure shown in Fig.3 is adopted by network module, imitating the center controller with the main station, and imitating the spot equipments with stations. Supposing the port number of switch is 10, and every secondary switch connects with 10 substations. Giving that the speed of top port in the two level switches, which adopt the store-and-forward messaging mode, is 100 Mbps. To simplify the procedure of analysis, we suppose that every substation obeys to the same rule. The size of Ethernet frame used in IEEE802.1p is between 64 bytes and 1522 bytes. In the Ethernet based on CSMA/CD, 64 bits synchronization information and 96 bits slot information between two frames would be considered when calculating arrival curve[12]. Fig.3 Topology of switched industrial Ethernet Considering the outburst data, it was supposed that r, the long-time average speed, is equal to 1008 bytes/s; ��=6; ��, the standard deviation, is equal to 20; and H, the parameter of self-similar, is equal to 0.8. Using Fractal Leaky Bucket, the arrival curve can be expressed as ��3(t)= (1 020t +28) It was suppose that the cyclical data send an Ethernet frame in every 20 ms, then the arrival curve is ��2(t)=(4 200t+84). The common information adopts leaked barrel shaper to control its traffic. Its data frame is at an average speed of 672 bytes/s, and it sends at most 8 continual data frames. So the arrival curve is ��1(t)=(800t+12 336) 4.2 Calculation of maximum network delay We used the conclusion deduced in section 3 to calculate the maximum network delay of outburst real-time data. For the secondary switch, firstly data flow ��3 is the study object and n is marked as the number of substations which are adjacent to the secondary switch(n=10). Considering the outburst real-time data flow, using Eqns.(13) and (14) and corrective parameters, we can deduce as S( D( = with regard to the cyclical real-time data, S( = 1. 047 7��108 (bps) D(��2)= ( =1.358 7��10-4 (s) When turning to the outburst little data flow f3, it can be deduced as S(f3)=S( =S( =1.047 6��108 (bps) And the following is for the cyclical micro data flow: S(f2) = S(��2)-(n-1)r2 =1. 045��108 (bps) D(f2)=D(��2)+( =1.999 8��10-4 (s) So we can also calculate the service curve and delay of every data flow in 1-level switch, using the same formula and method given above, and compute bounds on delays of point-to-point service and the maximum network delay of outburst data flow and cyclical real- time data flow. 5 Simulation and analysis 5.1 Experimental data generation The self-similar tasks through overlaying lots of independent ON/OFF source were generated[13-14]. Thus we can gain an array named ON/OFF[][32], with the size of M*N in a PC, and divide it into M groups that every group corresponds to a ON/OFF data source, and then every data source alternates N times. Set ON/OFF[] for every data source with the time when each alternation is happening. Then impel the time axis to generate an overlaid task array data[i], stepping g units every time, which is the minimum graduation of the time axis. Now we could judge that which data sources have happened ON/OFF alternation according to the value of ON/OFF[]. Then record the case to data[i], signifying the required data number of the ith time slot. The distribution of the length about ON and OFF is Pareto distribution with the parameter ��, among all the simulation proposed in this paper. Given M=500, and the simulation time is 100 s, and g, the graduation stepped each time, is equal to 10 ms. Then we can gain similar tasks with high level similarity, with H=(3-��) /2. 5.2 Experiment result analysis The switch network shown in Fig.3 is simulated with the parameters given above by using the tools of VC. Initialized the network after 200 ms, the normal state of working is achieved, then analysis the service delay, with the time slot of range between 200 s and 1 000 s. The statistics figure that the delay of burst data flow shown in Fig.4 manifests that the result is approaching to the theoretical analysis. The result shows that the larger the outburst parameter is, and the larger the delay is. Fig.4 Delay of burst data flow The delay of the cyclical data flow is shown in Fig.5. It is accordance with the theoretical analysis. The simulation result shows that the larger the parameter H is, and the higher similar the data will be. That is, the more the outburst data is, and the larger the delay of the cyclical data flow is. Fig.5 Delay of periodic data flow 6 Conclusions 1) In many industrial field occasions, the more the outburst data is, and the larger the delay of the cyclical data flow is. The outburst traffic would bring self-similar phenomenon. 2) Some features of self-similar outburst data after fractal shaped are derived by the network calculus, and the maximum delay of real-time data in the switched industrial Ethernet with typical topology is calculated. This shows that the fractal data flow control method is able to regulate the outburst traffic. 3) The simulation result shows that the hybrid scheduling model proposed can satisfy the demand of communication service quality specially as to delay guarantee in the switched industrial Ethernet. References [1] FENG Dong-qin, JIN Jian-xiang, CHU Jian. Study on industrial Ethernet[J]. Information and Control, 2003, 32(3): 219-222 (in Chinese). [2] GEORGES J P, RONDEAU E, DIVOUX T. Evaluation of switched Ethernet in an industrial context by using the network calculus[C]//. 4th IEEE Int Workshop on Factory Communication Systems. Sweden, 2002: 19-26. [3] BOUDEC J L. Network Calculus: A Theory of Deterministic Queuing Systems for the Internet[M]. Berlin: Springer-Verlag, 2002. [4] WATSON K S. Network calculus in star and line networks with centralized communication[R]. Karlsruhe: Fraunhofer IITB, 2002. [5] GEORGES J P, DIVOUX T. Comparison of switched Ethernet architectures models[C]//. 9th IEEE Inter Conf on Emerging Technologies and Factory Automation. Portugal, 2003: 375-382. [6] ZHANG Xin-ming, CHEN Guo-liang. On the computation of end-to-end delay bound in guaranteed service by network calculus[J]. Journal of Software, 2001, 12(6): 889-893. (in Chinese) [7] ZHANG Qi-zhi. Calculation of maximum delay in switched industrial Ethernet based on network calculus[J]. Control and Decision, 2005, 20(1): 117-120. (in Chinese) [8] PARK K, WILLINGER W. Self-similar Network Traffic and Performance Evaluation[M]. New York: Wiley, 2000. [9] CHANG C S. On deterministic traffic regulation and service guarantees: a systematic approach by filtering[J]. IEEE Transaction on Information Theory, 1998, 44(3): 1097-1110. [10] CRUZ R L. A calculus for network delay(part��): network elements in isolation[J]. IEEE Transactions on Information Theory, 1991, 37(1): 114-131. [11] CRUZ R L. A calculus for network delay(part��) network analysis[J]. IEEE Transactions on Information Theory, 1991, 37(1): 132-141. [12] SHEN Gang, XU Xiao-ming,CAI Yun-ze, et al. A new real-time Ethernet MAC protocol for time-critical applications[J]. Journal of Central South University of Technology, 2002, 9(1), 54-59. [13] HU Yan, ZHANG Guang-zhao. Study of the self-similar traffic stream generated by heavy-tailed ON/OFF source model[J]. Journal of Circuits and Systems, 2001, 6(3): 71-77. (in Chinese) [14] SCHWEFEL H P, LIPSKY L. Impact of aggregated self-similar ON/OFF traffic on delay in stationary queuing models, performance evaluation [EB/OL]. [2000-05-28].http://www.control.lth.se/~an/ truetime. Foundation item: Project( 60425310) supported by the National Science Fund for Distinguished Young Scholars of China; Project(05JJ40118) supported by the Natural Science Foundation of Hunan Province, China Received date: 2006-06-18; Accepted date: 2006-08-18 Corresponding author: HU Chun-hua, Lecturer, Doctoral candidate; Tel:+86-731-8832649; E-mail:huchunhua777@163.com (Edited by LI Xiang-qun)![]()


![]() (i=1,2,��,n) passes through a connected system with n switch r��,H whose service curve is
(i=1,2,��,n) passes through a connected system with n switch r��,H whose service curve is ![]() (i=1,2,��,n), and
(i=1,2,��,n), and ![]()
 (6)
(6)![]()
 (7)
(7)
![]() of the nth switch satisfies as
of the nth switch satisfies as![]()
![]() (8)
(8)
 .
.
![]() |fi. priority> k}
|fi. priority> k}![]() |fi. priority> k-1}
|fi. priority> k-1}![]() =max{
=max{![]() .length |
.length |![]() .priority
.priority ![]() |��i.priority=k}
|��i.priority=k}![]() |��i.priority>k}
|��i.priority>k}![]()
![]() provided by switch:
provided by switch:![]() (10)
(10) ![]() (11)
(11)![]() =
=![]() |
|![]() .priority>k
.priority>k![]() t +
t +![]()
![]() ,t) = [R[t-
,t) = [R[t- ![]() /R] -
/R] -![]() t -
t -![]() ]+
]+![]() )=R-
)=R-![]() (13)
(13)![]() ) =(
) =(![]() +
+![]() )/S
)/S![]() (14)
(14)![]() , and deduced the service speed and service delay of
, and deduced the service speed and service delay of ![]() , while all the micro data flow of
, while all the micro data flow of ![]() receives the switch��s service by the FIFS way. The service speed of
receives the switch��s service by the FIFS way. The service speed of ![]() is equal to what the service speed of all k-level data flow subtracts the arrival speed except
is equal to what the service speed of all k-level data flow subtracts the arrival speed except ![]() .
.![]() is
is ![]() )-
)- ![]() +
+![]() (15)
(15)![]() )+(
)+(![]() -
-![]() )
)![]() +
+![]()
![]() (16)
(16)
![]() )=R -
)=R -![]() = R =1.048 5��108 (bps)
= R =1.048 5��108 (bps)![]() ) =(
) =(![]() 3max +
3max +![]() )/S(
)/S(![]() )
)![]() / S(
/ S(![]() )= 1. 161 2��10-4 (s)
)= 1. 161 2��10-4 (s)![]() )=R �C
)=R �C![]() = R -nr3
= R -nr3![]() + n��b3)/ S(
+ n��b3)/ S(![]() )
)![]() )
)![]() +rk
+rk![]() )-(n-1)��r3
)-(n-1)��r3![]() =1.462 6��10-4 (s)
=1.462 6��10-4 (s)![]() -b2)/ S(
-b2)/ S(![]() )+l2/S(
)+l2/S(![]() )
)
Abstract: The fact that outburst traffic in industrial Ethernet was focused on that would bring self-similar phenomenon leading to the delay increase of the cyclical data, and a hybrid priority queue schedule model was proposed in which the outburst data was given the highest priority. Some properties of the self-similar outburst data were proved by network calculus, and its service curve scheduled by the switch was gained. And then the performance of the scheduling algorithm was obtained. The simulation results are close to those calculated by using network calculus model. Some results are of actual significance to the construction of switched industrial Ethernet.
