

J. Cent. South Univ. (2020) 27: 578-591
DOI: https://doi.org/10.1007/s11771-020-4318-x

A power function model for simulating creep mechanical properties of salt rock
LI Huan(�)1, 2, Ngaha Tiedeu WILLIAM3, Jaak DAEMEN4,ZHOU Jun(�ܿ�)1, 2, MA Chang-kun(������)1, 2
1. State Key Laboratory of Geomechanics and Geotechnical Engineering, Institute of Rock and
Soil Mechanics, Chinese Academy of Sciences, Wuhan 430071, China;
2. School of Civil and Environmental Engineering, University of Chinese Academy of Sciences,Beijing 100049, China;
3. School of Resources and Environmental Sciences, Chongqing University, Chongqing 400044, China;
4. Mackay School of Earth Sciences and Engineering, University of Nevada, Reno, NV, USA
 Central South University Press and Springer-Verlag GmbH Germany, part of Springer Nature 2020
Abstract:
In this paper, a new micro-creep model of salt rock is proposed based on a linear parallel bonded model (LPBM) using the two-dimensional particle flow code (PFC2D). The power function weakening form is assumed to describe the variation of the parallel bonded diameter (PBD) over time. By comparing with the parallel-bonded stress corrosion (PSC) model, a smaller stress fluctuation and smoother creep strain-time curves can be obtained by this power function model at the same stress level. The validity and adaptability of the model to simulate creep deformation of salt rock are verified through comparing the laboratory creep test curves and the Burgers model fitting result. The numerical results reveal that this model can be capable of capturing the creep deformation and damage behavior from the laboratory observations.
Key words:
salt rock; creep damage; particle flow code; power function model��
Cite this article as:
LI Huan, Ngaha Tiedeu WILLIAM, Jaak DAEMEN, ZHOU Jun, MA Chang-kun. A power function model for simulating creep mechanical properties of salt rock [J]. Journal of Central South University, 2020, 27(2): 578-591.
DOI:https://dx.doi.org/https://doi.org/10.1007/s11771-020-4318-x1 Introduction
Due to the low porosity [1], low permeability (less than 10-20 m2) [2], and damage self-recovery properties of salt rocks [3], salt caverns are recognized as the perfect medium for energy storage [4]. However, if the creep deformation of salt caverns is too large, it will cause excessive cavity volume shrinkage [5] and ground subsidence [6]. Due to the difference in mechanical properties of the adjacent interlayers and salt layers in gas storage caverns in China, differential creep deformation, and shear stress will be induced in the interface regions, resulting in slippage cracks developing along the interfaces [7]. This would seriously affect the safety, availability and long- term stability of the gas storage cavern. Therefore, the in-depth understanding of the creep mechanical properties of salt rock and the simulation of the reliability are of great theoretical significance in ensuring the construction and operation of gas reservoir caverns.
The creep behavior of salt rock had been investigated intensively by many researchers. Numerous creep models have been developed. YANG et al [8] quantitatively analyzed the effects of the confining and axial pressure on the time-dependent strain of salt rock and proposed an empirical exponential function to simulate the creep strain from transient to steady-state. A new constitutive creep-damage model was proposed by WANG [9] based on the introduction of a damage accelerating limit into a Carter��s creep model, which can simulate the damage process of the complete three-stage creep of salt rock. HOU et al [10] proposed a Hou/Lux creep constitutive model, which takes into account the variation in hardening, softening, damage and recovery. This model was then implemented successfully to predict the time-dependent deformation of salt rock in the excavation disturbed zone (EDZ) of a 37-year-old underground cavity [11]. A multi-mechanism constitutive model for creep-damage of polycrystalline salt rock, named M-D model, has been developed based on the steady-state creep, modified to incorporate transient creep through work-hardening and recovery by MUNSON et al [12]. In order to further study the effect of creep damage, an improved M-D model, namely multi- mechanism deformation coupled fracture (MDCF) model, was proposed by CHAN et al [13]. However, this model has many parameters, which makes it difficult to use for practical engineering applications. It is important to mention that the Norton constitutive model [14] is widely used due to its simplicity and a good prediction of the creep rate of the steady-state stage of salt rock.
In general, the creep constitutive models can be divided into the following three types: empirical models, rheological damage models, and component models. Empirical models [8, 15-18] are usually based on extensive experimental results, which lead to salt rock creep constitutive models showing obvious empirical relationships. However, the selection of a creep constitutive model is essentially a random process in practical application, and the results of laboratory experimental fittings are still quite different from actual engineering results on a time scale.
The rheological damage model [10, 15, 19, 20] generally introduces the concept of damage variables or defines a damage function to express the deterioration of the mechanical properties of salt rock. This type of model generally considers that the rheological parameters of salt rock gradually weaken with time, and therefore constitutive equations can be established, reflecting the damage evolution of creep.
The component models [21-24] are based on the combination of standard elements such as the Newtonian dashpot, the Hooke spring and the frictional element. The elasticity, inelastic or viscous properties of salt rock can be described by using these elements independently or in combination. The component combination model has been extensively used in recent years because of its simple form, the tangible physical meaning of parameters, and ability to express complex mechanical properties of rocks. However, the choice of the components to describe the constitutive relation of salt rock is mainly based on experiments.
In summary, extensive researches related to the creep of salt rock have been carried out recently. These researches describe salt rock damage from the perspective of macroscopic or continuous media. However, little research has been done on creep damage in a micro-discrete manner. POTYONDY [25] first extended the parallel bonded model (BPM) [26] utilizing the concept of a damage-rate law, which can reflect the stress-dependent corrosion reaction of the brittle rock over time. This extended model is the so-called parallel-bonded stress corrosion (PSC) model, which assumes that the decay mode of the parallel bonded diameter (PBD) follows the exponential function law over time, driving the parallel bonded stress to develop toward the micro-activation stress, which finally would determine whether the creep��s mechanism appears inside the parallel bonded contacts in rock. From this point of view, the macroscopic creep of rock can be regarded as a comprehensive manifestation of creep deformation of all contacts inside the rock. More important is that this model is capable of reproducing the full creep process of salt rock perfectly.
Motivated by the constructed process of the PSC model, a PBD attenuation model in the form of a power function is proposed in this paper, which is incorporated into the linear parallel bonded model (LPBM) of the two-dimensional particle flow code (PFC2D) through the built-in Fish scripting language. So, no additional computational burden is generated in this new embedded micro-creep model. The basic theory of the model associated with the attenuation mechanism and the corresponding failure criterion are introduced briefly in Section 2.Section 3 presents constructed procedures of the numerical model, strategic calibrated processes of the short and long-term micro-parameters as well as the merits and verification of the proposed model, respectively. Sensitivity analysis of long-term parameters and practical applications are presented in Sections 4 and 5, respectively. Conclusions are given in Section 6 at the end of this paper.
2 Model description
2.1 Description of LPBM
In PFC2D, the intact rock specimen model is represented by a disordered assembly of rigid disk-shaped or irregularly shaped particles packed tightly. The adjacent particles are cemented at the contact points through the parallel bonded contacts [26]. The LPBM can be deemed as an upgraded version of the extensive used parallel-bonded model (PBM) [25], which is composed of a linear portion, a damping portion, and a bonded portion. The damping effect during quasi-static loading is ignored automatically. In a 2D model, the bonded contacts in an LPBM can be envisaged as a rectangular plane with unit thickness. The contact location is the tangent point of the two particles or the central point of the overlap. These bonded contacts can be capable of resisting forces and moments.
2.2 Attenuation mechanism of PBD
The power function creep model was developed on the basis of LPBM with the fundamental theory of driving the parallel bond diameter decaying gradually over time, while the contact stress exceeds a certain stress threshold. In principle, the normal stress and the tangential stress
 at the parallel bonded contact site of the i-th contact can be calculated from the following expression [26]:
 (1)
(1)
 (2)
(2)
If the parallel bonded stress at the bonded site is and is within the range of the micro-activation stress
  then the value of the parallel bonded tensile strength
 Assume that the decaying rate of PBD follows a power function which can be expressed as follows:
 (3)
(3)
Correspondingly, the updating calculation formula of PBD is deduced by integrating Eq. (3).Considering that the  can be considered as constant in an infinitesimal value [25], PBD can be updated by:
 (4)
(4)
where is the PBD updating rate.
2.3 Failure criterion for parallel bonded contact
To characterize the complex stress conditions of the internal particles with different shear strength characteristics, the Mohr-Coulomb failure criterion with a tensile cut-off is employed to determine the tensile or shear failure mode. It should be noticed that this criterion is implicit time-dependency, which means it is still valid under the effect of long-term load.
 (5)
(5)
where fs>0 indicates parallel bonded shear failure; fn>0 indicates parallel bonded tensilefailure.
3 Model setup
3.1 Model implementation
The dimension of the numerical specimens is set as 50 mm��100 mm, which follows with the suggestion of the International Society for Rock Mechanics (IRSM) [28]. Generally, the number of particles in a model should be sufficient large to simulate mechanical properties observed in laboratory tests accurately. However, appropriately reducing the number of particles should also be taken into consideration to improve the computational efficiency. Thus, after comprehensively balancing the computational efficiency and numerical simulation precision of the model, the total number of particles is 12107 with the radii obeying the uniform random distribution within the range of 0.56-0.85 mm with an average of 0.72 mm) (Figure 1(a)). In the plane triaxial compressive stage (Figure 1(a)), the model is surrounded by rigid boundaries which could translate and rotate without deformation. ��1 is applied at the upper and lower boundaries of the model with servo controlled by constant ��3. During the uniaxial compression tests, the lateral boundaries are deleted (not shown in Figure 1). Though, there is a significant dimensional difference between the PFC2D numerical simulation and triaxial tests in the laboratory. However, this modeling approach used in preceding investigations [29, 30] proving its feasibility in simulating the micro-mechanical behaviors of rocks. When numerical specimens are subjected to a constant external load, creep will occur only at the bonded contact as the bonded stress drives attenuation of PBD, evoking creep deformation (Figure 1(b)). In terms of the stress state at the bonded sites, the macro-creep caused by the attenuation of the PBD can be classified as the following three cases.
Case 1: If the parallel bonded stress is greater than the corresponding tensile strength  , the contact breaks directly, and the bonded contact changes to a non-bonded contact. At this point, the internal stress of the rock sample will be redistributed.
Case 2: If the parallel bonded stress is in the range of the micro-activation stress and the tensile strength
 the PBD will decay in the form of the power function mode as the creep time increases (Figure 1(d)). The parallel bonded stress gradually increases until the tensile strengthis exceeded. Meanwhile, the bonded contacts break and the creep mechanism will no longer take effect at the contact sites (Figure 1(d)). It is worth noting that the PBD at this moment doesn��t necessarily equal to 0.
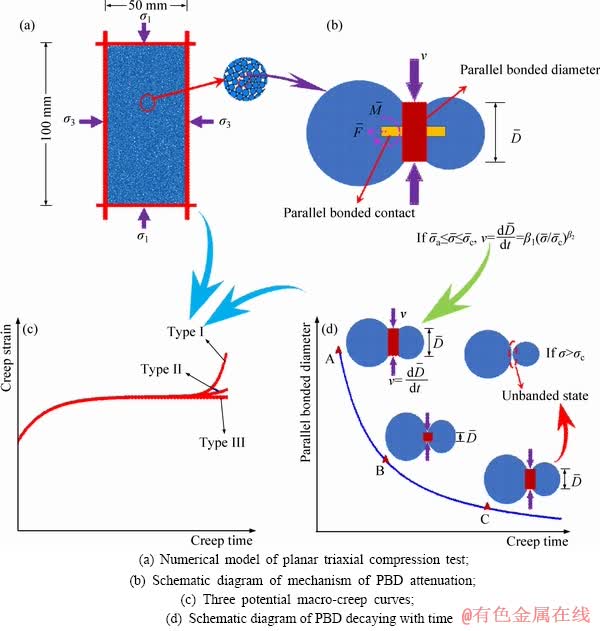
Figure 1 Operation mechanism of power function model:
Case 3: When is less than the PBD no longer decays. The stress redistribution is generated. Inside the rock specimen, while the other bonded particles are broken. Meanwhile, the stress acting upon this portion will be transferred and shared to adjacent bonded contacts. If the adjacent parallel bonded stress is betweenand , the creep mechanism will be activated and the PBD will be attenuated following the pattern in Case 2.
It can be seen from the above analysis that stress states of the parallel bonded contacts in the numerical sample are different, and the sequence and degree of the PBD��s attenuation also vary. Therefore, the macro-creep curves can be regarded as a superposition result given rise to PBD with different attenuation levels and be roughly divided into three types according to the morphological features of the creep curves, Types I, II and III as shown in Figure 1(c). Type I has an obvious initial creep and steady-state creep. Type II, in addition to the basic features of Type I, has an initial creep acceleration feature. However, this feature is not so apparent. Type III has three distinct characteristics of the creep.
3.2 Micro-parameters calibration
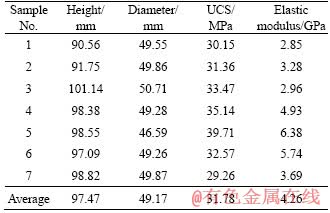
The rock specimen calibrated in this study was selected from Qianjiang salt rock with high impurity content and greyish-black appearance, as shown in Figure 2(a). All the tests were performed on cylindrical specimens at room temperature. The rock samples were carefully cut and polished, but a slight discrepancy remained in their final size. Since the parameter is an essential property describing the internal mechanical properties of the rock, it does not change substantially with the stress state and grain structure. Thus, the corresponding short-term and long-term micro-parameters calibrated by uniaxial compression and creep test can be directly used in the triaxial creep compression test. The geometry and macro- parameters of all rock specimens tested for uniaxial compression test are listed in Table 1. All the creep tests including the uniaxial tests and multi-stage creep loading tests were conducted on a triaxial creep servo-controlled testing equipment (RC-2000) at State Key Laboratory of Geomechanics and Geotechnical Engineering of Wuhan, China, as shown in Figure 2(b). This device mainly consists of the axial strain sensor, circumferential strain sensor, acoustic emission probe, and a microcomputer system. The measuring error of this device can be controlled within the range of 1%.
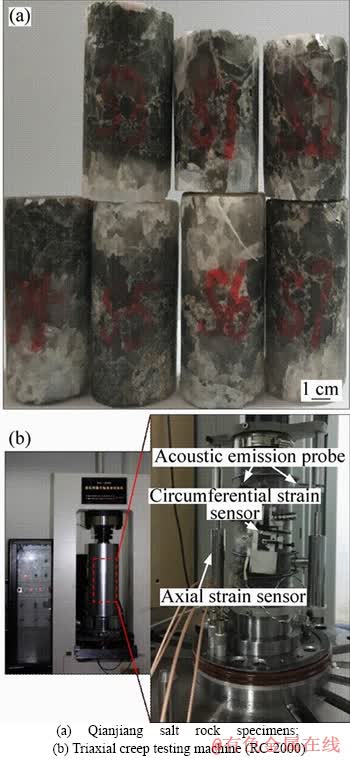
Figure 2 Uniaxial creep testing specimens and equipment:
Table 1 Dimensions and macro-parameters of Qianjiang salt rock
In general, incompatibility between micro- parameters used in PFC2D and macro parameters obtained from laboratory testing leads to the calibration has to be strategically performed using a trial-and-error approach. Parameter calibration is a critical step in numerical simulation [31] through the inversion of micro-mechanical parameters by experimental test. At present, a great number of numerical investigations have been conducted to study the calibration between macro-parameters and micro-parameters in detail [30, 32, 33], which provide reliable guidance for selecting and identifying the micro-parameters. The short-term micro-parameters of LPBM mainly include the geometric size of the particles (Rmax/Rmin and Rmin), parallel bonded strength (tensile strength  and cohesive strength
  ), the density of the particles (��), contact modulus of particle surface (Ec), parallel bond modulus
  contact stiffness ratio of particles surface (Kn/Ks), stiffness of parallel bond
  friction coefficient between the particles (��), internal friction angle (��), and the moment contribution factor (
 ). It should be noted that, since the modulus and stiffness (including contact modulus and stiffness, parallel bond modulus and stiffness) are related by certain algebraic relationships in the PFC model, thus only one of them needs to be specified. The long-term micro parameters mainly include unit rate ��1, dimensionless constant ��2 and micro-activation stress
 To enhance the generality of the parameters, the short and long-term parameters of PFC model are calibrated based on the average values of macro-mechanical parameters (uniaxial compressive strength (UCS) and elastic) in Table 1, and the three-stage laboratory creep test curve in Figure 3. The results presented in Figure 3 indicate that numerical results are in good agreement with observations from the laboratory tests. All the calibrated parameters are listed in Table 2.
3.3 Model comparison
In this subsection, the power function attenuation model and the PSC model proposed in Ref. [25] (the exponential function used to describe the attenuation behavior) are employed to comparative study the creep curves. Figure 4 depicts the result of the power function model and the PSC model at confining pressures ��c=3 MPa and ��c=6 MPa, with DSR=0.7, respectively. The parameters used in these two models are all listed in Table 2. The result indicates that a slowly increasing and smooth overall creep strain characteristic with normalized creep time is observed in the power function decaying mode under the same stress level. However, the corresponding results show a more intense fluctuation with the normalized strain value in the PSC model. This abrupt change is prone to triggering stress redistribution, further engendering additional stress and large creep displacements, which is macroscopically characterized by a sharp increase of creep strain in the local range. Another important finding should be noticed that when the normalized creep time is about 0.5, the creep strain starts to increase instantaneously, and the increased amplitude reaches the maximum when the normalized creep time is between 0.8 and 0.85.
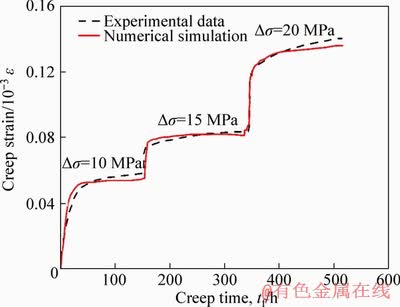
Figure 3 Comparison of laboratory creep test of salt rock and numerical simulation under multi-stage loading
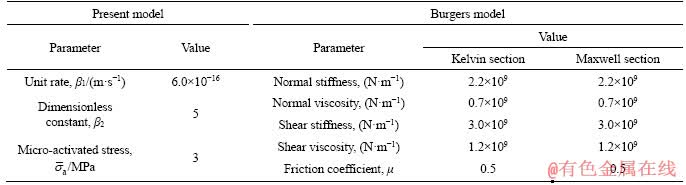
Table 2 Calibrated parameters of the power function model
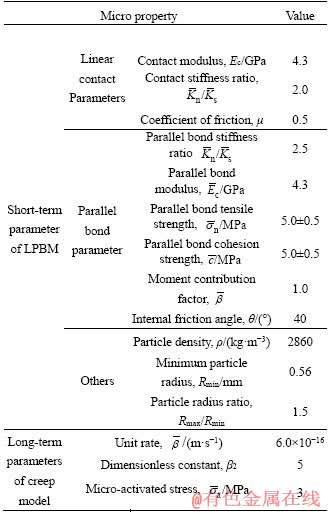
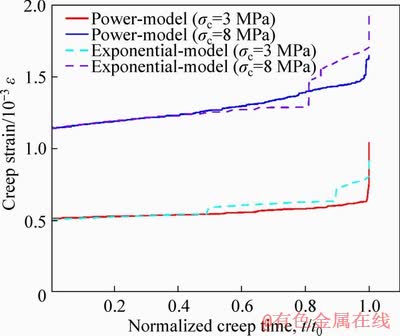
Figure 4 Creep strain vs. normalized creep time curves of the power function model and PSC model under different confinement with DSR=0.7
To further analyze the intrinsic mechanism of these two attenuation modes, two expressions of  and
and  describing the attenuation rate are adopted for comparison and illustrated in Figure 5. Let
 and the deviation function
  When ��=1, ��min=��2 corresponds to the function minimum. In other words, in the interval ��0�ܦǡ�1,
  is always less than
 This indicates that the decaying rate of the PBD in the form of a power function is always smaller than that of an exponential function in the physical sense.
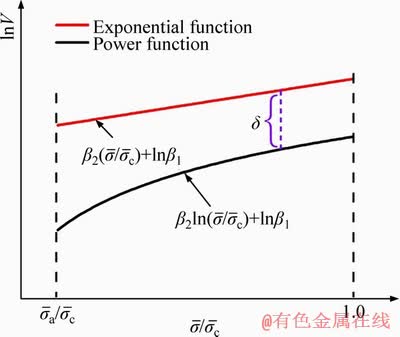
Figure 5 Comparison of decaying rate curves between power function and exponential function
3.4 Model verification
To verify the effectivity of the decaying mode of the power function, the laboratory, and numerical results of the creep tests are compared and plotted in Figure 6. For comparison, the typical Burgers model [27] in the PFC fitting curve was also plotted, in dotted line. Creep curves in the figure represent the results for axial stress ��=5 MPa. These results clearly show that the current model can effectively predict the full creep stage of salt rock, especially the accelerated creep stage. However, the fitted Burgers model can only be used with transient and steady-state creep stages. These parameters are then used to describe the model in Figure 7 and listed in Table 3. The correlation coefficient for the current model is and for the Burgers model is
  This indicates that the power functional model can well follow the creep characteristic of salt rock.
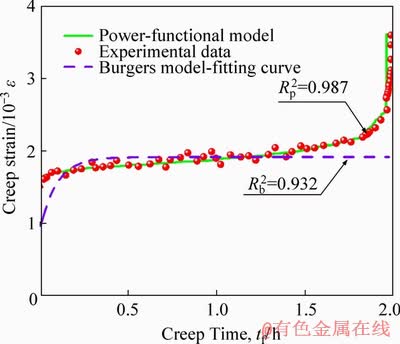
Figure 6 Creep strain vs. normalized creep time curves of power function model, experimental results and Burgers model
4 Parametric sensitivity analysis
The sensitivity analysis of parameters, in which one parameter takes several different values, while other parameters take fixed values, is performed to investigate their effect on the strain-time curves of salt rock.
4.1 Effect of ��1, ��2, on creep strain-time curves
To express the intuitiveness of the results conveniently, the specified creep strain convergence value is set to 1.8��10-3. 30% of the peak strength is taken as the creep load and therefore the instantaneous elastic strain remains around 8.0��10-4.

Figure 7 Effect of (a) ��1, (b) ��2, (c)on creep strain-time curves
Table 3 Micro-parameters for comparing two models
The effects of unit rate ��1, dimensionless constant ��2, and micro-activation stresson the creep strain-time curves are plotted in Figures 7(a)-(c), respectively. Compared with Figures 7(a) and (b), the influence of ��1 and ��2 on the creep strain-time curves is relatively simple. An overall process including a distinct transient stage, a steady-creep stage, and an accelerated creep stage is observed, regardless of the variance of ��1 or ��2. When ��1=80.0��10-16 m/s or ��2=1, the creep strain-time curves show an approximately linear form, but an obvious three-stage creep can still be observed from the partially magnified graph. This indicates that the creep curve morphology has a self-similarity characteristic and this feature is in dependent with parameters ��1 or ��2. By comparing the variation of the creep curves for the two parameters, it can be seen that the self-similarity characteristic of the creep strain curves under ��1 is more obvious, while the influence on the transition stage between the steady creep and the accelerated creep under ��2 is more apparent. With the increase of ��2, a change from a gradual increase to a sharp increase appears in this transition stage, which means that the rock specimen destruction tends to accelerate after the steady-state creep. In terms of curve shapes of the steady-state creep stage, ��1 and ��2 have different effects.
The larger the parameter ��1, the shorter the creep duration of the steady-state (the creep rate of the steady-state gradually increases), and the faster the creep enters the acceleration stage. The steady-state creep rate gradually approaches zero and the creep duration is longer with the increase of ��2. Based on the above analysis, it can be concluded that the increase of ��1 contribute to accelerate the creep damage, while the increase of ��2 has an inhibition effect. It should be noticed that the transition between the second and third stages of creep is gradually degraded with an increase of ��2. In particular, when ��2=14 and the creep time Tf=5.7��104 h, the creep acceleration stage is characterized by a sharp increase after the steady-state creep without a gradual transition stage, which indicates that the accelerated destruction is very transient.
Figure 7(c) shows the effect of micro- activation stresson creep strain-time curves. Compared to Figures 7(a) and (b), it can be observed that the effect ofon the creep strain-time curves is complex. From the perspective of the whole process, the increase ofwill result in a more obvious influence ofon the second and third stage of the creep. More specifically, with the increase of the accelerated creep progressively degenerates and eventually disappears, and the rate of the steady-state creep decreases gradually too. According to the different effects ofon creep strain-time curves, three kinds of creep mode (corresponding to the description of Figure 1(d)) can be considered.
When 0<��16 MPa, the creep strain-time curves can be classified as the Type I mode. This type of creep mode is a typical creep curve which obviously possesses three-stage creep characteristics; within the range of this activation stress, the creep strain-time curves are approximately the same with prominent self- similarity. Only the creep rate of the steady-state is different. A more interesting finding is that the creep strain-time curve expands along the time axial-increment direction with the increase of .
When 16 MPa<<20 MPa, the creep strain- time curve can be classified as Type II. This type of creep can be considered as a semi-degenerate creep curve which has a glaring initial and steady-creep stage. However, the accelerated creep stage is not noticeable in this mode. Only the transient transition between steady and accelerated stage exists.
When ��20 MPa, the creep strain-time curve can be classified as Type III. This curve can be regarded as a convergent type: Only the initial and steady-state creep stages (Figure 7(c)) exist in this creep curve. The dividing point between the initial and steady creep stage is not so conspicuous, and the creep rate of the steady-creep stage tends to zero.
In order to more distinctly compare the creep rate of the steady-state creep stage under the influence of the parameters, the steady-state creep rates for different parameters ��1, ��2 and values are plotted in the semi-logarithmic coordinates (Figure 8). From the results of fitting curves, the three parameters present an obvious linear relationship. It can be concluded from the approximate estimates in this figure, that the steady-state creep rate is the largest, in the order of magnitude of 10-6-10-5, and the variance is the smallest under the effect of ��1. However, the order of magnitude of the steady-state creep rate is 10-9-10-6 under the effect of Compared to the above two parameters, the steady-state creep rate is the smallest while the variance is the largest, with an order of magnitude of 10-9-10-7, under the effect of ��2. It can be concluded from the comprehensive comparison of the three parameters that ��1 has a pronounced influence on the steady-state creep rate.
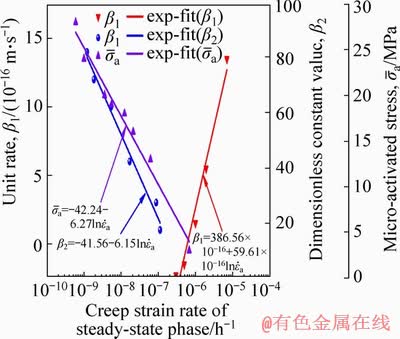
Figure 8 Summary of steady-state creep rates as a function of parameters ��1, ��2,
4.2 Effect of ��1, ��2,on creep time
The full creep durations of Figures 7(a) and (b) are plotted in Figures 9(a) and (b), respectively. Since there are fewer cases in Figures 7(a) and(b),additional 30 and 15 numerical cases are added to enhance the consistency of data, respectively, and all are summarized in Figures 9(a) and (b).

Figure 9 Creep time Tf vs. different creep parameter of (a) ��1; (b) ��2; (c)
From the results shown in Figures 9(a) and (b), the effects of ��1 and ��2 on the creep duration show obvious non-linear laws, which can suitably be expressed by exponential functions. The difference is that the creep duration decreases gradually with the increase of ��1, which also indicates that an increase of ��1 is apt to generate creep acceleration damage of the rock specimen. However, the effect of ��2 on the duration of the creep is the opposite of that of ��1, which indicates that the creep acceleration of the rock sample is inhibited.
More noteworthy is that, with the increase of ��1, creep time is not always consistent with the stable attenuation of the law. In particular, when ��1 ranges between 25��10-16 and 35��10-16 m/s, a fluctuation appears in the creep time (Figure 9(a)). Comparing with the result of ��2 in Figure 9(b), it can be noted that the effect of ��1 on creep duration is more significant. The effect ofon the full creep duration is very complex (Figure 9(c)), especially when considering the complete curve of Types II and III (Figure 9(c)), which has been convergent while the specified creep strain is not reached. The corresponding creep time shows a consistent synchronization with the increase of . In the stage mode of Types I and II, the total creep duration increases with the increase of(AC in Figure 9(c)). But when entering the Type III stage, the total creep duration decreases with the continuing increase of(CE in Figure 9(c)).
Whenapproximately equals 19 MPa, the creep duration is the longest. The main reason for this may be that a greater  would imply a smaller number of particles with the contact stress of the inner particles larger than in the salt rock numerical sample. A small number of particles after initiating the creep mechanism would result in a trace of translation and rotation, which would create an additional stress on the adjacent bonded particles with the creep time lapse. If the adjacent bonded particles are fewer, additional stress will continue to push the adjacent bonded particles to activate the creep mechanism, repeating the cycle and resulting in a ripple effect. The creep curve has the characteristics of accelerating creep on a macro- view, and the creep time is also relatively short. However, if increasing continuously, the bonded contact that can induce creep is further reduced, and the particle will produce a new stress balance after the creep rupture. Nevertheless, the stress fluctuation induced by this stress balance is very small, and it is difficult to cause other bonded contact stresses to exceed the corresponding micro- activation stress.
This is referred to as the characteristic of convergent creep on the macroscopic scale. It should be noted that the horizontal line in the CD curve stage of Figure 9(c) belongs to Type II, theoretically. However, it can be seen from Figure 7(c), that when is increased from 19 to 20 MPa, the creep strain curve weakens at the end of the bending section, and it approaches the horizontal line gradually. The transition stage from the steady-state creep stage to the acceleration creep stage disappeared gradually, so the CD stage was classified as a convergent stage.
5 Verification and applications
5.1 Comparison of steady-state creep rate
To have a well-grounded study the steady-state creep rate under the effect of the confining pressure, the Norton power constitutive model [33] is employed to describe the steady-stage creep of salt rock due to its simple form and few parameters. This constitutive model assumes that the creep of salt rock is activated by the Von-Mises stress  and can be expressed as:
 (6)
(6)
Four cases with the confinements of 0, 5, 15, and 20 MPa are used for the triaxial creep tests with each confinement corresponding to four different types of stress levels as the creep load, namely, 10%, 30%, 50% and 70% of UCS. The corresponding stress state is converted into the Von-Mises stress. Finally, the data points of different Von-Mises stresses and steady-state creep rates of numerical samples are obtained and plotted in Figure 10. For a comparison, laboratory results of salt rock samples with different confining pressures are also presented in blue dots. The result indicates that the simulated results are in good agreement with the values measured from laboratory tests, and both are perfectly compatible with the non-linear fitting curve of the Norton power model. The fitting creep parameters of the Norton power model is 3.68��10-9, and is 4.95 with the correlation coefficient of 0.998.

Figure 10 Fitting relationship between steady-state creep rate and Von-Mises stress
5.2 Comparison of failure mode
Presented in Figure 11 is the comparing result between the experimental test and numerical simulation after the multi-stage creep test. It can be seen that the micro-cracks are distributed dispersedly, without continuous and distinct fractures in experimental test (Figure 11(a)). This result can be revealed by the modeled micro cracking images (Figure 11(b)) and follows with the finding in Ref. [34, 35]. Moreover, the corresponding creep strain-time curves simulated by the power function model follows well with the result obtained by experimental test under multi-stage triaxial creep test (Figure 12).
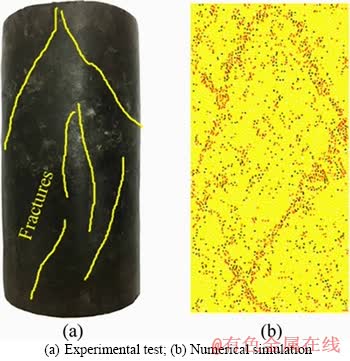
Figure 11 Creep failure of specimens:
6 Conclusions
A power function micro-creep model is proposed and implemented into PFC2D based on the secondary development of the LPBM. The power function weakening form is introduced to describe the attenuation of the PBD over time. Strategic calibrated processes of the short and long-term micro-parameters associated with the validity of the model by comparing laboratory creep test curves and the Burgers model fitting results are discussed. Sensitivity analysis of long-term parameters on creep strain-time curves and creep time are investigated and practical applications are presented, respectively. The main conclusions are summarized as follows:
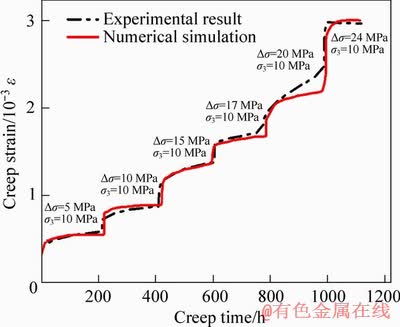
Figure 12 Comparison of multi-stage triaxial creep strain vs. time curves between numerical simulation and laboratory test
1) The creep strain-time curves simulated by the power function model are possessed of the characteristics of less influence on stress fluctuation, resulting in a smoother curve shape. More importantly, the results obtained by this model can correctly reproduce the three-stage creep characteristics of salt rock.
2) The complete creep is observed, regardless of the different values of ��1 or ��2. The creep curves are very complex under the influence of  . They can be classified into three mode types based on the different values of
  Type I-an evident three- stage creep. Type II-a semi-degenerate creep curve which displays pronounced initial and steady-creep stages. Type III-having only the initial and the steady-state creep stage. The creep duration decreases gradually with the increase of ��1. The effect of ��2 on the duration of the creep is opposite to that of ��1. Both of these two characteristics can be expressed by the exponential function.
3) The proposed power function model can accurately reproduce the steady-state creep rate, failure mode associated with the multi-stage triaxial creep strain vs. time curves of salt rock in laboratory.
Nomenclature

Parallel bonded normal force of the i-th contact

Parallel bonded tangential force of the i-th contact

Parallel bonded bending moment at the i-th contact

Parallel bonded shear stress at the i-th contact

Parallel bonded normal stress at the i-th contact.

Radius of parallel bonded contact

Normal stiffness of parallel bonded contact

Shear stiffness of parallel bonded contact

PBD before attenuation

PBD after attenuation
Parallel bonded radius before attenuation

Micro-activation stress

Tensile strength of parallel bonded contact

Shear strength of parallel bonded contact
��t
Time step
��1
Rate of power function model
��2
Dimensionless constant of power function model
v
Decaying rate of PBD
A
Area of the parallel bonded contact
Av
Material parameter of the Norton Power model
Moment contribution factor
I
Moment of inertia for the parallel bonded cross-section
Cohesive strength of parallel bonded contact

Internal friction angle of parallel bonded contact

Steady-state creep rate
q
Mises stress
J2
The second invariant of deviatoric stress
References
[1] CHEN Jian-wen, LI Er-bing, LUO Jin. Characterization of microscopic pore structures of rock salt through mercury injection and nitrogen absorption tests [J]. Geofluids, 2018, 2018: 1-7. DOI: 10.1155/2018/9427361.
[2] LIU Wei, ZHANG Zhi-xin, CHEN Jie, FAN Jin-yang, JIANG De-yi, DAEMEN J J K. Physical simulation of construction and control of two butted-well horizontal cavern energy storage using large molded rock salt Specimens [J]. Energy, 2019, 185: 682-694. DOI: 10.1016/j.energy.2019.07.014.
[3] CHAN K S, BODNER S R, MUNSON D E. Recovery and healing of damage in WIPP salt [J]. International Journal of Damage Mechanics, 1998, 7(2): 143-166. DOI: 10.1177/ 105678959800700204.
[4] OZARSLAN A. Large-scale hydrogen energy storage in salt caverns [J]. International Journal ofHydrogen Energy, 2012, 37(19): 14265-14277. DOI: 10.1016/j.ijhydene.2012.07.111.
[5] YANG Chun-he, WANG Tong-tao, LI Ying-ping, YANG Hai-jun, LI Jian-jun, QU Dang-an, XU Bao-cai, YANG Yun, DAEMEN J J K. Feasibility analysis of using abandoned salt caverns for large-scale underground energy storage in China [J]. Applied Energy, 2015, 137: 467-481. DOI: 10.1016/ j.apenergy.2014.07.048.
[6] LIU Wei, LI Yin-ping, YANG Chun-he, JIANG De-yi, DAEMEN J J K, CHEN Jie, KONG Jun-feng. A new method of surface subsidence prediction for natural gas storage cavern in bedded rock salts [J]. Environmental Earth Sciences, 2016, 75(9): 800. DOI: 10.1007/s12665-016- 5611-8.
[7] LI Ying-pin, LIU Wei, YANG Chun-he, DAEMEN J J K. Experimental investigation of mechanical behavior of bedded rock salt containing inclined interlayer [J]. International Journal of Rock Mechanics & Mining Sciences, 2014, 69(3): 39-49. DOI: 10.1016/j.ijrmms.2014.03.006.
[8] YANG Chun-he, DAEMEN J J K, YIN Jian-hua. Experimental investigation of creep behavior of salt rock [J]. International Journal of Rock Mechanics & Mining Sciences, 1999, 36(2): 233-242. DOI: 10.1016/S0148-9062(98) 00187-9.
[9] WANG Gui-jun. A new constitutive creep-damage model for rock salt and its characteristics [J]. International Journal of Rock Mechanics & Mining Sciences, 2004, 41(3): 364. DOI: 10.1016/j.ijrmms.2003.12.078.
[10] HOU Zheng-meng, LUX K H. A constitutive model for rock salt including structural damages as well as practice-oriented applications [C]// Proceedings of the 5th International Conference on Mechanical Behaviour of Salt. France: Balkema, 1999: 151-69.
[11] HOU Zheng-meng. Mechanical and hydraulic behaviour of salt in the excavation disturbed zone around underground facilities [J]. International Journal of Rock Mechanics & Mining Sciences, 2003, 40(5): 725-738. DOI: 10.1016/S1365-1609(03)00064-9.
[12] MUNSON D E, DAWSON P R. Salt-constitutive modeling using mechanism maps [C]// Conference on the Mechanical Behavior of Salt. Pennsylvania, USA: University Park, 1981.
[13] CHAN K S, BODNER S R, FOSSUM A F, MUNSON D E. A damage mechanics treatment of creep failure in rock salt [J]. International Journal of Damage Mechanics, 1997, 6(2): 121-152. DOI: 10.1177/105678959700600201.
[14] YANG Chun-he, WANG Tong-tao, QU Dan-an, MA Hong-ling, LI Yin-ping, SHI Xi-lin, DAEMEN J J K. Feasibility analysis of using horizontal caverns for underground gas storage: A case study of Yunying salt district [J]. Journal of Natural Gas Science & Engineering, 2016, 36: 252-266. DOI: 10.1016/j.jngse.2016.10.009.
[15] CARTER N L, HORSEMAN S T, RUSSELL J E. Rheology of salt rock [J]. Journal of Structural Geology,1993, 15(10): 1257-1272. DOI: 10.1016/0191-8141(93)90168-A.
[16] HERRMANN W, WAWERSIK W R, LAUSON H S. Analysis of steady state creep of southeastern new mexico bedded salt [R]. Sandia National Laboratories, SAND80-0558, 1980a.
[17] HERRMANN W, WAWERSIK W R, LAUSON H S. Creep curves and fitting parameters for southeastern new mexico rock salt [R]. Sandia National Laboratories, SAND80-0087, 1980b.
[18] SENSENY P E. Determination of a constitutive law for salt at elevated temperature and pressure [R]. American Society for Testing and Materials, 1985.
[19] CHAN K S, BODNER S R, MUNSON D E, FOSSUM A F. Inelastic flow behavior of argillaceous salt [J]. International Journal of Damage Mechanics, 1996, 5(5): 292-314. DOI: https://doi.org/10.1177/105678959600500305.
[20] PING Cao, WEN You-dao, WANG Yi-xian, YUAN Hai-ping, YUAN Hai-ping. Study on nonlinear damage creep constitutive model for high-stress soft rock [J]. Environmental Earth Sciences, 2016, 75(10): 900. DOI: 90010.1007/s12665-016-5699-x.
[21] TANG Hao, WANG Dong-po, HUANG Run-qiu, PENG Xiang-jun, CHEN Wen-ling. A new rock creep model based on variable-order fractional derivatives and continuum damage mechanics [J]. Bulletin of Engineering Geology & the Environment, 2018, 77: 375-383. DOI: 10.1007/s10064-016- 0992-1.
[22] ROGERS L. Operators and fractional derivatives for viscoelastic constitutive equations [J].Journal of Rheology, 1984, 27(4): 351. DOI: 10.1122/1.549710.
[23] TANG Jia, PENG Zheng-bin, HE Zhong-ming. Research on improved Burgers model based on rock mass creep test [J]. Journal of Central South University (Science and Technology), 2017, 48(9): 2414-2424. DOI: 10.11817/j.issn.1672-7207.2017.09.021. (in Chinese)
[24] WANG Jun-bao, LIU Xin-rong, SONG Zhan-ping, GUO Jian-qiang, ZHANG Qian-qian. A creep constitutive model with variable parameters for thenardite [J]. Environmental Earth Sciences, 2016, 75(11): 979. DOI: 10.1007/ s12665-016-5783-2.
[25] POTYONDY D O. Simulating stress corrosion with a bonded-particle model for rock [J]. International Journal of Rock Mechanics & Mining Sciences, 2007, 44(5): 677-691. DOI: 10.1016/j.ijrmms.2006.10.002.
[26] POTYONDY D O, CUNDALL P A. A bonded-particle model for rock [J]. International Journal of Rock Mechanics & Mining Sciences, 2004, 41 (8): 1329-1364. DOI: 10.1016/j.ijrmms.2004.09.011.
[27] ITASCA Consulting Group INC. PFC manual, version 5.0 [R]. Minneapolis, 2018.
[28] ULUSAY R. The ISRM suggested methods for rock characterization, testing and monitoring: 2007-2014 [R]. Springer International Publishing, 2014.
[29] BAHRANI N P, KAISER K, VALLEY B. Distinct element method simulation of an analogue for a highly interlocked, non-persistently jointed rockmass [J]. International Journal of Rock Mechanics & Mining Sciences, 2014, 71: 117-130. DOI: 10.1016/j.ijrmms.2014.07.005.
[30] CHO N, MARTIN C D, SEGO D C. A clumped particle model for rock [J]. International Journal of Rock Mechanics & Mining Sciences, 2007, 44(7): 997-1010. DOI: 10.1016/j.ijrmms.2007.02.002.
[31] PENG Jun, WONG L N Y, TEH C I, LI Zhi-huan. Modeling micro-cracking behavior of Bukit Timah granite using grain-based model [J]. Rock Mechanics and Rock Engineering, 2018, 51(1): 135-154. DOI: 10.1007/s00603-017-1316-x.
[32] FAKHIMI A, VILLEGAS T. Application of dimensional analysis in calibration of a discrete element model for rock deformation and fracture [J]. Rock Mechanics and Rock Engineering, 2007, 40(2): 193-211. DOI: 10.1007/s00603- 006-0095-6.
[33] MEHRANPOUR M H, KULATILAKE P H S W. Comparison of six major intact rock failure criteria using a particle flow approach under true-triaxial stress condition [J]. Geomechanics and Geophysics for Geo-Energy and Geo-Resources, 2016, 2(4): 203-229. DOI: 10.1007/ s40948-016-0030-6.
[34] CORNET J S, DABROWSKI M, SCHMID D W. Long term creep closure of salt cavities [J]. International Journal of Rock Mechanics and Mining Sciences, 2018, 103: 96-106. DOI: 10.1016/j.ijrmms.2018.01.025.
[35] LI Huan, YANG Chun-he, DING Xiu-li, WILLIAM N T, YIN Hong-wu, ZHANG Sheng-nan. Weibull linear parallel bond model (WLPBM) for simulating micro-mechanical characteristicsof heterogeneous rocks [J]. Engineering Analysis with Boundary Elements, 2019, 108: 82-94. DOI: 10.1016/ j.enganabound.2019.07.018.
(Edited by ZHENG Yu-tong)
���ĵ���
ģ�����������ѧ���Ե��ݺ���ģ��
ժҪ�����IJ��ö�ά����������(PFC2D)��������ƽ��ճ��ģ��(LPBM)�Ļ����ϣ������һ���µ����������ģ�͡���ģ�ͼٶ�ƽ��ճ��ֱ��(PBD)��ʱ���˥��ģʽ��ѭ�ݺ����仯���ɡ���Ӧ����ʴģ��(PSC)��Ƚϣ�����ͬ��Ӧ��ˮƽ�£��ݺ���ģ�ͱ��ֳ���С��Ӧ�������Լ���Ϊƽ�������Ӧ��-ʱ������������ͨ���Ա�����������������Լ�Burgersģ�͵���Ͻ������֤�˸�ģ����Ԥ���������������Է��������Ч�Ժ���Ӧ�ԡ���ֵ����������ݺ���ģ���ܹ������������������۲����������ƻ�ģʽ��
�ؼ��ʣ����ң�������ˣ����������룻�ݺ���ģ��
Foundation item: Projects(51621006, 51874274) supported by the National Natural Science Foundation of China; Project(2018YFC0808401) supported by the National Key Research and Development Program of China
Received date: 2019-03-19; Accepted date: 2019-08-30
Corresponding author: LI Huan, PhD Candidate; Tel: +86-13260519155; E-mail: whrsmlh@163.com; ORCID: 0000-0002-2977-8049
Abstract: In this paper, a new micro-creep model of salt rock is proposed based on a linear parallel bonded model (LPBM) using the two-dimensional particle flow code (PFC2D). The power function weakening form is assumed to describe the variation of the parallel bonded diameter (PBD) over time. By comparing with the parallel-bonded stress corrosion (PSC) model, a smaller stress fluctuation and smoother creep strain-time curves can be obtained by this power function model at the same stress level. The validity and adaptability of the model to simulate creep deformation of salt rock are verified through comparing the laboratory creep test curves and the Burgers model fitting result. The numerical results reveal that this model can be capable of capturing the creep deformation and damage behavior from the laboratory observations.
