
J. Cent. South Univ. (2017) 24: 478-488
DOI: 10.1007/s11171-017-3450-3

An algorithm to remove noise from locomotive bearing vibration signal based on self-adaptive EEMD filter
WANG Chun-sheng(������)1, SHA Chun-yang(ɳ����)1, SU Mei(��÷)1, HU Yu-kun(������)2
School of Information Science and Engineering, Central South University, Changsha 410083, China
School of Engineering, University of Warwick, Coventry, CV4 7AL, United Kingdom
 Central South University Press and Springer-Verlag Berlin Heidelberg 2017
Abstract:
An improved ensemble empirical mode decomposition (EEMD) algorithm is described in this work, in which the sifting and ensemble number are self-adaptive. In particular, the new algorithm can effectively avoid the mode mixing problem. The algorithm has been validated with a simulation signal and locomotive bearing vibration signal. The results show that the proposed self-adaptive EEMD algorithm has a better filtering performance compared with the conventional EEMD. The filter results further show that the feature of the signal can be distinguished clearly with the proposed algorithm, which implies that the fault characteristics of the locomotive bearing can be detected successfully.
Key words:
1 Introduction
With economic and social developments in modern times, the need for railway transportation capability has been increasing considerably [1]. The railway transportation has been playing a critical role, and its faults would cause significant casualties and property losses [2, 3]. To ensure a safe, fluid and efficient traffic circulation, it is of importance to diagnose the status of trains in terms of the train bearing. In the locomotive driving system, the whole weight of the locomotive is supported by the bearings. When the locomotive is running, the bearings also spin at a very fast speed. Thus, the health of the bearings is very important for the continuous, safe and stable operation of locomotives. In consequence, more effective algorithms are needed to diagnose the conditions of locomotive bearing [4].
Signal processing technique is one of the primary means of fault diagnosis, which relies on the signal released from the diagnostic objectives, like vibration signal released from rotating machinery [5-7]. Empirical mode decomposition (EMD) [8, 9] is one of popular algorithms used for non-stationary and nonlinear signal processing, which is widely used for fault diagnosis and feature extraction of different kinds of rotating machinery [10, 11]. In EMD algorithm, it decomposes a non-stationary signal into a series of signals, also known as intrinsic mode function (IMF) [12, 13], which are composed of different frequencies and a trend signal. The typical characteristics of EMD algorithm are adaptive, orthogonal and complete, which means that the IMFs are determined by the characteristics of the signal instead of predetermined algorithms. However, EMD algorithm still has some problems, like mode mixing [14], stop condition [15], and the end effect [16]. For mode mixing, its existence in IMF components is due to the facts that single IMF contains a widely disparate scales of components and components have a similar scale residing [17, 18].
In order to solve the mode mixing problem existed in EMD algorithm, ensemble empirical mode decomposition (EEMD), an ameliorative algorithm of EMD, was proposed to improve the performance of EMD algorithm in mode mixing problem. EEMD algorithm is also a signal decompose algorithm, but it is noise-assisted. With plus finite white noise whose average value is zero into the vibration signal that needs to be processed, EEMD algorithm is expected to solve the mode mixing problem that exists in EMD algorithm to some extent [19]. However, the decomposing effect of EEMD algorithm relies on the parameters of the while noise and sifting number utilized in the EEMD algorithm, which is included in the amplitude and the frequency of
the white noise, the sifting and the ensemble number, etc. Usually, the parameters of EEMD algorithm are set up as constant values in most instances. However, different kinds of frequency components existed in the vibration signal have different sensitivities to the chosen parameters [20]. Consequently, the mode mixing problem still exists and the decomposition capacity of EEMD algorithm needs to be improved in other ways, like changing parameters which are used in EEMD algorithm.
According to the relationship between the decomposing behavior of EEMD algorithm and the decomposed results of different IMFs with different frequencies, this work aims to propose an ameliorative EEMD algorithm with self-adaptive parameters and have better performance with conventional EEMD algorithm on the mode mixing problem in the feature extraction of vibration signal and fault diagnosis for locomotive bearing.
2 Fault diagnosis system design and vibration signal process methods
2.1 Fault diagnosis system design
In this work, a signal process algorithm was developed for train bearing fault detection through vibration signal analysis, and it is expected to deliver a design of fault diagnosis system for locomotive driving system. The proposed scheme for locomotive bearing fault diagnosis is shown in Fig. 1.
In the proposed scheme, there are two sets of vibration signals of the locomotive obtained by the data acquisition system. The training data is used to train and study to get the feature of the fault bearing corresponding to the fault type, the original data is used to diagnose the fault to get the fault type of the bearing. The sampled vibration signals (original and training) are first processed to filter the noisy signal, and followed by feature extraction. Then the training and study signal is used to analyze the original signal and further diagnose the fault of the bearing. It can be seen that signal process is not only a basic step but also a necessary step for fault diagnosis, and the filtering effect determines the precision of diagnosis results.
2.2 EMD analysis
EMD method is essentially a algorithm of ��screening�� data [17, 18], and it is capable to decompose a vibration signal into a series of IMFs, which meets the following two conditions: 1) the number of zero-crossing and the number of extrema must be the same or differ by one at most in the entire data set; 2) throughout the signal curve, the mean value of the envelope defined by the local minima and the envelop defined by the local maxima are zero. The original EMD is based on the characteristic time scale defined by the extreme [21]. It is well known that EMD is used for sifting process. The procedure of the EMD algorithm can be summarized as follows.
Step 1: Marking the original signal as x(t), and find all the local maxima and the minima of the signal.
Step 2: Connect the maxima to form a curve as the upper envelope umax(t); then the same with the minima to form a curve as the lower envelop umin(t). Then identify the average value, m(t)=(umax(t)+ umin(t))/2.
Step 3: Extract the remain signal h1(t), h1(t)=x(t)-m(t), and if h1(t) meets the two conditions of the IMF, then the h1(t) is regarded as the first IMF component. Otherwise, repeat the same process until the k iterations from Steps 1 to 3 until h1(t) meets the IMF��s conditions, then c1(t)=hk(t). Stopping criteria (standard deviation, SD, DS) are used in this study, such as
 (1)
(1)
Generally, the SD value is set between 0.2 and 0.3, which is called standard deviation.
Step 4: The first IMF component c1(t) is separated from the original signal x(t), then calculate the first residue signal, denoted by r1(t), r1(t)=x(t)-c1(t).
Step 5: Take the residual signal as the original signal and repeat Steps 1-4 to obtain c2(t), c3(t), ��, cn(t) .
At last we get a collection of all the IMF components and a residue r(t). So the signal x(t) can be expressed as
 (2)
(2)
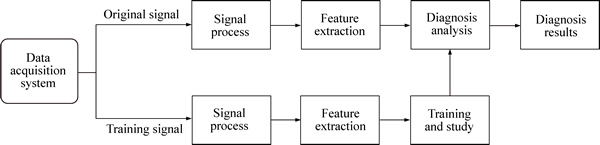
Fig. 1 Proposed scheme for locomotive bearing fault diagnosis
2.3 EEMD analysis
Currently, although EMD algorithm is widely used in the vibration signal process, it still has the problem of mode mixing. To solve this problem, WU and HUANG [17] proposed the EEMD algorithm, which is a kind of noise-assisted data analysis technology. This algorithm defines the IMF components as the mean of an ensemble of trials. Each trial consisted of the decomposed results of the original signal and a white noise with finite amplitude decomposed by EMD algorithm.
The mechanism of how to avoid mode mixing problem in EEMD algorithm is briefly described as follows. In the process, white noise is added into the signal that needs to be decomposed to make the signal continuous in different scale. Due to the statistical characteristics of the white noise, it has no impact on the original signal after repeating average operation. Therefore, the integral mean value can be treated as the final decomposition results.
The specific steps of EEMD algorithm are listed as follows [18]:
Step 1: Add white noise, zero mean and constant amplitude standard deviation to the original signal
 (3)
(3)
where xi(t) is the signal added with the ith white noise.
Step 2: Decompose xi(t) using EMD algorithm and obtain the respective IMFs marked as cij(t) and a residue of data denoted by ri(t). Where cij(t) is the jth IMF after decomposition, which is the ith added white noise to the original signal.
Step 3: Calculate the above corresponding IMFs and finalize them using an ensemble average way.
 (4)
(4)
where cj(t) represents the jth IMF of EEMD.
The decomposition performance of EEMD highly depends on the selected parameters during the course of EEMD algorithm. Once the parameters in the EEMD change, the decomposition results might be different accordingly. Figure 2 shows a simulation signal to support the above statement. The signal x(t) can be treated as the superposition of three signals (x1(t), x2(t) and x3(t)). x1(t) is an impact signal, x2(t) is a high- frequency sinusoidal signal wave, and x3(t) is a low- frequency sinusoidal signal wave.
The simulation signal is decomposed using EEMD algorithm, and during the process different white noises are used. First, the simulation signal is decomposed with the added white noise (amplitude 0.001). The decomposition results are shown in Figs. 3(a)-(d), respectively. The impact signal (x1(t)) and the high- frequency sinusoidal signal (x2(t)) are decomposed intothe same IMF c2, which means that the mode mixing exists and occurs between high frequency components. This can be ascribed to that the added noise is not large enough to change the position of the extreme.
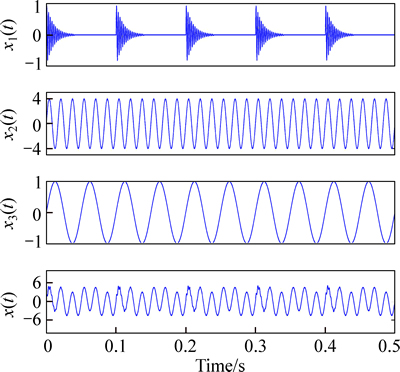
Fig. 2 Three components x1(t), x2(t), x3(t) and simulation signal x(t)

Fig. 3 Partial decomposed results with added noise amplitude of 0.001:
Then, the experimental signal is decomposed using EEMD algorithm with the added white noise (amplitude 0.01, which is the standard deviation). The decomposed results are shown in Figs. 4(a)-(d), respectively. The low frequency sinusoidal signal (x3(t)) is decomposed into IMF c4, and the signal also has mode mixing problem, which occurs between low frequency components. One of the reasons is that the white noise added into the signal is too large which breaks the extreme distribution of the low frequency signals, and results in the mode mixing problem.
According to the above experimental results, the conclusion can be drawn is that IMFs with different frequencies have different sensitivities to the white noise added into the simulation signal in the process of theEEMD algorithm. Nevertheless, the EEMD algorithm always imports the white noise with a constant amplitude and sifting number for the IMFs with different frequencies. The problem of mode mixing still exists in the process of EEMD algorithm and the performance of the EEMD algorithm still need to be further improved.
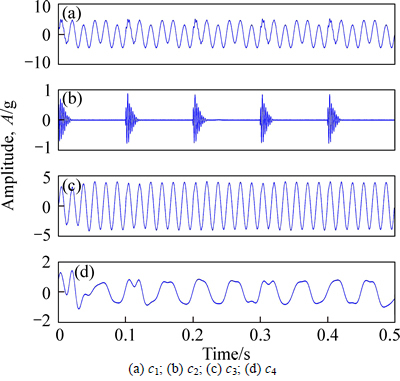
Fig. 4 Partial decomposed results with added noise amplitude of 0.01:
3 Proposed self-adaptive EEMD method
3.1 Proposed method
In the proposed algorithm, based on the fact that IMFs with different frequencies have different sensitivities to white noise, different amplitude noises and sifting numbers are used in different frequency components, which means that large noise and great sifting number are used in obtaining high-frequency components, while small noise and small sifting number are used in obtaining low frequency components. In order to meet the criterion of white noise, many types of signal have been tested to find an appropriate noise signal that amplitude changes as a sinusoidal function of the frequency. In this work, such noise signal was used in the proposed algorithm instead of using white noise statically during the EEMD process. Figure 5 shows the constructed sinusoidal signal, here fs represents the sampling frequency and e represents the amplitude.
The flow chart of the self-adaptive EEMD method is shown in Fig. 6. The flow chart shows the following detailed procedural steps.
Step 1: Set the original signal as x(t), according to the length of signal. The number of the IMF is given [20]:
 (5)
(5)
where L is the signal length.
Step 2: Initialize the number of the ensemble M and the amplitude e of the highest frequency of the added noise, usually, e=0.3 and M=150, let m=1.
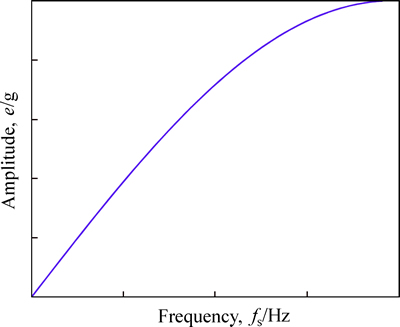
Fig. 5 Spectrum of constructed noise
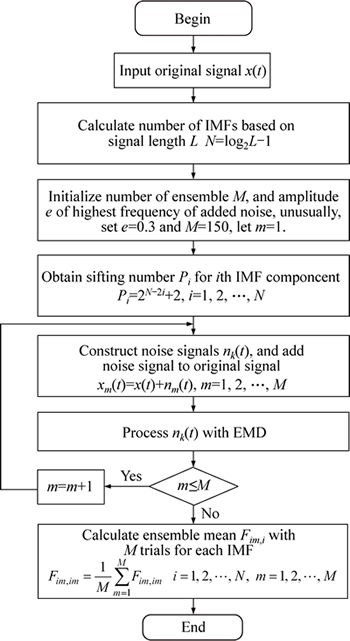
Fig. 6 Flow chart of proposed self-adaptive EEMD method
Step 3: Calculate the sifting number Pi for the ith IMF component adaptively using Eq. (6).
 (6)
(6)
Step 4: Construct the noise signals nk(t) according to Fig. 5, and add the noise signal to the original signal which need to be processed.
 (7)
(7)
Step 5: Process xm(t) and obtain a series IMF components using EMD algorithm, namely as Fim,1m, Fim,2m, ��, Fim,im.
Step 6: Repeat Step 4 to Step 5 with m=m+1 until m=M.
Step 7: Calculate the ensemble mean Fim with the M experimentations for every IMF according to Eq. (8). Use the mean as the final result of the IMF.
 (8)
(8)
3.2 Alogrthm simulation
In this section, an experimental signal is processed using the above proposed algorithm to test this algorithm. Some typical signals in locomotive bearing vibration are chosen to make up the simulation signal. As we know, the impact and modulation signals are two kinds of typical signal in locomotive, so the simulation signal consists of impact and modulation signals. Since a train have different speeds in motion, different kinds of frequency sinusoidal signals were used to represent specific rotating frequencies of the locomotive bearing. Therefore, four signals were selected to represent the different physical meanings of the locomotive bearing in the simulated signals. Figures 7(a)-(e) show the four components and the simulated signal.
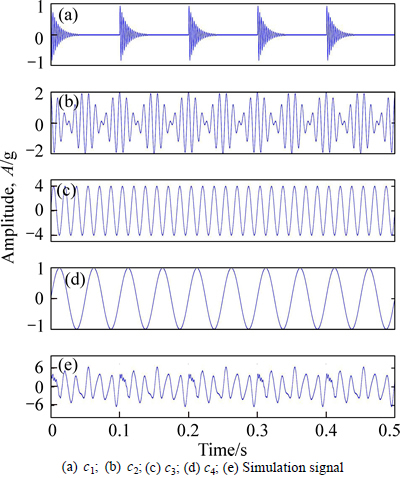
Fig. 7 Four components and simulation signal:
First the proposed algorithm is applied to process the simulated signal to identify the effect of the algorithm. The decomposition results of the first four IMFs are shown in Fig. 8. Obviously, the figures of IMF 1-4 are respectively corresponding to the impact signal, the modulation, the high-frequency sinusoidal components and the low frequency sinusoidal. Compared the results of the IMFs in Fig. 8 with the original signal components in Fig. 7(a)-(d), it could find that different signal components contained in the experimental signal are effectively decomposed by using the proposed algorithm.
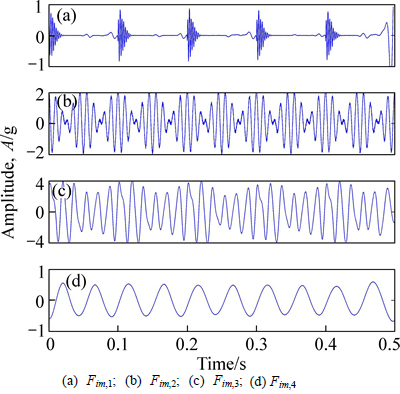
Fig. 8 First four IMFs of simulation signal processed with self-adaptive EEMD method:
To show the validity of the proposed algorithm, the simulated signal is also processed with added noise, the amplitude of which is 0.3 and the sifting number is 20. Figure 9 shows the decomposition results of the IMFs. The mode mixing problem still exists in some IMF components and lead to distortions. For instance, the first IMF component includes both impact signal and modulation signal. Moreover, the fourth IMF component is distorted at some maximum points. The results show that the conventional EEMD is unable to decompose the signal accurately.
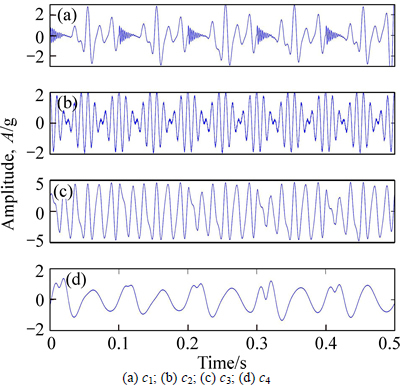
Fig. 9 First four IMFs of simulation signal processed with original EEMD method:
From the above simulations, it could be concluded that the proposed self-adaptive EEMD algorithm is capable of decomposing signal more accurate than EEMD algorithm. In the process of the decomposition, the amplitude of the added white noise signal changes as a sinusoidal function, and the frequency also has a variable sifting number for different IMF components.
4 Application to fault diagnosis of locomotive driving system
4.1 Experimental setup
In this section, the proposed method is applied to diagnose the early flaw fault occurring in locomotive driving system. The locomotive driving system is one of the major components and also one of the typical rotating machineries used in wheel of bogie. It is of great importance to diagnose the fault of the train wheel as early as possible to avoid the casualties and property losses.
Figure 10 shows the train wheel and the location of the vibration data acquisition device. An accelerometer is installed on the locomotive driving system, which is used to acquire the vibration signals. The schematic model of the wheel bogie is shown in Fig. 11. This train wheel consists of a gearbox, a motor, an axle and a pair of wheels. The gearbox connects the motor and the axle.
In this work, two kinds of fault locomotive bearing are tested to evaluate the performance of the self- adaptive EEMD method. A crack at the inner ring and at the outer ring is created respectively to simulate the locomotive bearing faults. Figure 12(a) shows the inner ring fault, and Fig. 12(b) shows the outer ring fault of the locomotive bearing.
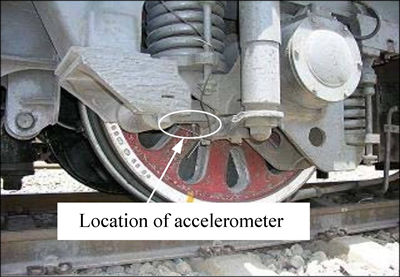
Fig. 10 Location of accelerometer
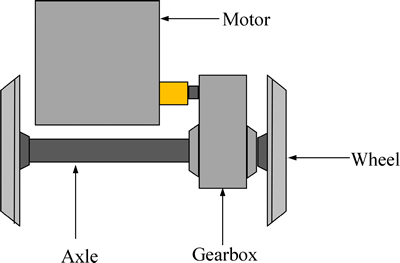
Fig. 11 Schematic model of wheel bogie
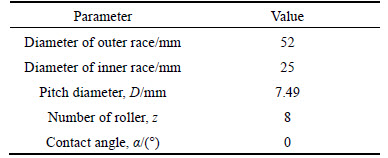
The outer race vibration signal and the inner race vibration signal are used in this work. Each record is digitized at 12 kHz with 16-bit resolution. The experimental locomotive bearing parameters of the gearing are shown in Table 1.
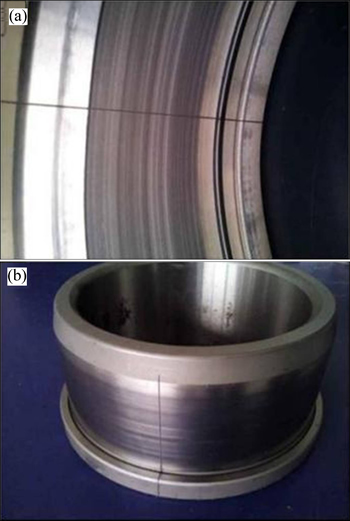
Fig. 12 Inner ring fault (a) and outer ring fault (b) of locomotive bearing
Table 1 Specifications of testing locomotive bearing
4.2 Effectiveness of propsed alogrithm
In those experiments, the effectiveness of the proposed self-adaptive EEMD method is evaluated in comparison with two traditional methods which are EMD spectral analysis and the traditional EEMD spectral analysis. The comparison is conducted in MATLAB on the x32 platform by processing the 2500 points and the built-in functions in MATLAB could enhance the efficiency of programming.
To simulate the fault of the locomotive bearing, an artificial crack with a width of 0.007 mm on the surface of outer race and a width of 0.21 mm on the inner surface are made with a wire-electrode cutting machine. Two sets of data are used to run the test. The acquired vibration signal from the locomotive bearing with the flaw on the outer race is given in Fig. 13(a), Fig. 13(b) shows its frequency spectrum. Figure 14(a) shows the vibration signal with crack on the inner race, and Fig. 14(b) shows its frequency spectrum.
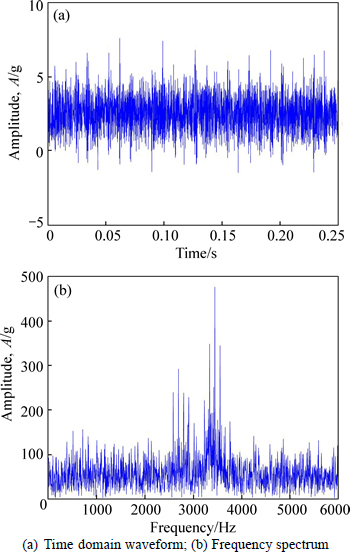
Fig. 13 Vibration signal with cracked on outer race:
From Figs. 13 and 14, we can see that there is a serious of impulses in both of the time-domain waveform. The vibration signal usually contains different kinds of noise, and it is hard to identify the feature of the signal. There is a crack on the bearing in the locomotive driving system which passes the fixed accelerometer every turn. It can be seen that every time the flaw rotates with the bearing, and there is an impulse in the time-domain waveform from which the mainly components of the vibration are collected. Apart from these impulses, it is hardly to find any useful fault characteristics. This might be due to the fault characteristics of the locomotive driving system are hidden by the background noise and some other normal vibration components.
The parameters of the locomotive bearing in Table 1 were used to identify the fault type. The ball pass frequency of the outer race (BPFO, Fbpo) can be obtained by the following formula.
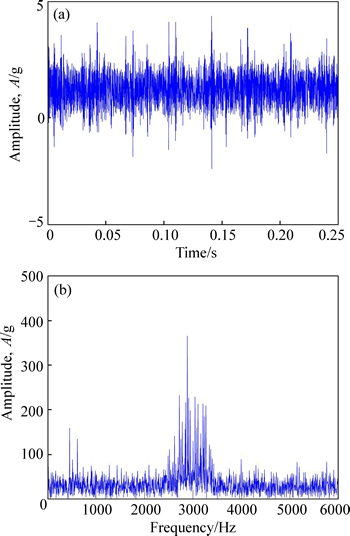
Fig. 14 Time domain waveform (a) and frequency spectrum (b)
 (9)
(9)
If the surface of the outer race suffers a defect, every time the rolling element passes through the crack and periodic impulses will be created with interval ��t as
 (10)
(10)
Similarly, the ball pass frequency of the inner race (BPFI, Fbpi) is given by
 (11)
(11)
According to the parameters of the test locomotive bearing listed in Table 1 and Eq. (9), the outer race characteristic frequency BPFO is 101.5 Hz and the periodical impact interval ��t1 is 0.0099 s. Calculated by using Eq. (11), the inner race characteristic frequency BFPI is 138.2 Hz and the periodical impact interval ��t2 is 0.0072 s.
To extract the fault characteristic of the locomotive bearing with cracks, the proposed self-adaptive EEMD is used to process the acquired vibration signals. The first IMF decomposed by the proposed method contains the most abundant information more than all of the other IMFs, and therefore it has been chosen for further study.
The results on the outer race defect bearing signal are shown in Figs. 15 and 16. Firstly, let us take a look at the time-amplitude results of the analyzed signal. The first IMF of the vibration signal with outer race fault is plotted in Fig. 15. Figure 15(a) is the result processed using EMD method and it is hardly seen any periodicity. In addition, Fig. 15(b) is the result processed using EEMD method with the parameter N=200 which still contains noise signal and hard to distinguish the period. The result obtained by self-adaptive EEMD method is shown in Fig. 15(c), and from Fig. 15(c), it is observed that there are impulses with the period T1=0.0095s, and it is close to ��t1.
Then the spectrum of the analyzed signal for the outer race is shown in Fig. 16. From formula (9), it is calculated that the BFPO is 101.5 Hz. The first IMF of the signal is extracted and its envelop spectrum is shown in Fig. 16(a), where the BPFO can be distinguished. It can be observed that the BFPO component is, however, not obvious enough, and a high frequency domain component with lower energy than BFPO may mislead the diagnosis. Subsequently, the traditional EEMD is utilized to the defective signal. The result is shown in Fig. 16(b), the result is not good enough. Finally, Fig. 16(c) shows the results achieved by the proposed self-adaptive EEMD method. It can be seen the frequency component with the highest energy is just the BPFO, with the BPFO component standing alone in the whole frequency spectrum, which implies the proposed self-adaptive EEMD method is more effective than the EMD envelope spectrum and traditional EEMD spectrum results in Figs. 16(a) and (b).
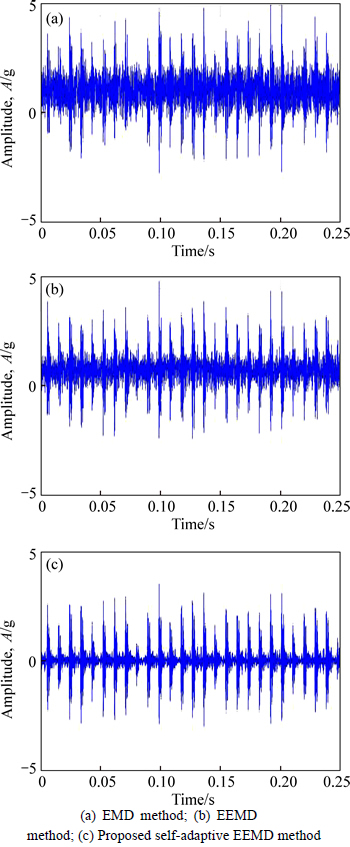
Fig. 15 Analyzed time-amplitude results of outer race fault signal using different methods:
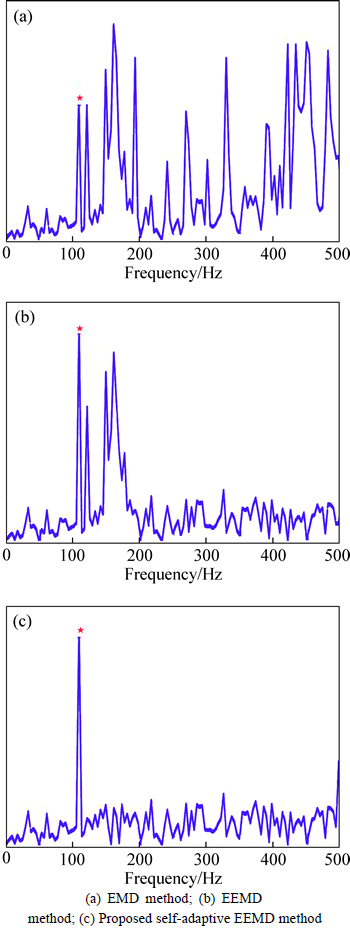
Fig. 16 Analyzed frequency-spectrum results of outer race fault signal using different methods:
To further confirm the effectiveness of the proposed self-adaptive EEMD method, the other type of defective signal is analyzed as follows. For the vibration signal with inner race defect, the time-amplitude results are shown in Fig. 17. Figure 17(a) is the result processed by EMD method and it is hardly to identify the periodicity. In addition, the EEMD method is applied to the defective signal. The results is shown in Fig. 17(b), which still contains noise signal and hard distinguish the period. The result obtained by self-adaptive EEMD method is shown in Fig. 17(c), and from Fig. 15(c), it is observed that there are impulses with the period T1=0.0078 s, which is closely to ��t2.
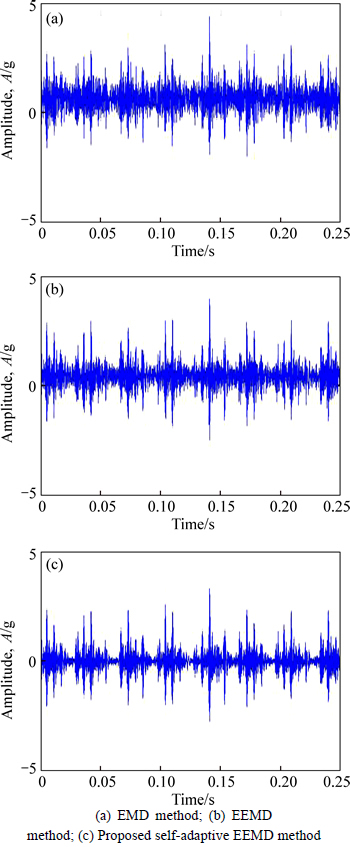
Fig. 17 Analyzed time-amplitude results of inner race fault signal using different methods:
For the signal with inner race defect, the ball passing frequency over the defect BPFI is calculated to be 138.9 Hz. The power spectrum of the EMD-based envelope spectrum is shown in Fig.18(a), the defect characteristic frequencies could not be identified. In addition, it can be observed from the EEMD spectrum from Fig.18(b), the BPFI can be hardly identified as there are several interferential frequency components with higher power than the BPFI component. In comparison, the proposed methods deliver the good results for the signal, as shown in Fig. 18(c), where the BPFI component can be recognized at first sight.
Besides the above qualitative analysis from Figs.15-18, the quantitative analysis is further addressed for a detailed comparison as summarized in Table 2. The duration represents the average time consumption of dealing with two types of fault bearing signals with the above three different methods, which accounts for loading, processing and displaying the data on the x32 platform [3.20 GHz Inter(R) Core(TM)processor, 4 GB memory, 32 bit win7 operating system]. The signal noise ratio (SNR, Rsn) of the output signal is introduced as a criterion to evaluate the performances of the different methods. Here is the definition of the SNR:
 (12)
(12)
where Sd and Sn are the amplitude values corresponding to the frequency of the driving signal and the strongest interference frequency (which means the frequency with the largest amplitude except the driving frequency) in the power spectrum, respectively. The higher SNR indicates a better discrimination between the periodic signal and the noise. When Rsn>0, which implies Sd>Sn, then driving frequency can be marked by searching the highest frequency component.
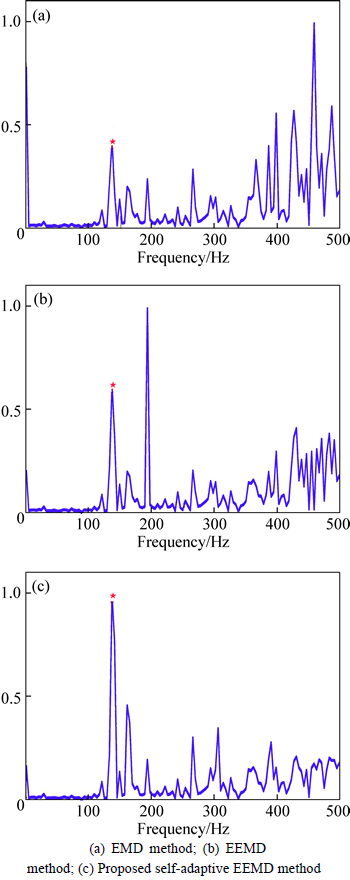
Fig. 18 Analyzed frequency-spectrum results of inner race fault signal using different methods:
Table 2 Quantitative analyses of different methods on x32 platform
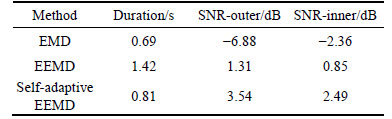
As can be seen from Table 2, the low SNRs for outer race and inner race output signals (Rsn<0) processed with EMD method show that the periodic impact induced by the bearing fault is submerged in the heavy background noise. When the EEMD and the proposed self-adaptive EEMD methods are conducted to deal with the same vibration signals, although it can be found that both of the two methods show a better performance than the EMD spectral analysis methods in processing two kinds of defective signals, the proposed method is much better. The above experimental results show that the weak periodic signals have been enhanced successfully by the proposed method. From the running duration aspect, even though the EMD method spends a small computation time but has poorer efficiency. In addition, the duration of the proposed method is less than that of the EEMD one. As a result, all of the obtained experimental results verify the effectiveness of the proposed self-adaptive EEMD method for train bearing defect identification.
5 Conclusions
A self-adaptive EEMD algorithm is proposed to improve the decomposition performance of the EEMD method in mode mixing for the locomotive driving system in the feature extract and fault diagnosis. Different from the EEMD method with fixed parameters, the amplitude and the sifting number of the added noise are self-adaptively chosen in the process of the decomposition process. Comparing the proposed self- adaptive EEMD algorithm with the EEMD method, it is found that the results decomposed by the proposed algorithm is more accurate. Then the proposed algorithm is applied to diagnose an early fault occurring in locomotive driving system. All the results prove that the proposed algorithm has a better performance than the EEMD in the feature extraction and fault diagnosis.
Nomenclature
x
Original signal
u
Extreme envelope
m
Average value
n
Noise signal
c
IMF component
r
Residue signal
N
Number of the IMF
L
Signal length
P
Sifting number
f
Sampling frequency
e
Amplitude
Abbreviation
EMD
Empirical mode decomposition
IMF
Intrinsic mode function
EEMD
Ensemble empirical mode decomposition
SD
Standard deviation
Superscript
th
Added noise
Subscript
i
Component
References
[1] LIU H W, DONG R H, FENG F. Study on injecting forming technology of railway locomotive bearing retainer [J]. Advanced Materials Research, 2011, 2: 1223-1229.
[2] YU Z W,XU X L,GUO X Y. Failure investigation of a locomotive turbocharger main shaft and bearing sleeve [J]. Journal of Failure Analysis and Prevention, 2011, 11(2): 167-174.
[3] ZHI P,QIU H B,ZHANG H L. Design on on-line monitoring system for locomotive bearing fault based on embedded technology [J]. Railway Computer Application. 2009, 18(10): 35-43. (in Chinese)
[4] LEI Y G, HE Z J, ZI Y Y. EEMD method and WNN for fault diagnosis of locomotive roller bearings [J]. Expert Systems With Applications, 2011, 38: 7334-7341.
[5] LEI Y G, HAN D, LIN J, HE Z. Planetary gearbox fault diagnosis using an adaptive stochastic resonance method [J]. Mechanical Systems and Signal Processing, 2013, 38: 113-124.
[6] LEI Y, LIN J, HE Z, ZI Y. Application of an improved kurtogram method for fault diagnosis of rolling element bearings [J]. Mechanical Systems and Signal Processing, 2011, 25: 1738-1749.
[7] ZHANG J, YAN R, GAO R X, FENG Z. Performance enhancement of ensemble empirical mode decomposition [J]. Mechanical Systems and Signal Processing, 2010, 24: 2104-2123.
[8] TSAKALOZOS N, DRAKAKIS K, RICKARD S. A formal study of the nonlinearity and consistency of the empirical mode decomposition [J]. Signal Process, 2011, 92: 1961-1969.
[9] YAN R, GAO R X. Rotary machine health diagnosis based on empirical mode decomposition [J]. Journal of Vibration and Acoustics-Transaction of the Asme, 2008, 130(2): 1-12.
[10] SHEN C Q, HE Q B, KONG F R, TSE P W. A fast and adaptive varying-scale morphological analysis method for rolling element bearing fault diagnosis [J]. Proceedings of the Institution of Mechanical Engineers, Part C: Journal of Mechanical Engineering Science, 2013, 227: 1362-1370.
[11] WANG S, CHEN X, CAI G, CHEN B, LI X, HE Z. Matching demodulation transform and synchrosqueezing in time-frequency analysis [J]. IEEE Transactions on Signal Processing, 2014, 1(62): 69-84.
[12] BAKKER Q J, GIBSON C, WILSON P, LOHSE N, POPOV A A. Linear friction weld process monitoring of fixture cassette deformations using empirical mode decomposition [J]. Mechanical System and Signal Processing, 2015, 62: 395-414.
[13] LEI Y, LIN J, HE Z, ZUO M J. A review on empirical mode decomposition in fault diagnosis of rotating machinery [J]. Mechanical Systems and Signal Processing, 2013, 35: 108-126.
[14] HU X Y, PENG S L, HWANG W L. EMD Revisited: A new understanding of the envelope and resolving the mode-mixing problem in AM-FM signals [J]. IEEE Transactions on Signal Processing, 2012, 60(3): 1075-1086.
[15] YI J B, QI HUANG Q. The study of low frequency oscillations parameters identification in power system based on improved HHT method [J]. Advanced Materials Research, 2012(433): 781-788.
[16] HE Z, SHEN Y, WANG Q, WANG Y, FENG N Z, MA L Y. Mitigating end effects of EMD using non-equidistance grey model [J]. Journal of Systems Engineering and Electronics, 2012, 23(4): 603-614.
[17] WU Z H, HUANG N E. Ensemble empirical mode decomposition: A noise-assisted data analysis method [J]. Advances in Adaptive Data Analysis, 2009, 1: 1-41.
[18] LEI Y, HE Z, ZI Y. Application of the EEMD method to rotor fault diagnosis of rotating machinery [J]. Mechanical Systems and Signal Processing, 2009, 23: 1327-1338.
[19] LEI Y G, Li N P, LIN J, WANG S Z. Fault diagnosis of rotating machinery based on an adaptive ensemble empirical mode decomposition [J]. Sensors, 2013, 13(12): 16950-16964.
[20] RATO R T, ORTIGUEIRA M D, BATISTA A G. On the HHT, its problems, and some solutions [J]. Mechanical Systems and Signal Processing, 2008, 22: 1374-1394.
[21] SHEN C Q, LIU F, WANG D. A doppler transient model based on the laplace wavelet and spectrum correlation assessment for locomotive bearing fault diagnosis [J]. Sensors, 2013, 13(11): 15726-15746.
(Edited by FANG Jing-hua)
Cite this article as:
WANG Chun-sheng, SHA Chun-yang, SU Mei, HU Yu-kun. An algorithm to remove noise from locomotive bearing vibration signal based on self-adaptive EEMD filter [J]. Journal of Central South University, 2017, 24(2): 478-488.
DOI:https://dx.doi.org/10.1007/s11171-017-3450-3Foundation item: Project(61573381) supported by the National Natural Science Foundation of China; Project(2012AA051601) supported by the National High-tech Research and Development Program of China
Received date: 2015-07-08; Accepted date: 2016-05-24
Corresponding author: WANG Chun-sheng, Professor, PhD; Tel: +86-13875996096; E-mail: wangcsu@csu.edu.cn
Abstract: An improved ensemble empirical mode decomposition (EEMD) algorithm is described in this work, in which the sifting and ensemble number are self-adaptive. In particular, the new algorithm can effectively avoid the mode mixing problem. The algorithm has been validated with a simulation signal and locomotive bearing vibration signal. The results show that the proposed self-adaptive EEMD algorithm has a better filtering performance compared with the conventional EEMD. The filter results further show that the feature of the signal can be distinguished clearly with the proposed algorithm, which implies that the fault characteristics of the locomotive bearing can be detected successfully.
