

Performance of positive and negative electrodes in amorphous manganese oxide supercapacitor
ZHANG Ying(�� Ө)1, LIU Kai-yu(������)1, 2, ZHANG Wei(�� ΰ)1, SU Geng(�� ��)2
1. School of Chemistry and Chemical Engineering, Central South University, Changsha 410083, China;
2. State Key Laboratory of Powder Metallurgy, Central South University, Changsha 410083, China
Received 15 July 2007; accepted 10 September 2007
Abstract:
Using potassium permanganate and acetic manganese as the reactants, amorphous manganese oxide was prepared with mechanochemical method. XRD was used for microstructure characterization, while cyclic voltammetry and constant current charge-discharge were used for electrochemical performance testing. The positive electrode (PE) and negative electrode (NE) were investigated respectively in amorphous manganese oxide supercapacitor, aiming to find their different performances in charging-discharging. The results show that the crystalline structure is destroyed in both the PE and NE material during charge-discharge process. Thereinto, the NE suffers a bit more seriously. When cycling, the PE potential scope diminishes while the NE potential scope enlarges. The increased inner resistance makes the NE curves almost bended to be a right angle, but not the PE curves. The cell��s equivalent series resistance (ESR) is more dependent on the NE, and the capacitance is mainly determined by the rapid descent of the NE potential range. The capacitances of the NE are highly rate-dependent, decreasing from 121.3 to 53.1 F/g, by 56.2%, over the range of 5-25 mV/s. However, the PE appears to be weakly dependent and its capacitance is only dropped by 22.1%.
Key words:
amorphous manganese oxide; pseudo capacitor; positive electrode; negative electrode;
1 Introduction
Owing to their high redox pseudocapacitance, transition metal oxide materials have attracted considerable attention in the research of supercapacitors [1-2]. Thereinto, compared with high-cost and poisonous ruthenium oxide electrodes, manganese oxides with various crystalline structures are promising electrode materials due to their high specific capacitance, high power density, low cost and environmental friendliness[3-5].
Current reports suggested that the amorphous manganese oxides are preferable electrode materials compared with crystalloid ones, because the former could offer more active sites than the latter. Being interested in the charging/discharging mechanism of supercapacitor, people have used all kinds of measurements for investigation. The mechanism of the RuO2 electrode from their discharge state or from their charged state has been proposed to be a coupled electron-proton transfer process[1]. QU[6] studied the proton diffusion process in EMD electrode. The determination of proton diffusion coefficient inside the lattice is an essential step to the understanding of the proton intercalation process.
Nevertheless, as far as we know, researches on the positive electrode (PE) or negative electrode (NE) respectively in supercapacitor are really few. Virtually, parameters such as voltage, resistance, discharge capacitance, of PE are quite different from NE when charging/discharging. It may affect the electrochemical performance of supercapacitor evidently. In the present work, cyclic voltammetry and constant current charge-discharge are used for electrochemical performance testing of PE and NE respectively in amorphous manganese oxide supercapacitor. It aimed to find the differences between PE and NE in charging-discharging, and provide reliable foundation for electrode material choice of performance optimization.
2 Experimental2.1 Material synthesis and characterization
MnO2 was synthesized via an adapted mechanochemical route. Potassium permanganate(KMnO4, AR) and acetic manganese (Mn(CH3COO)2, AR) were mixed together in a hardened steel jar at a mole ratio (KMnO4/Mn(CH3COO)2) of 2?3. The ball-to-powder ratio was 10?1. After 3 h milling, the system turned dark brown. It was then pickled in 0.1 mol/L H2SO4 for 12 h, with continuous stirring by magnetic force, to remove K+. Subsequently, the paste was washed several times with distilled water until pH��7, to remove the acetic acid formed during milling and the redundant reagents, and then dried at 120 �� for 12 h.
The crystallographic structure of as-prepared MnO2 was investigated using a Siemens D500 X-ray diffractrometer (Cu K�� radiation, ��=1.541 8 ?) (XRD).
2.2 Electrode and pseudo capacitor assembly
Electrodes were prepared by mixing the active material with acetylene black (Alfa Aesar, ��99.9%, surface area 80 cm2/g) and polytetrafluoroethlene (PTFE) (5%) with the mass ratio of 75?15?10, absolute ethanol used as emulsion breaker. This resulted in a rubber-like paste that was rolled into a film (0.3 mm thick) on a flat glass surface. Pieces of film (typically 1 cm��1 cm) were cut and pressed on stainless steel grid current collector, dried at 110 �� for 1 h to remove the contained solvent.
Then, charge-discharge tests were done based on ��single electrode�� studies just as Conway presented[1]. An Hg/HgO electrode, used as reference electrode, was inserted between the PE and NE (plane type) in a cell of the type shown in Fig.1. Then, the potentials of each working electrode on charge, discharge, or open circuit (for self-discharge measurements) can be separately recorded against the potential of an appropriately compatible reference electrode.
A BT2000 battery testing instrument and a CHI660 electrochemical work-station were used to perform charge/discharge(1-1.4 V, 750-1 000 mA/g, respectively) and voltammetric measurement (scanning rate of 5-20mV/s). The CV measurement was carried out in a three electrode cell configuration, using an Hg/HgO assembly and 2 cm��2 cm platinum gauze as reference and counter electrodes, respectively.
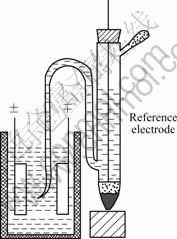
Fig.1 Plane-type test cell with arrangement allowing insertion of reference electrode probe
3 Results and discussion
3.1 XRD characterization of as-prepared MnO2
Fig.2 (a) presents the XRD pattern of the prepared sample, indicating it is poorly crystallized. The diffusion peaks in Fig.1 correspond to the (1 1 0), (2 0 0), (3 1 0), (2 1 1), (3 0 1), (4 1 1), (5 2 1), (0 0 2), (5 4 1) and (3 3 2) planes, from left to right respectively. All these peaks can be indexed to pure tetragonal ��-MnO2 (PDF card 44-0141, a=b=9.785 ?, c=2.863 ?). No characteristic peaks are observed for other impurities such as ��- or ��-MnO2, Mn(OH)2 and Mn2O3. However, there is always a possibility of coexisting potassium ion in the MnO2 matrix arising from KMnO4. The amount of potassium ion may be negligible using XRD.
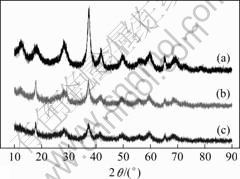
Fig.2 XRD patterns of as-prepared MnO2 (a), PE after 100 cycles (b) and useless NE after 100 cycles (c)
Fig.2 (b) and (c) clearly show the diffusion peaks tail off more or less, and become broadened, suggesting the crystalline structure is destroyed in both the PE and NE material during charge-discharge process. Thereinto, the NE suffers a bit more seriously. However, in spite of that, no other impurities are formed.
3.2 Galvanostatic charging and discharging
The charge/discharge curves of PE and NE cycling at 200 mA/g are shown in Fig.3. After about 150 cycles, the cut-off potential of both PE and NE declines. During charging between 0 and 0.8 V, the cut-off potential of PE decreases from 0.53 to 0.38 V (vs Hg/HgO). At the same time, the cut-off potential of the NE decreases from -0.37 to -0.42 V (vs Hg/HgO). Additionally, the PE potential scope diminishes while the NE��s enlarges. Moreover, the discharge curves are almost linear with a sudden drop of potential at the beginning of charge and discharge associated with the ohmic resistance of the electrode. Initially, the drop is unapparent, and after a few tens of cycles, the curves of PE change slightly. However, the curves of the NE start to bend. At 150th cycles, the curve was almost bended to be a right angle, suggesting increased resistance in discharging.
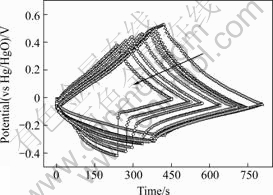
Fig.3 Galvanostatic charge/discharge curves in 10-150 cycles (I=200 mA/g, in 6 mol/L KOH)(The arrow shows the direction of increasing charge/discharge cycles)
Fig.4 reflects the relationship between the capacitance and discharge voltage scope of PE and NE. Eqn.(1) is always used to estimate the specific capacitance C of the capacitor.
C=q/(mV)=It/(mV) (1)
where q is the total charge in a discharging process, F; V is the discharge voltage, V; t is the discharging time, s; I is the charging and discharging current, A; m is the mass of the capacitor, g. In this research, the calculation takes into account only the total mass of active material for conciseness. It should be noted that the capacitance in Fig.4 refers to the capability of simple electrode, which can be easily found to be four times of the capacitor.
The capacitance is found to correspond with the discharge potential ranges of the PE and NE. For PE range, it increases from 0.54 V to 0.56 V in the initial 10
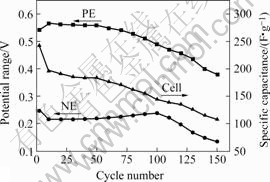
Fig.4 Dependence of discharge specific capacitance of cell on discharge potential ranges of PE and NE in galvanostatic charge/discharge cycling(I=200 mA/g, in 6 mol/L KOH)
cycles, and drops to 0.38 V in the subsequent 140 cycles. For NE range, it reduces from 0.25 V to 0.22 V in the first 10 cycles, then increases to 0.24 V at the 100th cycle, and then rapidly decreases to 0.13 V at the 150th cycle. For capacitance, it declines all through. In this process, it suddenly reduces from 243 F/g at the 2nd cycle to 196.2 F/g at the 10th cycle, in accordance with the rise of the PE discharge potential range and the drop of the NE. Then it slightly declines to 144 F/g at the 100th cycle, namely 0.58 F/g per cycle, in accordance with the tardy decline of the PE range and the ascent of the NE. Finally, it falls to 108 F/g at the 150th cycle, 0.72 F/g per cycle, mainly determined by the rapid descent of the NE range.
The dependence of the equivalent series resistance (ESR) of the cell and the resistances of the PE and NE on the cycling number is presented in Fig.5. The resistances measured are[7]
R=��V/��I (2)
where ��V is the voltage drop at the beginning of the discharge, and ��I=|Icharge|+|Idischarge|.
It is found that the cell��s ESR is more dependent on the NE. During 150 cycles, ESR of the cell increases from 17.1 to 116 ��, 0.66 �� per cycle. For NE, it increases from 4.8 to 91.3 ��, 0.58 �� per cycle, and while for PE, the value almost levels off, only from 0.1 to 3 �� and 0.02 �� per cycle. However, it is clear that the total value of the PE and the NE resistances is much less than the cell��s ESR. Observably, other factors such as current collector, solution and the conduct clamps are opponents of the ESR. They will bring negative effect to the supercapacitor.
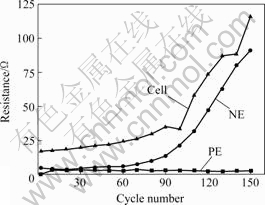
Fig.5 Evolution of resistances for symmetry MnO2 supercapacitor, as well as PE and NE, with cycling density of 200 mA/g in 6 mol/L KOH
3.3 Cyclic voltammetry
Fig.6(a) shows the voltammogram in the whole testing potential range. Fig.6(b) shows that the two pairs of redox peaks appear in the positive potential range,suggesting the Faradic reactions occur, in PE during charging-discharging. But in the negative potential range, no obvious peaks are found.
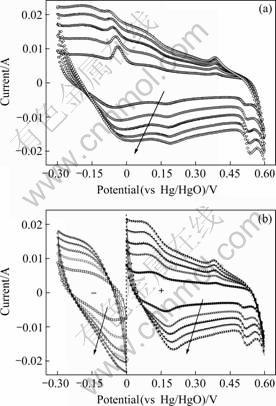
Fig.6 Cyclic voltammograms in 6 mol/L KOH recorded in range of (a) -0.3-0.6 V (for cell), and (b) -0.3-0 V (for NE), 0-0.6 V (for PE) (all vs Hg/HgO) for a sequential series of scanning rates: 5, 10, 15, 20 and 25 mV/s (The arrows show the direction of increasing scanning rate)
From Eqn.(3), it is found that the capacitances of the NE is highly rate-dependent, decreasing from 121.3 to 53.1 F/g, by 56.2%, over the range of s=5-25 mV/s. However, the PE appears to be weakly dependent and its capacitance is only dropped by 22.1%.
![]() (3)
(3)
where q is the charge density accepted or delivered, and the dependence of q on electrode potential (V) is directly determinable as a differential quantity C=dq/dV, and s is the scanning rate.
The dramatic drop is mainly due to the iR-effect which increases with increasing s[1]. Furthermore, the capacitance density of the cell is much less than the sum capacitance of PE and NE all through, suggesting parts of it had been consumed by other opponents.
4 Conclusions
1) The crystalline structure is destroyed in both the PE and NE material during charge-discharge process. Thereinto, the NE suffers a bit more seriously.
2) When cycling, the PE potential scope diminishes while the NE��s enlarges. The increased inner resistance makes the NE curves almost bended to be a right angle, but not the PE curves.
3) The cell��s ESR is more dependent on the NE, and the capacitance is mainly determined by the rapid descent of the NE scope. The capacitance of the NE is highly rate-dependent, decreasing from 121.3 to 53.1 F/g, by 56.2%, over the range of s=5-25 mV/s. However, the PE appearrs to be weakly dependent and its capacitance is only dropped by 22.1%.
AcknowledgementGrateful acknowledgement goes to the Chinese Academy of Sciences for foundation support.
References[1] Conway B E. Electrochemical supercapacitors[M]. New York: Plenum Publishers, 1999.
[2] LIU Kai-yu, ZHANG Ying, ZHANG Wei. Charge-discharge process of MnO2 supercapacitor[J]. Trans Nonferrous Met Soc China, 2007, 17(3): 649-653.
[3] SUBRAMANIAN V, ZHU H W, WEI B Q. Synthesis and electrochemical characterizations of amorphous manganese oxide and single walled carbon nanotube composites as supercapacitor electrode materials[J]. Electrochemistry Communications, 2006, 8(5): 827-832.
[4] TAGUCHI A, INOUE S, AKAMARU S, HARA M, WATANABE K, ABE T. Phase transition and electrochemical capacitance of mechanically treated manganese oxides[J]. Journal of Alloys and Compounds, 2006, 414(1/2): 137-141.
[5] PRASAD K R, MIURA N. Potentiodynamically deposited nanostructured manganese dioxide as electrode material for electrochemical redox supercapacitors[J]. Journal of Power Sources, 2004, 135: 354-360.
[6] QU D Y. The study of the proton diffusion process in the porous MnO2 electrode[J]. Electrochimica Acta, 2004, 49(4): 657-665.
[7] SUBRAMANIAN V, ZHU H W, ROBERT V, AJAYAN P M, WER B Q. Hydrothermal synthesis and pseudocapacitance properties of MnO2 nanostructures[J]. J Phys Chem B, 2005, 109: 20207-20214.
(Edited by YUAN Sai-qian)
Corresponding author: LIU Kai-yu; Tel: +86-731-8830886; E-mail: kaiyuliu@263.net
