
Trans. Nonferrous Met. Soc. China 24(2014) 2991-3000
Kinetics analysis of non-isothermal decomposition of Ag2O-graphite mixture
Seyed Hadi SHAHCHERAGHI1, Gholam Reza KHAYATI2
1. Department of Mineral Processing Engineering, Shahid Bahonar University of Kerman, Kerman, Iran;
2. Department of Materials Science and Engineering, Shahid Bahonar University of Kerman, Kerman, Iran
Received 6 November 2013; accepted 27 February 2014
Abstract:
The thermal decomposition kinetics of Ag2O-graphite mixture was systematically studied using a differential scanning calorimeter (DSC) in terms of model-fitting Malek approach, integral master plot method and model-free advanced isoconversional method of Vyazovkin. The results showed that the thermal decomposition occurred in two stages. The first step was the decomposition process of Ag2O to form porous silver particles as a complex process with the participation of at least two mechanisms, and the second step corresponded to the structural change from porous particles to silver bulk crystals as a single-step process.
Key words:
Ag2O; advanced isoconversional method; kinetic modeling; Sestak�CBerggren model;
1 Introduction
Silver (I) oxide is a highly thermally stable silver source. Kinetic modeling of Ag2O decomposition can provide predictive information on the decomposition control. Firstly, the kinetics and mechanism of the Ag2O decomposition was studied by L��VOV [1], who drew attention to the autocatalytic characteristic of the reaction. These specific features of the reaction are later confirmed by other authors [2-6]. The temperatures in these studies varied from about 173 to 399 ��C, and the activation energies were in the 118-180 kJ/mol intervals. The results showed that the kinetics of the thermal decomposition of Ag2O occurred using a scheme of dissociative evaporation of Ag2O in the form of free Ag atoms and O2 molecules with simultaneous condensation of Ag atoms. Moreover, in the initial stage of the decomposition, which provides condensation of the vapor of the low-volatile product at the interface zone and energy transfer to the reactant, the decomposition precedes much slowly [1-6].
KHAYATI et al [7] investigated the kinetics of the isothermal decomposition of Ag2O with graphite under argon atmosphere for a non-activated sample and mechanically activated sample. The results showed that the mechanisms of nuclei growth in thermal and mechanochemical reduction are diffusion controlled and interface controlled, respectively.
To the best of our knowledge, there is not a great deal of information in literature about the kinetics of the thermal or thermochemical decomposition of Ag2O. In this work, we investigated the kinetics of Ag2O decomposition using model-fitting Malek approach, integral master plot approach and model-free advanced isoconversional approach of Vyazovkin in a systematic and comparative way. Our current contribution will provide the comprehensive data to better understand the mechanism of the dissociation.
2 Experimental
Starting materials were pure Ag2O powder (99% purity, 5-40 ��m, Merck) and graphite (99.9% purity, 10-50 ��m, Merck). Ag2O with 40% (mole fraction) of extra carbon was reduced according to reaction (1):
2Ag2O+C��4Ag+CO2�� (1)
To evaluate the kinetics parameters, 30 mg of the mixture of Ag2O and graphite was selected in each trial. Thermal analyses of Ag2O decomposition were performed under argon flow using a STA409PG device equipped with thermogravimetric system and an Al2O3 crucible. Non-isothermal differential scanning calorimetery (DSC) analyses were carried out from 75 ��C to 500 ��C at the heating rates of 5, 10, 15 and 20 ��C/min. The flow rate of argon was adjusted to 500 mL/min. The samples were characterized by SEM (JEOLJSM 5310) equipped with an energy dispersive spectrometer (EDS) (Oxford Instrument).
3 Theoretical
The rate of decomposition reaction, in general, can be described in terms of two functions, k(T) and f(��), thus,
 (2)
(2)
where �� is the degree of conversion (i.e., proportional to the area under the DSC curve), t is the reaction time, T is the thermodynamics temperature, �� is the heating rate, k(T) is the rate constant and f(��) is the function of reaction mechanism. The dependence of the reaction rate constant on temperature can be described by Arrhenius equation:
 (3)
(3)
where A is the pre-exponential factor, R is the gas constant and Ea is the apparent activation energy.
A relatively complete thermal analysis kinetics method proposed by MALEK et al [8,9] was chosen to analyze the non-isothermal experiment data. The Malek method contains two functions, y(��) and z(��), which was used to find the appropriate kinetic model of the studied process. They are as follows [8,10]:
 (4)
(4)
 (5)
(5)
where u=Ea/(RT) and P(u) are the expression of the temperature integral, which can be well approximated by the fourth rational expression of MALEK [8] and SENUM and YANG [11] as Eq. (6):
 (6)
(6)
Function y(��) is proportional to function f(��), being characteristic for a given kinetic model. The shapes and maxima of both y(��) and z(��) functions, normalized within the (0, 1) interval, provide valuable information for determination of the most appropriate kinetic model to describe the studied process.
According to the Malek method, Ea must be determined independently using other methods. These methods can be generally categorized as isoconversional and model-fitting methods. Generally, isoconversional methods give accurate values of the activation energy [12,13].
Model fitting methods depend on the reaction model and also assume the Arrhenius temperature dependent of the rate constant k(T). They do not achieve a clean separation between the temperature dependence k(T) and the reaction model f(��). In addition, the temperature sensitivity of the reaction rate depends on ��. To the best of our knowledge, the best known model-fitting methods are the Coats-Redfern (CR) method [14] and the invariant kinetic parameters (IKP) method [15].
Isoconversional methods can be generally divided into integral method and differential method. The integral method relies on the temperature integral approximation, mainly including the Kissinger�CAkahira�CSunose (KAS) method [16-19] and the Flynn�CWall�C Ozawa (FWO) method. The differential method, such as the Friedman method [10,20], employs the instantaneous values of conversion degree rates, and this method is therefore sensitive to experimental noise. The method uses numerical differentiation of the experimental data to estimate the reaction rates.
There are more complex ��model free�� methods, like the non-linear isoconversional method by VYAZOVKIN and WIGHT [21] and VYAZOVKIN [22], solutions of which can only be obtained using computer algorithms.
The differential method includes some measurement uncertainties. Because the measurement of the reaction rate ��d��/dT (or d��/dt) is sensitive to the determination of the baseline and calibration of the thermal analysis equipment, the significant inaccuracy in the rate values can be introduced into due to the difficulty of determining the baseline [19]. Also, inaccuracies arise when the reaction heat shows a noticeable dependence on heating rate [23]. It can be pointed out that applying the limited but quantifiable deviation in integral method would be better than the differential method, whose deviations are difficult to calculate [19].
An advanced isoconversional method described by VYAZOVKIN et al [24-27], namely Vyazovkin method, is an effective method to detect the complexity of the reaction and evaluating the activation energy as a function of ��. Furthermore, this method has a great calculation accuracy and versatile applicability for various heating programs [23]. Specifically, the Vyazovkin method is applicable to a non-isothermal kinetic process with a series of linear heating, which can be written as [28]
 (7)
(7)
 (8)
(8)
where ��i and ��j represent the different heating rates; T�� and T��-���� are the reaction temperatures corresponding to ��-����, respectively. Minimizing Eq. (7) for each �� with a certain conversion increment (usually ����=0.02) results in the correction of Ea with ��. The detailed descriptions to use the Vyazovkin method to treat calorimetric data can be acquired elsewhere [27,29].
4 Results and discussion
4.1 Characterization of precursor
Figure 1(a) shows the SEM image of precursor. To determine the composition of Ag2O and graphite particles, the EDS point chemical analysis has been employed with the results shown in Figs. 1(b, c). Accordingly, the graphite particles have been elongated into flake-shaped morphology, while Ag2O particles show a relatively equiaxed particles morphology with more uniform distribution of particle size. It can be concluded that due to insufficient mixing, the graphite is not activated and prevents clean Ag2O-to-graphite from contact.
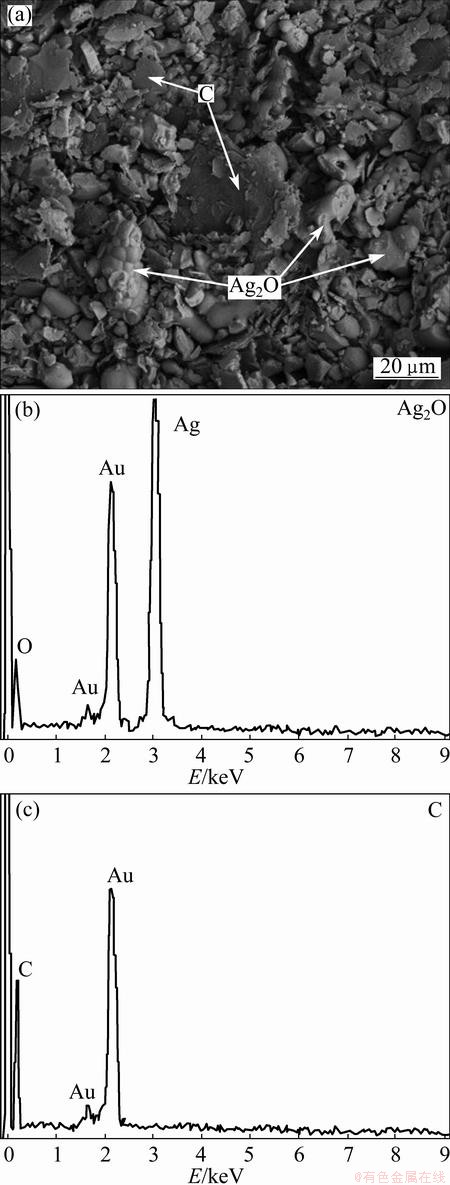
Fig. 1 SEM image (a) and EDS analysis of as-received Ag2O (b) and graphite (c) mixture
4.2 Thermal decomposition of Ag2O powder
The DSC curves of thermal decomposition of Ag2O at four different heating rates (5, 10, 15 and 20 ��C/min) are shown in Fig. 2. Accordingly, due to insufficient mixing, the graphite was not activated and thermal decomposition of Ag2O occurred as an endothermic reaction. As shown, the thermal decomposition of Ag2O occurred in two steps.
Firstly, occurring at 197-217 ��C can be attributed to the Ag2O decomposition to porous silver particles as follows [30-32]:
Ag2O(s)��2Ag(s)+1/2O2(g) (9)
The shoulder at the end of the first peak (for all heating rates) probably can be attributed to the formation of aggregates of silver "atoms" from solid solution in Ag2O crystal as a separate phase, i.e., Ag atoms [6]. On the other hand, each peak or shoulder represents at least one reaction step. So, from Fig. 2, it is obvious that the first step of thermal decomposition of Ag2O is a complex process with the participation of at least two different mechanisms.
Secondly, occurring at 362-400 ��C can be attributed to a structure change from porous particles to silver bulk crystals [33].
Figure 2 shows that, as the heating rate is increased, the endothermic area is shifted to a higher temperature range with expanded peak width. Also, onset reaction temperatures, peak temperatures, and end temperatures (Table 1) are enhanced with increasing heating rate.
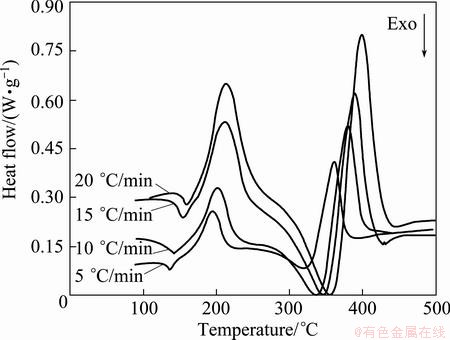
Fig. 2 DSC heat flow rate as function of temperature
Table 1 Typical parameters of Ag2O thermal decomposition
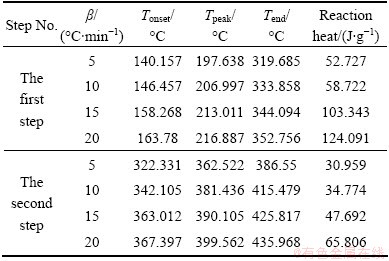
Integration of the peak area produces the reaction enthalpies at different heating rates (Table 1). The reaction enthalpies are hardly affected by the heating rate, and they change within a range of 52.727-124.091 J/g and 30.959-66.806 J/g for the first and second step, respectively.
The conversion curves (��-T curves) for non- isothermal thermal decomposition of Ag2O at different heating rates and for each step of Ag2O decomposition are indicated in Fig. 3. These conversional curves exhibit the sigmoid profile, and the curves shift towards the higher temperature as the heating rate increases, namely, the higher the heating rate, the higher the temperature for the reaction to reach the identical conversion.
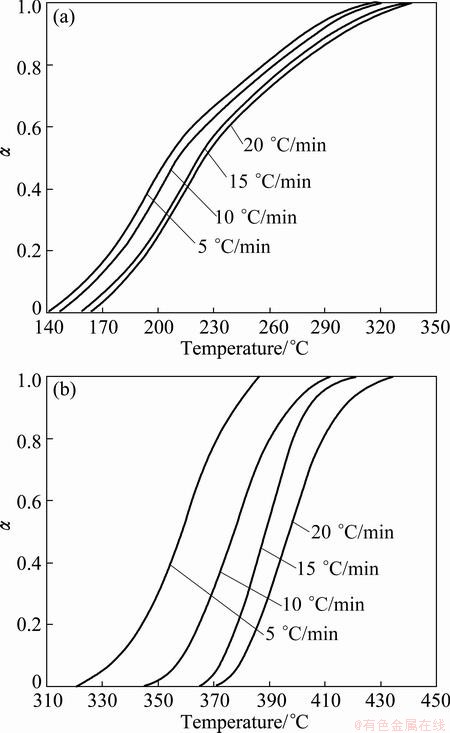
Fig. 3 Changes of �� as function of temperature for the first (a) and second (b) steps of Ag2O thermal decomposition
4.3 Calculation of activation energy (Ea)
The dependence of Ea versus �� for each step of thermal decomposition of Ag2O is presented in Fig. 4.
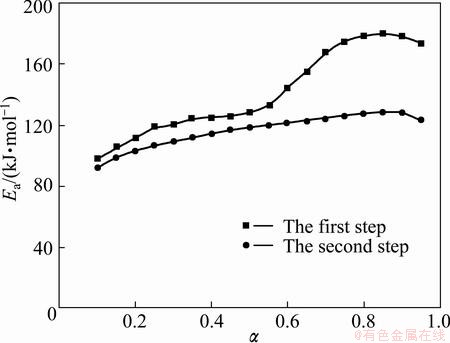
Fig. 4 Dependence of Ea on ��
It can be pointed out that if Ea is independent of ��, the decomposition process is dominated by a single reaction step [34,35]; on the contrary, a significant variation of Ea with �� should be interpreted in terms of multi-step mechanism [34-37]. Therefore, from Fig. 4, it is obvious that the first step of Ag2O decomposition (i.e. Ag2O decomposition to porous silver particles) is a complex process with the participation of at least two mechanisms.
In addition, it can be considered that the Ea is independent of �� if the difference between the maximum and minimum values of Ea is less than 20%-30% of the average Ea [28,38]. Therefore, the dependence of Ea on ��, according to Vyazovkin method, for the first step can be divided into two different regions (����0.55 and ��>0.55). In the first region (����0.55), in the range of 0.10�ܦ�<0.25, we have a linear increase of Ea with ��, while in the range of 0.25�ܦ���0.55, Ea presents an almost stable behavior. In the second region (��>0.55), in the range of 0.55<��<0.70, we have a linear increase of Ea with ��, while in the range of 0.75�ܦ��� 0.95, Ea presents an almost stable behavior. The first and second regions of the first step of Ag2O decomposition can be attributed to the decomposition of Ag2O decomposition to porous silver particles and the formation of aggregates of silver atoms, respectively [6]. Based on the obtained results from the Vyazovkin method, the average values of Ea for the first and second regions of the first step of Ag2O decomposition are 118.953 and 168.871 kJ/mol, respectively (Fig. 4).
In the second step of Ag2O decomposition, in the range of 0.10�ܦ���0.90, we have an almost linear increase of Ea with ��. In addition, from Fig. 4, it is obvious that the difference between the maximum and minimum values of Ea is less than 20%-30% of the average Ea (118.933 kJ/mol). Therefore, Ea presents an almost stable behavior and the second step of Ag2O decomposition is a single-step process.
Basically, the Kissinger method is applied to analyzing the DSC data because it is independent of any pre-assumption about the thermal decomposition mechanism [17]. In this method, the activation energy is calculated from straight line fitting of ln (��/T2p) versus 1000/Tp plots according to Eq. (10) [17]:
 (10)
(10)
where Tp is the temperature corresponding to the maximum of thermal decomposition rate. Figure 5 shows the results of the Kissinger method for the first step of Ag2O decomposition. It is obvious, however, that the Kissinger method accuracy is very high, but the first step of Ag2O decomposition is a complex process with the participation of at least two mechanisms.
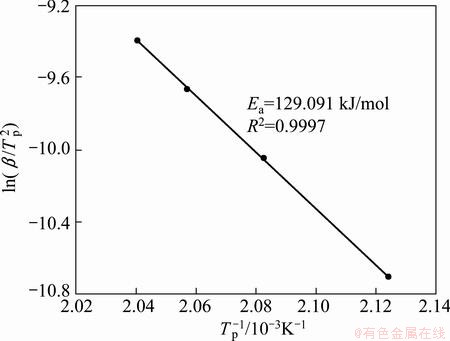
Fig. 5 Kissinger plot for the first step of Ag2O thermal decomposition
As a result, it is worth to note that the Kissinger method might be the simplest method for analyzing the decomposition process, but produces a single value of the activation energy for any process regardless of its actual kinetic complexity [28]. So, this method is applicable only to the single-step process. Therefore, the Vyazovkin method was applied in this work.
4.4 Characterization of reduction products
Figure 6 shows the typical SEM images and EDS point chemical analysis of precursor after heating at the rate of 15 ��C/min and ��=0.65. Accordingly, the Ag products are generally round in shape and somewhat porous structure. As shown in Fig. 6, each Ag particle contains many fine crystallites, namely, during the first step Ag2O is decomposed, and aggregated to each other in the second stage during further heating. Moreover, EDS spectrum reveals that the agglomerates are pure Ag and no impurities such as carbon and oxygen are detected.
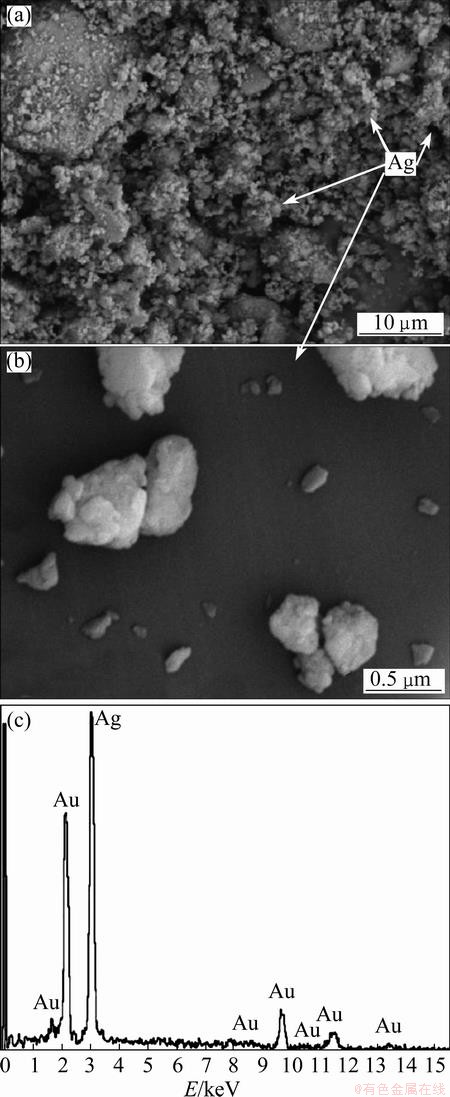
Fig. 6 Typical SEM images (a, b) and EDS analysis (c) of Ag2O-graphite after heating at rate of 15 ��C/min and ��=0.65
4.5 Determination of most probable reaction mechanism
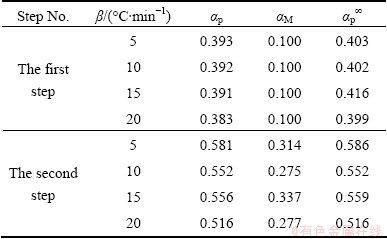
Figure 7 shows the changes of reaction rates ��(d��/dT) as a function of conversion degree for each step of Ag2O decomposition. ��(d��/dT) increases with the heating rate, and the peak reaction rate appears in the conversion range of 0.383�C0.393. This observation likely implies that the heating rate greatly affects the reaction kinetics, but hardly affects the basic reaction mechanisms.
The normalized function curves of y(��) and z(��) are constructed by following Eqs. (4) and (5) for the first step, in the range of 0.1�ܦ���0.55, and the second step of Ag2O decomposition (see Figs. 8 and 9).
These figures clearly indicate that the y(��) curves exhibit peak values appearing at conversion, ��M, 0.100 and 0.277-0.337 for the first and second steps, respectively. The z(��) curves show a ��C�� shaped contour experiencing a practically isoconversional peak value conversion, ��p��, within 0.399-0.416 and 0.516-0.586 for the first and second steps, respectively. Also, it is independent of the applied heating rate. These findings demonstrate that the effect of heating rate on the whole reaction kinetics can be removed by applying the Malek method to the non-isothermal kinetic data of Ag2O decomposition.
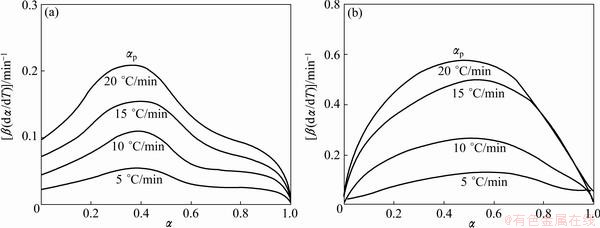
Fig. 7 Reaction rate ��(d��/dT) as function of conversion for the first (a) and second (b) steps of Ag2O thermal decomposition
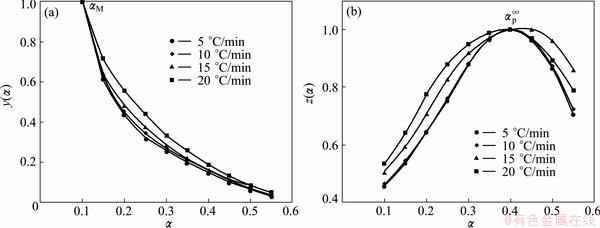
Fig. 8 Plots of normalized y(��) and z(��) against �� for the first step of Ag2O thermal decomposition
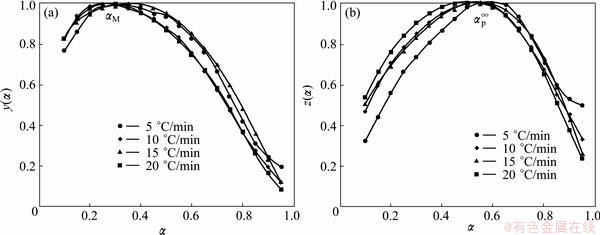
Fig. 9 Plots of normalized y(��) and z(��) against �� for the second step of Ag2O thermal decomposition
The peak value of y(��) appears while conversion is much higher than 0, implying that the reaction is auto-catalyzed [39]. Besides, ��M being larger than zero demonstrates the autocatalytic property of reactions [39]. According to the shape of y(��) and characteristic values of y(��) and z(��), we may draw a conclusion that the truncated Sestak-Berggren model (SB(m, n) model) [8,40-42] or extended Prout�CTompkins model (the regular Prout�CTompkins model is f(��)=��(1-��)) is suitable for kinetic modeling of Ag2O decomposition. In addition, from Table 2, one can observe that 0<��M<��p�� and ��p����0.632, which strongly indicates that the truncated SB(m, n) [41,42] is suitable. It is worth to note that the truncated SB(m, n) is not suitable for kinetic modeling of the first step of the Ag2O decomposition in the range of 0.55<����0.95 because the SB(m, n) conditions are not indefeasible.
Table 2 Characteristic peak conversion values of ��p, ��M and ��p��
SESTAK and BERGGREN [42] have proposed an empirical model for f(��) as follows:
f(��)=��m(1-��)n[-ln(1-��)]s (11)
According to the Sestak-Berggren model, the combination of m, n, and s can represent a number of different reaction models. The increasing value in the exponent m indicates a more important role of the precipitated phase on the overall kinetics. It also presents that a higher value of the second exponent (n>1) indicates increasing reaction complexity [41,42]. Furthermore, value of the exponent s can give us information about the nucleation properties of a given complex mechanism of the tested process [41,42]. It is generally used in truncated form (s=0 in Eq. (11)). The truncated Sestak�CBerggren model is an example of an autocatalytic model. According to the truncated SB(m, n) model and Eq. (3), Eq. (2) can be transformed into [41,42]
 (12)
(12)
where m and n are the reaction orders, and other parameters have the same meaning as the above equations. The ratio of m to n, p, equals ��M/(1-��M) according to the results by MALEK [8]. Thus, Eq. (12) can be transformed into
 (13)
(13)
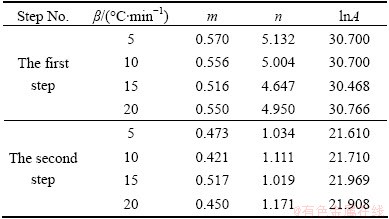
The kinetic parameter n can be derived from the slope of ln ��(d��/dT)exp[Ea/(RT)] versus ln ��p(1-��) for 0.20�ܦ���0.95 [43], and the intercept is ln A, and m=pn. These data perform good linearity (Fig. 10). The values of m, n and ln A can be calculated from the intercept and slope of these fit straight lines, which are listed in Table 3. The higher value of the kinetic parameter n (n>1) indicates the increasing complexity of the decomposition process [42]. Therefore, the first step of the Ag2O decomposition is a process with the complexity higher than that of the second step.
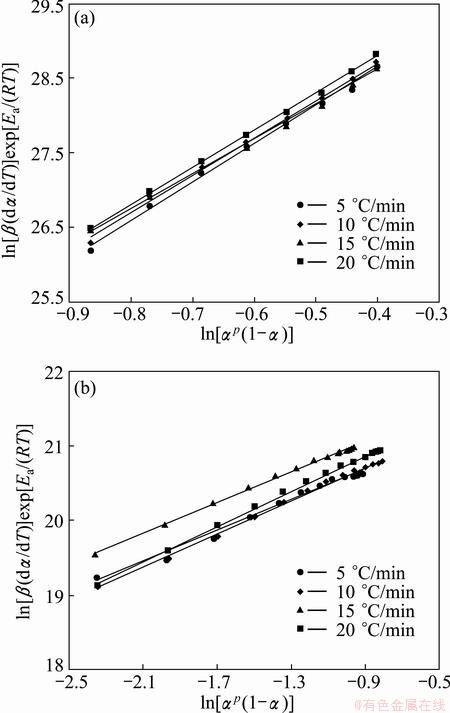
Fig. 10 Plots of ln[��(d��/dT)]exp[Ea/(RT)] vs ln[��p(1-��)] at different heating rates for the first (a) and the second (b) steps of Ag2O thermal decomposition
By substituting calculated kinetic parameters (n, m and ln A in Table 3 along with previously calculated Ea) into Eq. (13), the explicit rate equations for the first step, in the range of 0.10�ܦ���0.55, and the second step of the Ag2O thermal decomposition are obtained by Eqs. (14) and (15), respectively.
Table 3 Calculated kinetic parameters m, n and ln A for SB(m, n) model

����[0.10, 0.55] (14)

����[0.10, 0.95] (15)
To check the predictability of the explicit kinetic models (Eqs. (14) and (15)), the predicted rate curves of different heating rates are calculated (Fig. 11). From Fig. 10, there is a very good agreement between the experimentally obtained ��(d��/dT)-T curves and numerically calculated rate curves for the Ag2O decomposition, using the corresponding kinetic triplets. Hence, the truncated SB(m, n) model is suitable for predicting kinetic rate for describing the progress of the non-isothermal decomposition of Ag2O powder.
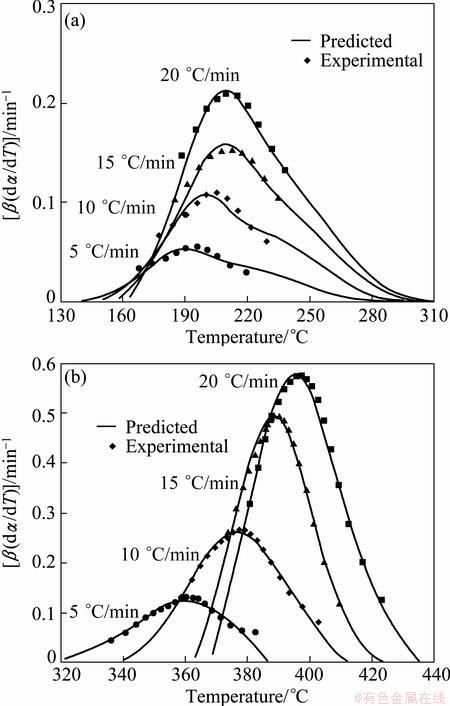
Fig. 11 Comparison of experimental reaction rate and that predicated from SB (m, n) model vs temperature for the first (a) and second (b) steps of Ag2O thermal decomposition
To determine the suitable kinetic model for the first step of Ag2O decomposition (0.55<����0.95), the integral master plot method can be applied. Figure 12 shows the theoretical integral master curves for P1/4(f(��)=4��3/4), P1/3 (f(��)=3��2/3) and P1/2 (f(��)=2��1/2) kinetic models, and also the experimental master curves (symbols). It can be seen from Fig. 12 that the experimental master curves (at all heating rates) are in good agreement with the theoretical master curve for P1/4 model. As a result, the first step of the Ag2O thermal decomposition process in the range of 0.10�ܦ���0.55 follows an autocatalytic model (Eq. (14)), and follows an acceleratory rate model (nucleation mechanism) in the range of 0.55<����0.95.
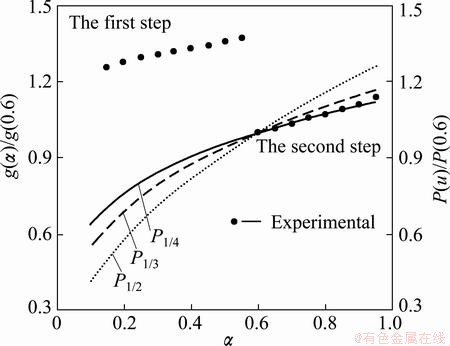
Fig. 12 Comparison between theoretical integral master curve for P1/4, P1/3 and P1/2 kinetic models and experimental master curve for the first step of Ag2O thermal decomposition in range of 0.55<����0.95
5 Conclusions
1) The non-isothermal decomposition kinetics and behaviors of the Ag2O-graphite powder were systematically studied by DSC technique. The DSC results show that due to insufficient mixing of graphite with Ag2O, graphite is not activated and participated in the reaction. Consequently, the thermal decomposition of Ag2O occurs as endothermic reaction in two steps. Firstly, occurring at 197-217 ��C can be attributed to the decomposition of Ag2O to porous silver particles. The shoulder at the end of the first peak probably can be attributed to the formation of silver atoms aggregates in an oxide lattice saturated with silver. Secondly, occurring at 362-400 ��C can be attributed to a structure change from porous Ag particles to silver bulk crystals.
2) In addition, the model-free kinetic analysis with the Vyazovkin method revealed the relationship between Ea and ��, which could reflect the kinetic complexity of the Ag2O thermal decomposition. The results show that the first step of Ag2O decomposition is a complex process with the participation of at least two mechanisms and the second step of Ag2O decomposition is a single-step process.
3) Based on the results obtained by Vyazovkin method calculation, the average values of Ea for the first (0.10�ܦ���0.55) and the second (0.55<����0.95) regions of the first and the second steps of Ag2O decomposition are 118.953, 168.871 kJ/mol and 118.933 kJ/mol, respectively.
4) The model-fitting process kinetic analysis with the Malek method disclosed the typical autocatalytic characteristics for the first (0.10�ܦ���0.55) and the second step of Ag2O decomposition. The further analysis confirms that the Sestak�CBerggren model is suitable for kinetic prediction of the process rates, and a complete set of the kinetic parameters for each model is calculated. Besides, the explicit rate equations are established. The kinetic predictions of process rates from the rate equations are made in good agreement with the experimental results. Furthermore, the first step of the Ag2O thermal decomposition process in the range of 0.10�ܦ���0.55 follows an autocatalytic model, and follows an acceleratory rate model (nucleation mechanism) in the range of 0.55<����0.95.
5) In the future, we plan to analyze the effect of mechanical activation of starting materials by high energy planetary ball mill. We also try to investigate the effect of practical parameter of milling such as milling time on kinetics consideration of thermochemical decomposition of Ag2O powder.
References
[1] L��VOV B V. Kinetics and mechanism of thermal decomposition of silver oxide [J]. Thermochimica Acta, 1999, 333: 13-19.
[2] BENTON A F, DRAKE L C. Kinetics of reaction and adsorption in the system silver-oxygen [J]. American Chemical Society, 1934, 56: 255-263.
[3] HOOD G C, MURPHY G W. The decomposition of silver oxide��An autocatalytic reaction [J]. Chemical Education, 1949, 26: 169-172.
[4] GARNER W E, REEVES L W. The thermal decomposition of silver oxide [J]. Transactions of the Faraday Society, 1954, 50: 254-260.
[5] HERLEY P J, PROUT E G. The thermal decomposition of silver oxide [J]. American Chemical Society, 1960, 82: 1540-1543.
[6] ALLEN J. The thermal decomposition of silver (I) oxide [J]. Australian Journal of Chemistry, 1960, 13: 431-442.
[7] KHAYATI G R, JANGHORBAN K, SHARIAT M H. Isothermal kinetic study of mechanochemically and thermally synthesized Ag from Ag2O [J]. Transactions of Nonferrous Metals Society of China, 2012, 22: 935-942.
[8] MALEK J. The kinetic analysis of non-isothermal data [J]. Thermochimica Acta, 1992, 200: 257-269.
[9] MONSERRAT S, MALEK J. A kinetic analysis of the curing reaction of an epoxy resin [J]. Thermochimica Acta, 1993, 228: 47-60.
[10] FRIEDMAN H L. Kinetics of thermal decomposition of char-forming plastics from thermogravimetry: Application to a phenolic plastic [J]. Polymer Science: Polymer Chemistry Edition, 1964, 6: 183-195.
[11] SENUM G I, YANG R T. Rational approximations of the integral of the Arrhenius function [J]. Thermal Analysis and Calorimetry, 1977, 11: 445-447.
[12] VYAZOVKIN S. Model-free kinetics: Staying free of multiplying entities without necessity [J]. Thermal Analysis and Calorimetry, 2006, 83: 45-51.
[13] CHRISSAFIS K. Complementary use of isoconversional and model-fitting methods [J]. Thermal Analysis and Calorimetry, 2009, 95: 273-283.
[14] COATS A W, REDFERN J P. Kinetic parameters from thermogravimetric data [J]. Nature, 1964, 201: 68-69.
[15] LESNIKOVICH A I, LEVCHIK S V. A method of finding invariant values of kinetic parameters [J]. Thermal Analysis and Calorimetry, 1983, 27: 89-94.
[16] KISSINGER H E. Variation of peak temperature with heating rate in differential thermal analysis [J]. Research of the National Bureau of Standards, 1956, 57: 217-221.
[17] KISSINGER H E. Reaction kinetics in differential thermal analysis [J]. Analytical Chemistry, 1957, 29: 1702-1706.
[18] MITTEMEIJER E J. Analysis of the kinetics of phase- transformations [J]. Materials Science, 1992, 27: 3977-3987.
[19] STARINK M J. The determination of activation energy from linear heating rate experiments: A comparison of the accuracy of isoconversion methods [J]. Thermochimica Acta, 2003, 404: 163-176.
[20] GUPTA A K, JENA A K, CHATURVEDI M C. A differential technique for the determination of the activation-energy of precipitation reactions from differential scanning calorimetric data [J]. Scripta Metallurgica, 1988, 22: 369-371.
[21] VYAZOVKIN S, WIGHT C A. Model-free and model-fitting approaches to kinetic analysis of isothermal and nonisothermal data [J]. Thermochimica Acta, 1999, 340-341: 53-68.
[22] VYAZOVKIN S. Thermal analysis [J]. Analytical Chemistry, 2010, 82: 4936-4949.
[23] SBIRRAZZUOLI N. Is the Friedman method applicable to transformations with temperature dependent reaction heat? [J]. Macromolecular Chemistry and Physics, 2007, 208: 1592-1597.
[24] SBIRRAZZUOLI N, VYAZOVKIN S. Learning about epoxy cure mechanisms from isoconversional analysis of DSC data [J]. Thermochimica Acta, 2002, 388: 289-298.
[25] VYAZOVKIN S, SBIRRAZZUOLI N. Isoconversional kinetic analysis of thermally stimulated processes in polymers [J]. Macromolecular Rapid Communications, 2006, 27: 1515-1532.
[26] VYAZOVKIN S, DOLLIMORE D. Linear and nonlinear procedures in isoconversional computations of the activation energy of nonisothermal reactions in solids [J]. Chemical Information and Computer Sciences, 1996, 36: 42-45.
[27] VYAZOVKIN S. Modification of the integral isoconversional method to account for variation in the activation energy [J]. Computational Chemistry, 2001, 22: 178-183.
[28] VYAZOVKIN S, BURNHAM A K, CRIADO J M, PEREZ-MAQUEDA L A, POPESCU C, SBIRRAZZUOLI N. ICTAC kinetics committee recommendations for performing kinetic computations on thermal analysis data [J]. Thermochimica Acta, 2011, 520: 1-19.
[29] VYAZOVKIN S, SBIRRAZZUOLI N. Kinetic analysis of isothermal cures performed below the limiting glass transition temperature [J]. Macromolecular Rapid Communications, 2000, 21: 85-90.
[30] GASKELL D R. Introduction to the thermodynamics of materials [M]. 5th ed. CRC Press, 2003.
[31] KHAYATI G R, JANGHORBAN K. Preparation of nanostructure silver powders by mechanical decomposing and mechanochemical reduction of silver oxide [J]. Transactions of Nonferrous Metals Society of China, 2013, 23: 1520-1524.
[32] ATKINS P W. Physical chemistry [M]. England, Oxford: Oxford University Press, 1998.
[33] YANG N, AOKI K, NAGASAWA H. Thermal metallization of silver stearate-coated nanoparticles owing to the destruction of the shell structure [J]. Physical Chemistry B, 2004, 108: 15027-15032.
[34] JANKOVIC B, MENTUS S, JELIC D. A kinetic study of non-isothermal decomposition process of anhydrous nickel nitrate under air atmosphere [J]. Physica B: Condensed Matter, 2009, 404: 2263-2269.
[35] BOONCHOM B. Kinetics and thermodynamic properties of the thermal decomposition of manganese dihydrogenphosphate dehydrate [J]. Chemical & Engineering Data, 2008, 53: 1533-1538.
[36] GAO X, DOLLIMORE D. The thermal decomposition of oxalates: Part 26. A kinetic study of the thermal decomposition of manganese (II) oxalate dehydrate [J]. Thermochimica Acta, 1993, 215: 47-63.
[37] VLAEV L T, NIKOLOVA M M, GOSPODINOV G G. Non-isothermal kinetics of dehydration of some selenite hexahydrates [J]. Solid State Chemistry, 2004, 177: 2663-2669.
[38] BOONCHOM B. Kinetic and thermodynamic studies of MgHPO4��3H2O by non-isothermal decomposition data [J]. Thermal Analysis and Calorimetry, 2009, 98: 863-871.
[39] WAN Jin-tao, BU Zhi-yang, XU Cun-jin, LI Bo-geng, FAN Hong. Learning about novel amine-adduct curing agents for epoxy resins: Butyl-glycidylether-modified poly (propyleneimine) dendrimers [J]. Thermochimica Acta, 2011, 519: 72-82.
[40] MALEK J. A computer program for kinetic analysis of non-isothermal thermoanalytical data [J]. Thermochimica Acta, 1989, 138: 337-346.
[41] SIMON P. Forty years of the Sestak�CBerggren equation [J]. Thermochimica Acta, 2011, 520: 156-157.
[42] SESTAK J, BERGGREN G. Study of the kinetics of the mechanism of solid-state reactions at increasing temperatures [J]. Thermochimica Acta, 1971, 3: 1-12.
[43] KOGA N. Kinetic analysis of thermoanalytical data by extrapolating to infinite temperature [J]. Thermochimica Acta, 1995, 258: 145-159.
Ag2O-ʯī�����ǵ��·ֽ�Ķ���ѧ����
Seyed Hadi SHAHCHERAGHI1, Gholam Reza KHAYATI2
1. Department of Mineral Processing Engineering, Shahid Bahonar University of Kerman, Kerman, Iran;
2. Department of Materials Science and Engineering, Shahid Bahonar University of Kerman, Kerman, Iran
ժ Ҫ������ģ�����Malek�������������߷�����ģ�͵��Ƚ���ת���ʷ������ò�ʾɨ��������ϵͳ�о���Ag2O-ʯī������ȷֽ�Ķ���ѧ������������ȷֽ���������Σ��ڵ�һ�Σ�Ag2O�ֽ��γɶ�����������ù��̸��ӣ����ٴ������ֻ��ƣ��ڵڶ��Σ�������ӷ����ṹ�仯���γɴ�������壬�˹���Ϊ�������̡�
�ؼ��ʣ�Ag2O���Ƚ��ĵ�ת���ʷ�; ����ѧģ�ͣ�Sestak�CBerggrenģ��
(Edited by Xiang-qun LI)
Corresponding author: Gholam Reza KHAYATI; Tel: +98-915-1903477; Fax: +98-341-2114053; E-mail: khayati@uk.ac.ir; khayatireza@gmail.com
DOI: 10.1016/S1003-6326(14)63436-1
Abstract: The thermal decomposition kinetics of Ag2O-graphite mixture was systematically studied using a differential scanning calorimeter (DSC) in terms of model-fitting Malek approach, integral master plot method and model-free advanced isoconversional method of Vyazovkin. The results showed that the thermal decomposition occurred in two stages. The first step was the decomposition process of Ag2O to form porous silver particles as a complex process with the participation of at least two mechanisms, and the second step corresponded to the structural change from porous particles to silver bulk crystals as a single-step process.
