
J. Cent. South Univ. Technol. (2007)05-0696-05
DOI: 10.1007/s11771-007-0133-x ![]()
Multi-scale and multi-fractal analysis of pressure fluctuation in
slurry bubble column bed reactor
WANG Xing-jun(���˾�), HU Li-shun(����˴), SHEN Jun-jie(�����),
YU Zhi-nan(��־�), WANG Fu-chen(������), YU Zun-hong(�����)
(Institute of Clean Coal Technology, East China University of Science and Technology, Shanghai 200237, China)
Abstract��The Daubechies second order wavelet was applied to decompose pressure fluctuation signals with the gas flux varying from 0.18 to 0.90 m3/h and the solid mass fraction from 0 to 20% and scales 1-9 detail signals and the 9th scale approximation signals. The pressure signals were studied by multi-scale and R/S analysis method. Hurst analysis method was applied to analyze multi-fractal characteristics of different scale signals. The results show that the characteristics of mono-fractal under scale 1 and scale 2, and bi-fractal under scale 3-9 are effective in deducing the hydrodynamics in slurry bubbling flow system. The measured pressure signals are decomposed to micro-scale signals, meso-scale signals and macro-scale signals. Micro-scale and macro-scale signals are of mono-fractal characteristics, and meso-scale signals are of bi-fractal characteristics. By analyzing energy distribution of different scale signals��it is shown that pressure fluctuations mainly reflects meso-scale interaction between the particles and the bubble.
Key words:
pressure fluctuation; R/S analysis; multi-scale; multi-fractal; bubble column bed reactor ��
1 Introduction
Slurry bubble column reactors (SBCR) have been used in a wide range of industrial processes, including syngas conversion to fuels and chemicals, heavy oil upgrading, and coal liquefaction[1-5]. These reactors are more popular and gradually replace fixed bed reactors in several important industrial applications, such as the Fischer�CTropsch synthesis. Because of their numerous advantages, such as ability of handling high concentrations slurry of fine particles, good interphase mass transfer rates at low energy input, high selectivity and conversion per pass, better temperature control (isothermal operation), high online factor and simple construction[6-9].
Slurry bubble column beds are characterized by structure heterogeneity and regime multiplicity due to the complex interactions between phases[10-12]. Analysis made under multi-scales of the aforementioned interactions will be of vital importance for the appropriate description of the hydrodynamics in the three-phase flow system.
The current theory shows that there exists deterministic chaos phenomenon in the pressure fluctuation in the slurry bubble column bed, which means that it is impossible to early forecast the hydrodynamics of the slurry bubble column though it has certain non-linear determinacy mechanism[13]. However, the research on combination of the multi-scale method and the non-linear multi-fractal theory has still not been reported in spite of its advantage, which is used to understand the multi-scale structure and the non-linear hypostasis of the slurry bubble columns.
Because the complexity of the gas-liquid-solid phase current mostly represents on the fluctuation of the column pressure signal, it will advance the deep understanding on the complexity of the slurry bubble column fluctuation by catching characteristic information of the pressure fluctuation signals. The wavelet analysis has many advantages because it has great potential on the signal analysis and management, the capture of the characteristic information and any other aspects interested. Therefore, in this study, the pressure fluctuation signals of the slurry bubble column bed were decomposed by the Daubechies second-order wavelet under scales 1-9, and then the multi-fractal character of the pressure fluctuation signals under each scale was studied by the rescaled range (R/S) analysis method[14-15]. Finally, different multi-fractal characteristics were considered as the rule of the multi-scale signals decomposition, and then the pressure fluctuation signals that have similar multi-fractal character were associated with three pressure fluctuation signals of different kinds, i.e. the micro-scale interaction, meso-scale interaction and macro-scale interaction of the system, respectively.
2 Experimental
The experimental slurry bubble column bed was made of Plexiglas, with 0.08 m inside diameter and 2.40 m height, and the equilateral triangular perforated-plate distributor (with pore diameter of 1.3 mm, open area ratio of 1.4%) was installed at the bottom (Fig.1). The gas was distributed at the bottom and rises through the slurry bed to the freeboard above the bed and then to the gas outlet. Experiments were conducted atmospherically at room temperature using air, water and quartz sand as materials. The gas flux was within 0.18-0.90 m3/h. The density of quartz sand was 2 700 kg/m3, and the equivalent diameter was 45 ��m. The concentration of quartz sand in the water was 20% (mass fraction). The pressure transducer, as an indicator of the pressure fluctuation within the bed, was placed at a distance of 0.105 m above the gas distributor and acquired the pressure signals at a frequency of 250 Hz. Example of signals recorded by pressure sensor in the air-water-quartz sand system is shown in Fig.2.
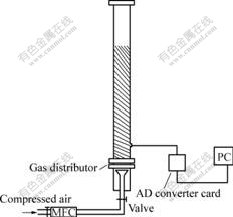
Fig.1 Schematic diagram of experimental setup
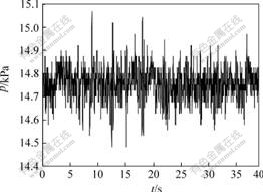
Fig.2 Pressure fluctuation time series
The R/S analysis method is an effective tool to show whether certain time series obey independent and random distribution or non-linear characteristics. This method was brought forward by Hurst while studying the statistical properties of the Nile River overflows; subsequently it was improved, complemented and perfected[16-17]. Based on the statement above, it is well understood that if the gained Hurst exponent invalidates the assumption of an independently and randomly distributed time series, the non-linear and chaotic structure will be expectable. Mandelbrot correlated the multi-fractal dimension D of time series and Hurst exponent H as: D=2-H[18]. Daubechies wavelet with two filter coefficients (Db2) for 9 scales decomposed the pressure signals[19]. It is known that random scale J (J=0, 1, ???��J=0 represents original signal) approximation signals xcJ(k) (k=1, 2, ???, NT) can be decomposed into approximation signals and detail signals of higher scales by Mallat decomposition and reconstruction algorithm[20-21].
3 Results and discussion
3.1 Multi-fractal characteristic of pressure fluctu- ation decomposed signals
The pressure signals at gas flow flux, V=0.54 m3/h and distance Z=0.105 m are decomposed using Db2 wavelet for 9 scales. The results of signals by R/S analysis, the ratio of the range of the cumulative departures to the standard deviation of time series (Rs), are shown in Fig.3. The relationship between lgRs and lgt of approximate signals for the first scale is obvious linear. It is shown that the system has two different hydrodynamic characteristics.
Wavelet analysis has the ability to differentiate the signals from each other that represent different hydrodynamics, as can be seen from Fig.3. The approximate signals are analyzed by R/S method for different scales, and the results are similar. However, for the 9th scale, the lgRs-lgt curve of approximate signals presents obvious linear relationship only once, which indicates the hydrodynamic characteristics of system(Fig.3(a)). Similarly, the detail signals under different scales are shown in Fig.3(b).
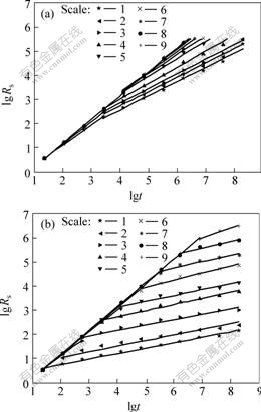
Fig.3 R/S analysis for 9 scale approximation and detail signals at V=0.54 m3/h and Z=0.105 m
(a) Approximation signals; (b) Detail signals
The signals of pressure fluctuation for five different gas fluxes and Z=0.105 m are decomposed by Db2 on 9 levels, and therefore reliable and accurate analysis can be made on the relationships between lgRs and lgt.
The Hurst exponents of decomposed signal for different gas fluxes at Z=0.105 m are shown in Table 1. The fractal performances of the decomposed part of the pressure signals can be seen from the obtained Hurst exponents in Table 1.
From Table 1, it can be seen that the detail signals are turned to be mono-fractal under scale 1 and scale 2 with different gas flow fluxes and the value of Hurst exponent is less than 0.5, which approaches the characteristics of highly anti-persistent processes. It shows that the signals under these two scales represent anti-persistence dynamic characteristics of column dynamics, i.e. approach mostly the micro-scale interaction between the liquid and solid. The detail
Table 1 Hurst exponents of decomposed signals for different gas fluxes at Z��0.105 m
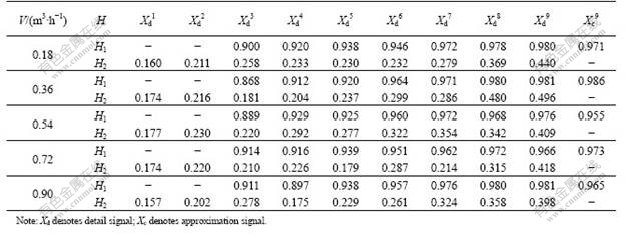
signals under scales 3-9 show the characteristics of the double-fractal and their value of Hurst exponent H1 is higher than 0.5 in the little delay of the time, which shows persistence characteristics. Likewise, the value of the Hurst exponent H2 in the great delay of time is less than 0.5, which shows anti-persistence characteristics. It is concluded that the detail signals under scales 3-9 represent the meso-scale interaction between the liquid- solid phase in the column and the bubble. Furthermore, H1 under the little delay of time describes the dynamic characteristics of the bubble and H2 under the great delay of time describes the dynamic characteristics of the slurry. The approximation signals under the scale 9 only have one Hurst exponent, which is higher than 0.5. The scale 9 means the dynamic characteristics of column fluctuation from the view of a higher scale, so the value of the Hurst exponent represents the macro stability of the whole column and reflects the interaction of the column for macro-scale.
3.2 Multi-scale characteristic of pressure fluctuation
Because of interaction between micro-scale liquid and solid, meso-scale gas-solid phase and bubbling phase, the fractal dimension of the detail signals is very close to Hurst exponent under scales 1-7. However, under scales 8 and 9, Hurst exponent tends to increase (close to 0.5 under scale 9, typical for a random process), and fractal dimension tends to decrease. There exists difference between dynamics of liquid and solid under micro-scale and that of liquid-solid phase and bubble phase under meso-scale, and the former is simpler. In the same meso-scale, the deviation of the fractal dimension from the Hurst exponent indicates that there are several kinds of coupling under different scales of decomposition, i.e. scales 3-9. In that case, the hydrodynamics of liquid- solid phase and bubble phase becomes more complicated.
The fractal dimension and scale for different gas fluxes are shown in Fig.4. The fractal dimension of liquid-solid phase is extremely large and that of bubble phase is relatively small, which shows that the complicacy of the gas-liquid-solid three-phase fluid is mainly due to the more random motion or agglomerated particles.
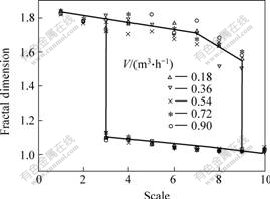
Fig.4 Fractal dimension vs scale at different gas fluxes
According to the principle of three-scale interaction of the pressure fluctuation hydrodynamics, the signals of pressure fluctuation under the micro-scale interaction can be known when the detail signals are integrated under scales 1-2, which come from the decomposition of the wavelet. In the same way, the pressure fluctuation signals under the meso-scale can be obtained from the detail signals under the scales 3-9 and the approximation signals under the scale 9 are the pressure fluctuation signals under the macro-scale.
The energy associated with the discrete wavelet coefficients can be expressed as
![]() (1)
(1)
where E is the total energy of the signal, i.e. ![]()
The energy distributions of the decomposed multi-scale signals are shown in Tables 2-5, and the mass fractions of quartz sand in the water are 0, 3%, 10%, 20%, respectively.
Table 2 Energy distribution for multi-scale signals without solid
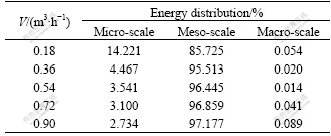
Table 3 Energy distribution for multi-scale signals with 3% quartz sand
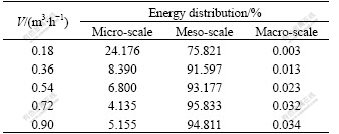
Table 4 Energy distribution for multi-scale signals with 10% quartz sand
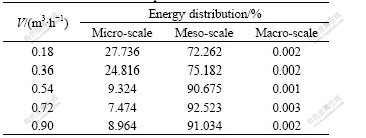
Table 5 Energy distribution for multi-scale signals with 20% quartz sand
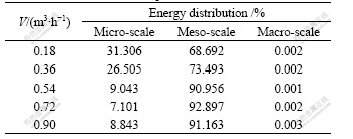
The results of energy distribution show that pressure fluctuation mainly indicates the liquid-solid phases and bubble phase interaction in meso-scale. In the experiment, the energy of meso-scale accounts for 90% of the overall energy when the gas flux is larger than 0.54 m3/h. Energy distribution of meso-scale increases and that of micro-scale decreases with gas flux rising. The signal fluctuation frequency of micro-scale is the highest, manifesting a considerable chaos and most extensive random interaction between the liquid and particle phases. On the other hand, the signal fluctuation frequency of macro-scale is the lowest. Thus, it will be reasonable to conclude that the gas-liquid-solid system demonstrates a combined characteristic of overall stability and integrality and local fluctuations.
4 Conclusions1) Based on the measured pressure fluctuation signals of slurry bubble column reactor with a column of diameter 0.08 m at different gas fluxes, it is concluded that there are characteristics of multi-scale and multi-fractal of pressure signals in a slurry bubble column bed. Signals are analyzed by R/S method and it is found the Hurst exponents and fractal dimensions of the pressure fluctuation signals are nearly the same at different gas fluxes.
2) Under scales 1 and 2, the detail signals give only one Hurst exponent that is lower than 0.5, describing the interaction between micro-scale liquid and particle. On the contrast, there are one Hurst exponent lower than 0.5 and one Hurst exponent great than 0.5, which represent the meso-scale interaction between liquid and solid and that among bubble phases under scales 3-9. Finally, the approximation signals under scale 9 give one Hurst exponent greater than 0.5, which embodies the interaction between the fluid-solid systems. Experimental pressure signals can be decomposed into micro-scale, meso-scale and macro-scale signals, and the pressure fluctuation signals show the interaction between liquid-solid and bubble under the meso-scale.
References[1] STOLOJANU V, PRAKASH A. Hydrodynamic measurements in a slurry bubble column using ultrasonic techniques[J]. Chemical Engineering Science, 1997, 52(21/22): 4225-4230.
[2] FAN L S. Gas-liquid-solid Fluidization Engineering[M]. Boston: Butterworths, 1989.
[3] ISHIBASHI H, ONOZAKI M, KOBAYASHI M, et al. Gas holdup in slurry bubble column reactors of a 150 t/d coal liquefaction pilot plant process[J]. Fuel, 2001, 80(5): 655-664.
[4] MARETTO C, KRISHNA R. Design and optimization of a multi-stage bubble column slurry reactor for Fischer�CTropsch synthesis[J]. Catalysis Today, 2001, 66(2/4): 241-248.
[5] ZHANG J P, LI Y, FAN L S. Discrete phase simulation of gas-liquid-solid fluidization systems: Single bubble rising behavior[J]. Powder Technology, 2000, 113(3): 310-326.
[6] INGA J R, MORSI B I. Effect of operating variables on the gas holdup in a large-scale slurry bubble column reactor operating with an organic liquid mixture[J]. Industrial and Engineering Chemistry Research, 1999, 38(3): 928-937.
[7] GANDHI B, PRAKASH A, BERGOUGNOU M A. Hydrodynamic behavior of slurry bubble column at high solids concentrations[J]. Powder Technology, 1999, 103(2): 80-94.
[8] ZHOU L X, YANG M, FAN L S. A second-order moment three-phase turbulence model for simulating gas�Cliquid�Csolid flows[J]. Chemical Engineering Science, 2005, 60(3): 647-653.
[9] de SWART J W A, KRISHNA R. Simulation of the transient and steady state behaviour of a bubble column slurry reactor for Fischer�CTropsch synthesis[J]. Chemical Engineering and Processing, 2002, 41(1): 35-47.
[10] LI J H, KWAUK M. Exploring complex systems in chemical engineering��the multi-scale methodology[J]. Chemical Engineering Science, 2003, 58(3/6): 521-535.
[11] LIU M Y, LI J H, KWAUK M. Application of the energy-minimization multi-scale method to gas-liquid-solid fluidized beds[J]. Chemical Engineering Science, 2001, 56(24): 6805-6812.
[12] LI J H, CHENG C L, ZHANG Z D. The EMMS model-its application, development and updated concepts[J]. Chemical Engineering Science, 1999, 54(22): 5409-5425.
[13] LI X X, SHI Y F, GU L L, et al. Chaotic identification of regimes of gas-liquid-solid three-phase co-current flow system[J]. Journal of Chemical Engineering of Chinese Universities, 2002, 16(1): 84-88.
[14] ZHOU W X, PAN B,YU Z H. Algorithm and properties of rescaled range analysis[J]. Journal Nonlinear Dynamics in Science and Technology, 2000, 7(3): 180-191.
[15] CHEN X L, LI D, YU Z H. R/S analysis of the differential-pressure signals of gas-liquid flow on bubble-cap tray plate[J]. Computers and Applied Chemistry, 2005, 22(2): 91-95.
[16] MANDELBROT B B. Intermittent turbulence in self-similar cascade: Divergence of high moments and dimension of carrier[J]. Journal of Fluid Mechanics, 1974, 62(2): 331-358.
[17] COUILLARD M. DAVISON M. A comment on measuring the Hurst exponent of financial time series[J]. Physica A, 2005, 348: 404-418.
[18] MANDELBROT B B. The Fractal Geometry of Nature[M]. New York: W H Freeman and Company, 1982.
[19] SHENSA M J. The discrete wavelet transform: Wedding the atrous and mallat algorithms[J]. IEEE Trans on Signal Processing, 1992, 40(10): 2464-2482.
[20] MALLAT S. A theory for multiresolution signal decomposition: The wavelet representation[J]. IEEE Pattern Analysis and Machine Intelligence, 1989, 11(7): 674-693.
[21] LU X S. LI H Z. Wavelet analysis of pressure fluctuation signals in a bubbling fluidized bed[J]. Chemical Engineering Journal, 1999, 75(2): 113-119.
Foundation item: Project(NCET-05-0413)support by��the Program��for��New��Century��Excellent��Talents��in��University; Project(YB0142112) support by Priming Foundation of East China University of Science and Technology
Received date: 2007-02-26; Accepted date: 2007-04-23
Corresponding author: WANG Xing-jun, PhD, Associate researcher; Tel: +86-21-64252522; E-mail: wxj@ecust.edu.cn
(Edited by ZHAO Jun)
