

Preparation of nanoanatase and its in situ XRD study
LI Guo-hua(�����)1, 2, 3, ZHENG Yi-fan(֣�ŷ�)1, 2, MA Chun-an(������)1, 2, 3, TIAN Wei(�� ΰ)1, 3
1. School of Chemical Engineering and Material Science, Zhejiang University of Technology,
Hangzhou 310032, China;
2. State Key Lab of Breeding Base of Green Chemistry-Synthesis Technology, Hangzhou 310032, China;
3. Research Center of Nano Science and Technology, Zhejiang University of Technology, Hangzhou 310032, China
Received 27 April 2007; accepted 9 June 2007
Abstract:
Phase pure nanoanatase was prepared by sol-hydrolysis of TiCl4 in ammonium sulfate solution. In order to investigate the microstrain effect on nanoanatase transformation, the transformation process of the sample was investigated by in situ XRD. Based on the in situ XRD data, a variation of the diameter and its distribution, and the microstrain of nanotitania particles were estimated with Win XRD software. The results show that the transformation process of nanoanatase can be divided into four steps; a rate competition between the anatase growth and the transformation from anatase to rutile determines the diameter and its size distribution of anatase nanoparticles; and during the phase transformation, the microstrain determines the rates of anatase growth and its transformation.
Key words:
nanoanatase; in situ XRD; phase transformation; size distribution; microstrain;
1 Introduction
Titanium(��) oxide exhibits three polymorphs, viz anatase, brookite and rutile. Out of these, anatase and brookite are two room-temperature stable phases, and will transform into a thermodynamically most stable rutile phase at higher temperature[1]. The transformation from anatase to rutile is metastable-to-stable transformation and there is no equilibrium temperature of the transformation[2]. The transformation temperature range varies from 673 K to 1 473 K, depending on: 1) the method of synthesis, 2) the atmosphere, and 3) the presence of foreign ions[3]. The phase transformation behaviors of the anatase as a function of particle size[4-6] and pH value of the synthesis gel[7] have been reported. The phase transformation behavior[8] and crystal growth within nanoparticles[9] with the help of high-temperature X-ray diffraction technique using synchrotron radiation was investigated. Several kinetic models have been used to describe the experimental observations[10]. Usually, one model best fits one specific study. Each kinetic model is only related to the specified transformation mechanism[10]. This implies that the models up-to-date do not reveal the essence that determinates the phase transformation. It is interesting and necessary to investigate the process of the phase transformation from anatase to rutile, both from a scientific and from a technological point of view[2].
In rutile and anatase, Ti4+ ions occupy the centers of Ti-O octahedrons and are coordinated by six oxygen ions. The numbers of the edges and corners shared by the octahedra vary, and are two and six in rutile, and four and four in anatase, respectively[11]. As the temperature increases, the strain energy of a lattice and the octahedrons dislocation of anatase increase, and this type disordered anatase lattice favors its transformation to a rutile structure[4]. But, to the best of our knowledge, there are few investigations that concern the effect of the microstrain energy on the phase transformation from anatase to rutile.
In this work, the phase pure anatase nanoparticles are prepared by a new approach of sol-hydrolysis, and the phase transformation is investigated by in situ XRD. The relationship between the phase transformation and the size, the size distribution and the microstrain energy of anatase and rutile nanoparticles is reported.
2 Experimental
2.1 Sample preparation
The sample fabrication process can be divided into two steps: the first is the preparation of TiCl4 aqueous sol, and the second is the hydrolysis of TiCl4 aqueous solution at 368 K.
In the first step, commercial titanium tetrachloride (98%, TiCl4, Shanghai Chemical Agent Company, China) was used as a starting material without further purification. 100 mL of titanium tetrachloride liquid was added dropwise into a 200 mL of deionized water, while keeping a mixing course under stirring and its temperature below 313 K in an ice-water bath. After titanium tetrachloride had been added, the mixture liquid was stirred for another 2 h, and then cooled down to room temperature.
In the second step, 50 mL of the above aqueous sol was added into a three-necked flask, and 100 mL of deionized water was added dropwise into the flask while stirring. The flask was fixed in an ice-water bath to keep the temperature of the mixing liquid below 313 K. After deionized water had been added, the system was under stirring for another 30 min. At this period, ammonium sulfate ((NH4)2SO4, AR, Jiangbei Chemical Agent Company, China) was added into the mixture, at a ratio of (NH4)2SO4 to TiCl4 being 2?1, the temperature of the mixture was raised to 333 K and stirred for 1 h, and then to 368 K and stirred for 2 h. The resultants were filtered and rinsed with deionized water for six times and dried under a vacuum of 0.01 Pa at 353 K over night.
2.2 Characterization and data processing
X-ray diffraction was performed with a Thermo X��TRA diffractometer at room temperature, using Cu K��1 radiation source (��=0.154 06 nm) under a voltage of 45 kV and current of 40 mA. XRD patterns were recorded with a step of 0.04? from 15? to 70? at a speed of 2.4 (?)/min. In situ experiments were carried out in an Anton Paar XRK 900 reactor equipped with TCU 750 temperature control unit, from room temperature to 1 173 K under flowing air atmosphere.
The detailed XRD patterns were used to estimate crystallite size and microstrain with a step-scanning mode, a step of 0.02? and counting time of 1 s per step. An instrumental broadening was corrected by using an NIST 1976 (��-Al2O3)( Standard Reference Material from U.S. Department of Commerce National Institute of Standard and Technology) under the same conditions as actual experiments.
All the XRD data obtained in this work were analyzed using a Win XRD software, which was a part of the Thermo X��TRA package supplied by Bruker-AXS Company. The size of crystallite and its distribution, and the lattice microstrains of anatase and rutile were analyzed by line-broadening. An average grain size was obtained by Scherrer formula without considering the effect of lattice microstrain. A reflection broadening in the XRD patterns is attributed mainly to three kinds of contributions: crystallite size, micro-strain, and the instrument itself[12-13]. In order to separate the effect of crystallite size and micro-strain on reflection broadening, Fourier transfer was used for the profile analysis of the reflection broadening. In these XRD experiments, the software based on Warren�CAverbach Fourier transfer (W�CA/FT) method was used to calculate the distribution of crystallite size and micro-strain of anatase.
3 Results and discussion
Fig.1 shows the morphology of the sample as- prepared. The particle of the sample as-prepared is nanosized, and its crystallinity is not very well, as the inserted image shown in Fig.1. The XRD patterns of the sample as-prepared are shown in Fig.2. The results indicate that the sample as prepared is composed of anatase (JCPDS cards No 21-1272).
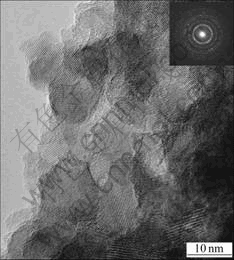
Fig.1 HRTEM image of sample as-prepared
As shown in Fig.2, from room temperature to 773 K, the sample is composed of anatase particles (JCPDS cards No.21-1272) and noncrystalline particles; from 823 K to 1 023 K, the sample is composed of anatase particles mainly; from 1 048 K to 1 123 K, the sample is composed of anatase particles and rutile particles (JCPDS cards No.21-1276). When the temperature is over 1 148 K, the sample is composed of rutile particles. These results indicate that the transformation process from nanoanatase to nanorutile can be divided into four steps: from room temperature to 773 K, 823 K to 1 023 K, 1 048 K to 1 123 K and over 1 123 K, and the starting temperature of the phase transformation from anatase to rutile is around 1 048 K, and the end temperature is over 1 123 K.
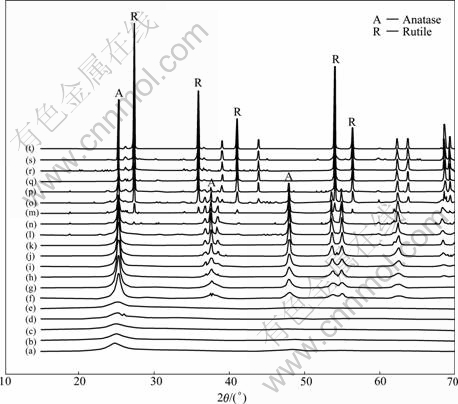
Fig.2 In situ XRD patterns of samples: (a) Room temperature; (b) 523 K; (c) 623 K; (d) 723 K; (e) 773 K; (f) 823 K; (g) 873 K; (h) 898 K; (i) 923 K; (j) 973 K; (k) 998 K; (l) 1 023 K; (n) 1 048 K; (m) 1 073 K; (o) 1 098 K; (p) 1 123 K; (q) 1 148 K; (r) 1 173 K; (s) 1 173 K, 1.5 h; (t) 1 173 K, 2.5 h
Based on the above results, the conclusions can be drawn that the crystal growth of anatase nanoparticles can be divided into four steps: the stable stage of anatase crystallite from room temperature to 723 K; the crystal growth stage of nanoanatase from 773 K to 998 K; the coexistence stage of nanoanatase and nanorutile from 1 023 K to 1 073 K; and the nanorutile growth stage over 1 123 K, at the temperature considered in our experi- ments.
Fig.3 shows the size distribution of anatase particles. The size of anatase particles is around 10 nm, from 5 nm to 16 nm at 873 K; the size of anatase particles is around 22 nm, from 13 nm to 34 nm at 973 K; the size of anatase particles is around 32 nm, from 17 nm to 51 nm at 1 023 K; the size of anatase particles is around 54 nm, from 26 nm to 84 nm at 1 048 K; the size of anatase particles is around 42 nm, from 26 nm to 67 nm at 1 073 K; and the size of anatase particles is around 35 nm, from 17 nm to 51 nm at 1123 K, almost the same with that at 1 023 K.
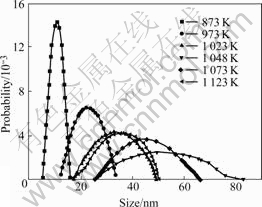
Fig.3 Size distribution of anatase during calcination
Based on the above results, one can see that from 873 K to 1 048 K, the size of anatase nanoparticles increases as the temperature increases, and its distribution range becomes broader and broader. When the temperature is over 1 048 K, the size of anatase nanoparticles decreases as the temperature increases, and its distribution range becomes narrower and narrower. This phenomenon can be attributed to titania phase transformation. During calcination, the crystal size and the crystallinity of anatase increase along with the calcination temperature increasing. When the calcination temperature is high enough, rutile phase forms and the rutile phase is transformed from anatase[14], and the transformation from anatase to rutile occurs automatically. When the calcination temperature is over 1 048 K, anatase begins to transform into rutile, as shown in Fig.2. So, the rate of anatase transforming into rutile is just the rate of rutile growth. Based on the above discussion, the size decrease of nanoanatase implies that the phase transformation rate from anatase to rutile is larger than the rate of anatase growth. This is the reason of the size decrease of anatase.
Fig.4 shows the size distribution of rutile nanoparticles. The size distribution of rutile nanoparticles is around 25 nm, from 14 nm to 40 nm, at 1048 K; and the size distribution of rutile nanoparticles is around 60 nm, from 42 nm to 82 nm, at 1 073 K. The average diameter of rutile nanoparticles at 1 073 K is over two times bigger than that at 1 048 K. These results indicate that when the rutile phase starts to form, the rutile nanoparticles grow rapidly. This conclusion is consistent with that in Ref.[15].

Fig.4 Size distribution of rutile during calcination
Comparing Fig.3 with Fig.4, one can see that the size of rutile nanoparticles is smaller than that of anatase nanoparticles at 1 048 K; and the size of rutile nanoparticles is bigger than that of anatase nanoparticles at 1 073 K.
Fig.5 shows the strain of anatase particles during calcination. From Fig.5, when the calcination temperature is 873 K, the strain of anatase particles is weak. The strain of anatase particles becomes stronger and stronger as the temperature increases, and the strain of anatase particles is the strongest when the temperature is at 1 023 K. The strain of anatase particles becomes weaker and weaker as the temperature is over 1 023 K, and becomes the weakest when the temperature is at 1 123 K, which is almost the same with that at 873 K. Based on the above results, one can draw a conclusion that the strain of anatase particles increases along with the temperature increasing from 873K to 1 023 K, and decreases as the temperature increases over 1 023 K. This is consistent with that of the phase transformation and the size distribution of anatase particles. Combining the crystal size with the microstrain of anatase nanoparticles, we can draw a conclusion that when the microstrain of anatase nanoparticles becomes the strongest, the crystal size of anatase nanoparticles grows rapidly, as shown in Fig.3 and Fig.5.
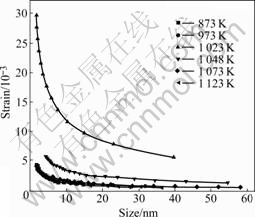
Fig.5 Strain of anatase particles during calcination
Fig.6 shows the microstrain of rutile nanoparticles at 1 048 K and 1 073 K. The microstrain of rutile nanoparticles increases from 1 048 K to 1 073 K.
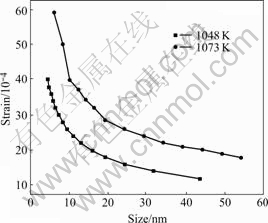
Fig.6 Strain of rutile particles during calcination
Comparing Fig.5 with Fig.6, one can see that the microstrain of rutile nanoparticles is weaker than that of anatase nanoparticles at 1 048 K; and the microstrain of rutile nanoparticles is stronger than that of anatase nanoparticles at 1 073 K. When the calcination temperature is over 1 048 K, anatase begins to transform into rutile, as shown in Fig.2. These results indicate that during the transformation from anatase to rutile, the relative value of the microstrain of nanoparticles changes as the temperature changes. Combined the microstrain with the size distribution of nanoparticles, one conclusion can be drawn that when the microstrain of rutile is stronger than that of anatase, the transformation rate of anatase to rutile is faster than the rate of anatase growth, and when the microstrain of rutile is weaker than that of anatase, the transformation rate of anatase to rutile is slower than the rate of anatase growth. This indicates that the microstrain of nanoparticles plays an important role in the phase transformation from anatase to rutile.
4 Conclusions
1) Phase pure anatase nanoparticles were prepared by sol-hydrolysis of TiCl4 aqueous solution at 368 K.
2) The process of phase transformation from anatase to rutile can be divided into four steps: �� Anatase stable step (from room temperature to 723 K). In this step, the anatase phase is stable and the crystal size of anatase nanoparticles is almost constant. �� Anatase growth step (from 773 K to 998 K). In this step, the sample is composed of anatase phase only, and the crystal size of anatase particles increases slowly. The size distribution of anatase particles broaden stably, and its microstrain increases gradually. �� Transformation step (from 1 023 K to 1 073 K). In this step, the sample is a mixture of anatase phase and rutile phase. The size distribution of anatase nanoparticles broaden from 1 023 K to 1 048 K, and then decreases from 1 048 K to 1 073 K. The microstrain of anatase nanoparticles decreases from 1 023 K to 1 073 K. And the microstrain of rutile nanoparticles increases from 1 048 K to 1 073 K. �� Inheriting step (over 1 123 K). This step is the continuity of the third step, and the sample is composed of rutile phase mostly.
3) The rate competition determines the size distribution and the diameter of anatase nanoparticles. During the phase transformation, the size distribution of anatase is the results of the competition between anatase growth rate and the transformation rate from anatase to rutile. When the growth rate is faster than that of the transformation, the size distribution becomes broad, and the average diameter becomes large. When the growth rate is slower than that of the transformation, the size distribution becomes narrow, and the average diameter becomes small.
4) During the process of the phase transformation, the microstrain determines the rates of the anatase growth and the transformation. When the microstrain of anatase nanoparticles is stronger than that of rutile nanoparticles, the rate of anatase growth is faster than that of transformation from anatase to rutile. When the microstrain of anatase nanoparticles is weaker than that of rutile nanoparticles, the rate of anatase growth is slower than that of transformation from anatase to rutile.
References
[1] ZHANG H Z, BANFIELD J F. Understanding polymorphic phase transformation behavior during growth of nanocrystalline aggregates: Insights from TiO2 [J]. J Phys Chem B, 2000, 104: 3481-3487.
[2] KUMAR K N P. Growth of rutile crystallites during the initial stage of anatase-to-rutile transformation in pure titania and in titania-alumina nanocomposites [J]. Scripta Metallurgica et Materialia, 1995, 32(6): 873-877.
[3] SHANNON R D, PASK J A. Kinetics of the anatase-rutile [J]. Journal of the American Ceramic Society, 1965, 48(8): 391-398.
[4] DEPERO L E, BONZI P, ZOCCHI M, CASALE C, de MICHELE G. Study of the anatase-rutile transformation in TiO2 powders obtained by laser-induced synthesis [J]. J Mater Res, 1993, 8(10): 2709-2715.
[5] LEE J H, NAM W, KANG M, HAN G Y, YOON K J, KIM M S, OGINO K, MIYATA S, CHOUNG S J. Design of two types of fluidized photo reactors and their photo-catalytic performances for degradation of methyl orange [J]. Applied Catalysis A General, 2003, 244 (1): 49-57.
[6] ZHANG H Z, BANFIELD J F. Thermodynamic analysis of phase stability of nanocrystalline titania [J]. J Mater Chem, 1998, 8(9): 2073-2706.
[7] HU Y, TSAI H L, HUANG C L. Phase transformation of precipitated TiO2 nanoparticles [J]. Mater Sci Eng A, 2003, 344: 209-214.
[8] NICULA R, STIR M, SCHICK C, BUREL E. High-temperature high-pressure crystallization and sintering behavior of brookite-free nanostructured titanium dioxide: In situ experiments using synchrotron radiation [J]. Thermochim Acta, 2003, 403: 129-136.
[9] GILBERT B, ZHANG H Z, HUANG F, FINNEGAN M P, WAYCHUNAS G A, BANFIELD J F. Special phase transformation and crystal growth pathways observed in nanoparticles [J]. Geochem Trans, 2004, 4: 20-35.
[10] ZHANG H H, BANFIELD J F. New kinetic model for the nanocrystalline anatase-to-rutile transformation revealing rate dependence on number of particles [J]. American Mineralogist, 1999, 84: 528-535.
[11] MITSUHASHI T, KLEPPA O J. Transformation enthalpies of the TiO2 ploymorphs [J]. Journal of the American Ceramic Society, 1979, 62(7/8): 356-357.
[12] TAO N R, WANG Z B, TONG W P, SUI M L, LU J, LU K. An investigation of surface nanocrystallization mechanism in Fe induced by surface mechanical attrition treatment [J]. Acta Mater, 2002, 50: 4603-4616.
[13] WARREN B E. X-ray diffraction [M]. Dover, New York, USA, 1990.
[14] SHANNON R D, PASK J A. Topotaxy in the anatase1-rutile transformation [J]. American Mineralogist, 1964, 49: 1707-1717.
[15] XIA Bin, HAUANG Hui-zhong, XIE You-chang. Heat treatment on TiO2 nanoparticles prepared by vapor-phase hydrolysis [J]. Mater Sci Eng B, 1999, 57: 150-154.
Foundation item: Projects(20476097, 20276069) supported by the National Natural Science of Foundation of China; Project(Y406094) supported by the Natural Science Foundation of Zhejiang Province, China; Project(2006E10004) supported by Zhejiang Offiice of Science and Technology and Scientific Starting Foundation of Zhejiang University of Technology, China
Corresponding authors: LI Guo-hua; Tel/Fax: +86-571-88320133; E-mail: nanozjut@zjut.edu.cn; ZHENG Yi-fan; Tel/Fax: +86-571-88320961; E-mail: zhengyf1@zjut.edu.cn
