J. Cent. South Univ. Technol. (2011) 18: 353-360
DOI: 10.1007/s11771-011-0703-9
Chromatographic fingerprint analysis of Fructus Aurantii Immaturus by HPLC-DAD and chemometric methods
XU Xiao-na(����)1, 2, JIANG Jun-hui(������)2, LIANG Yi-zeng(������)1,
LI Xiao-ru(������)1, YI Lun-zhao(���׳�)1, CHENG Jin-le(�ɽ���)3
1. School of Chemistry and Chemical Engineering, Central South University, Changsha 410083, China;
2. College of Chemistry and Chemical Engineering, University of South China, Hengyang 421001, China;
3. Zhongzhi Pharmaceutical Limited Company, Zhongshan 528415, China
? Central South University Press and Springer-Verlag Berlin Heidelberg 2011
Abstract: An efficient method for quality control of Fructus Aurantii Immaturus (FAI), a famous traditional Chinese medicine (TCM) was established. A simple and reliable high-performance liquid chromatography-photodiode array detector (HPLC-DAD) procedure coupled with chemometric methods was developed for fingerprint analysis, qualitative analysis and quantitative determination of this herb. In qualitative and quantitative analyses, heuristic evolving latent projection (HELP) method was employed to resolve the overlapping peaks of the tested samples. Two bioactive components, namely hesperidin and naringin, are confirmed and determined, together with four flavonoids compounds tentatively identified including two new ones. From fingerprint analysis, the fingerprint data were processed with correlation coefficients for quantitative expression of their similarity and dissimilarity. The developed method based on an integration of chromatographic fingerprint and quantitative analysis is scientific, and the obtained results can be applied to the quality control of herb medicine.
Key words: fingerprint; quality control; Fructus Aurantii Immaturus; high-performance liquid chromatography; heuristic evolving latent projection method; hesperidin; naringin
1 Introduction
Fructus Aurantii Immaturus (FAI), also called Zhishi in Chinese, is derived from the young fruits of Citrus aurantium L., which belongs to the family of Citrus herbs, Rutaceae. It is a common-used TCM and grows widely in eastern Asia including China, Korea, India and Japan. In pharmacopeia, Zhishi is recorded for dissipating stagnant qi, removing qi stagnation, eliminating sputum and dispersing painful abdominal mass [1]. The major active biological constituents in this herb are flavonoids, especially hesperidin and naringin, and alkaloids, mainly synephrine and N-methyltyramine, and essential oil components [2-3]. Among them, hesperidin, naringin and synephrine are often used as chemical markers for quality evaluation just depending on their useful activities, contents and strong UV adsorptions [4-7].
Several HPLC methods including HPLC-UV, HPLC-DAD-MS/MS and HPLC-MS-MS were reported to determine the bioactive components of FAI and its compound recipe [8-14]. XIE et al [8] determined naringin, hesperidin and neohesperidin in FAI from different places by a RP-HPLC approach. DING et al [10] developed a HPLC-DAD-ESI-MS method to simultaneously separate and determine hesperidin, naringin and synephrine in several Citrus herbs by using perfluorinated carboxylic acids as ion-pairing agents. WANG et al [13] presents microwave-assisted extraction (MAE), HPLC-DAD-MS/MS and high-speed counter- current chromatography (HSCCC) for the rapid extraction, identification, separation and purification of active components from the traditional Chinese medicine FAI. However, those methods only dealt with the quantitation of one or several bioactive compounds, not presenting any information of other components, and some instruments employed, e.g. HPLC-MS and HPLC-MS-MS, are expensive, which cannot be available in common laboratories. Till now, few attempts about systematically chromatographic fingerprint of FAI for quality control have been done, let alone identifying raw herbal materials of different habitats and deploying chemometric resolution methods to analyze the two- dimensional data of this herb.
In the present work, a simple, accurate and valid fingerprint method was described for quality control of FAI by HPLC-DAD and chemometric methods. First, heuristic evolving latent projection (HELP) method [15-16] was employed to resolve the overlapping peaks of the tested herbal materials, and qualitative analysis and quantitative determination were further done on the basis of the resolved results. Second, the correlation coefficients of the 12 fingerprints were calculated for the quantitative expression of their similarity and dissimilarity. Last, all the fingerprints were synthetically assayed.
2 Experimental
2.1 Apparatus and reagent
All HPLC analyses were performed with an Agilent/HP 1100 Series HPLC-DAD system consisting of a vacuum degasser, quaternary pump, manual-sampler, thermostated column compartment and DAD (Agilent, Palo Alto, CA, USA). An ultrasonic cleaner with a frequency of 40 kHz (KQ-3200DF, Kunshan Ultrasonic Instrument Co. Ltd., China) was used for extraction.
The standards of hesperidin (batch number 0721-9909) and naringin (batch number 0722-9805) were purchased from the National Institute for Control of Pharmaceutical and Biological Products (Beijing, China), and here their chemical structures are omitted for terseness. HPLC grade methanol, acetonitrile and polyphosphoric acid were purchased from Jiangsu Hanbon Science and Technology Limited Corporation (Huaian, Jiangsu Province, China).
2.2 Plant materials
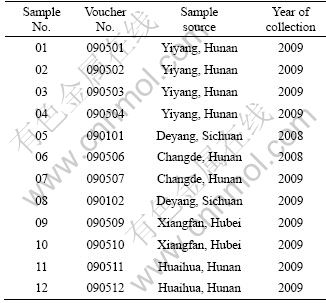
A summary of 12 samples is given in Table 1, collected from different habitats of China by Zhongzhi Pharmaceutical Company (Zhongshan, Guangdong Province, China). Those samples were authenticated morphologically and microscopically at Central South University, China. The specimens were preserved at our laboratory.
Table 1 Summary of tested samples
2.3 Sample preparation
The tested samples were first kept dry for 4 h in the desiccator, ground into powder and passed through a 60-mesh (0.3 mm) sieve. Then 0.5 g sample powder was exactly weighed into a 100 mL conical flask. And then 25 mL anhydrous methanol was added into the conical flask and shaken for a while. At last, the mixture was sonicated at room temperature for 20 min and filtered. The extraction was repeated one additional time and filtered. Both of the extracts were combined, admixed uniformly and diluted. All sample solutions were filtered through a 0.22 ��m nylon filter membrane before HPLC analysis.
2.4 HPLC analysis
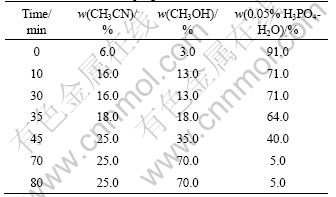
A Sepax C18 (5 ?m, 250 mm��4.6 mm) column and a suitable guard column (C18, 5 ?m, 7.5 mm��4.6 mm) were used for all chromatographic separations. The elution program is listed in Table 2. The mobile phase was composed of CH3CN, CH3OH and 0.05% H3PO4. The chromatographic runs were performed at a flow rate of 0.8 mL/min, the column temperature was set at 30 ��C and the injection volume was 20 ?L. The detection wavelength was set at 284 nm. The representative HPLC-DAD chromatograms of mixed standards and the extract of FAI are shown in Fig.1.
Table 2 Gradient elution program
2.5 Data analysis
2.5.1 Calculation of correlation coefficients
Similarity analysis was performed by traditional Chinese medicine quality control system/extendable data base, which was developed in our laboratory. The correlation coefficients of entire chromatograms among the studied samples were calculated, and the median chromatogram was calculated and generated.
2.5.2 Data resolution
The basal idea of the HELP method is to gain a pure chromatogram and spectrum by a so-called full rank resolution technique after the determination of zero-component and selective regions of the target components. Before applying the HELP method, raw chromatographic data (Aglient file, *.D) was converted into two-dimensional data matrixes (*. Mat files) by using the software developed by our laboratory. Then, the background was deducted and smoothing was done. At last, HELP method was employed to resolve the overlapping chromatographic peaks. The obtained pure chromatograms and UV spectra will be very helpful for further qualitative and quantitative analyses. For conciseness, the fundamental and application procedures were omitted here. Details could be found in Refs.[15] and [16].
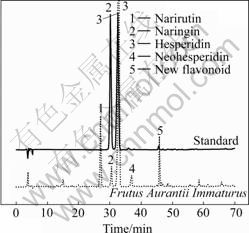
Fig.1 Representative HPLC-DAD chromatograms of mixed standards and extract of Fructus Aurantii Immaturus (Sample No.05 in Table 1)
3 Results and discussion
3.1 Optimization of extraction conditions
Sample pretreatment is one of the most important procedures for HPLC fingerprint analysis of TCM on account of its complexity. A good extraction method not only demands the complete isolation of effective components from the matrix, but also achieves the comprehensive chemical profile. The more and larger the peaks in the chromatograms are obtained, the better the extraction method is. Here, two extraction techniques, refluxing and ultrasound, were carried out. The chromatograms obtained by the two extraction methods are similar in the shape and locations of the peaks but different in the absorption intensities of some peaks, especially the principal peaks. Compared with refluxing extraction, ultrasound technique provides relatively larger peak area of principal peaks with shorter extraction time, so the latter was selected.
An attempt for comparing extraction efficiencies of different solvents was carried out. Methanol, ethanol and their aqueous solutions with different ratios were examined since they are the preferred choice and can effectively extract a variety of compounds with different polarities. The results achieved indicate that different ratio solutions of methanol-water and ethanol-water systems significantly affect the extraction efficiencies. Based on the total peak area of several key peaks and peak number, pure methanol displays the best extraction efficiency and resolution. Thus, pure methanol was chosen as the optimal extraction solvent.
3.2 Optimization of HPLC conditions
The parameters in HPLC was optimized through investigating the influence of the mobile phase and detection wavelength because these two parameters play an important role in resolution and sensitivity. In this work, three mobile phases were investigated, namely CH3OH-H2O, CH3CN-H2O and CH3OH-CH3CN-H2O. Considering the presence of flavonoids in the herbal extraction, a little amount of H3PO4 was added to the mobile phase to reduce the ionization and lower the polarity of these compounds. The obtained results manifest that the CH3OH-CH3CN-H2O system is the optimum mobile phase with the most chromatographic peaks, the strong peak strength and the finest abilities of separation and resolution. So, the selection of mobile phase was accomplished.
Detection wavelength was investigated with DAD in the range of 200-400 nm in order to obtain a large amount of detectable peaks on the HPLC chromatogram of the studied samples. Meanwhile, the UV absorption information of flavonoid compounds was also considered, since they are the main effective compositions of Citrus herbs. In the end, 284 nm was chosen to achieve chromatographic fingerprint profiles and used as the detection wavelength by comprehensive consideration.
3.3 Identification of flavonoid compounds
In this work, the identification of naringin and hesperidin is done by the comparison of their retention time and UV spectra with the corresponding standards, respectively. Because the standards of narirutin and neohesperidin are unavailable, the identification of the two compounds forementioned was conducted by comparing their UV spectra with those of naringin and hesperidin, respectively, and contrasting their elution sequences with the results reported in Refs.[11-13].
Fig.1 shows the effluent sequence of the five capital peaks in the sample, among which peaks 2 and 3 are naringin and hesperidin, respectively. Fig.2 shows the UV spectra of the five peaks marked in Fig.1. In direct- viewing, the UV spectra of hesperidin and peak 4 are very similar, so do peak 1 and naringin. All of their UV spectra exhibit characteristic UV maximum absorbance of flavonoids, namely two maximum absorbance bands: band I (300-400 nm), and band II (220-280 nm) [9, 16-17]. Further, the similarity of UV spectra calculated is 0.990 1 for naringin and peak 1, and is 0.998 2 for hesperidin and peak 4. The two values are very high, which suggests that peaks 1 and 4 are isomers of narirutin and neohesperidin, respectively. Then, the elution sequence of the four compounds mentioned above was compared with the results reported in Refs.[11-13], and the identical elution sequence was gotten. That is to say, narirutin, naringin, hesperidin and neohesperidin were eluted one by one in FAI. Consequently, peaks 1 and 4 were again confirmed to be narirutin and neohesperidin, respectively.
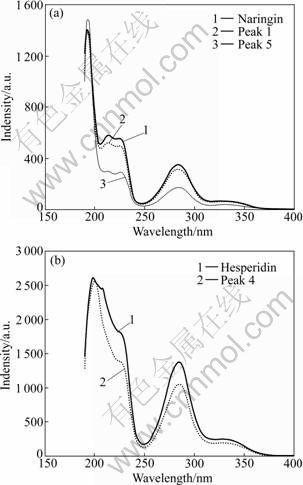
Fig.2 Ultraviolet spectra of compounds
It is interesting to see that the UV spectra of peak 5 eluted at about 45 min (retention time) is also extremely similar to those of naringin and narirutin, which displays the characteristic UV maximum absorbance of flavonoids [9, 17-18]. The values of spectra similarity are 0.966 7 and 0.964 3 for it with the two compounds mentioned above, respectively. So, peak 5 can be tentatively identified to be a new flavonoid compound. For unambiguous identification, further studies are required by other technologies such as mass spectra, and nuclear magnetic resonance spectra.
3.4 Resolution of overlapped peaks by HELP method
TCM fingerprints are very complicated systems, which contain a great number of chromatographic peaks. Though most components of the studied herbal sample are baselines isolated by the optimized HPLC procedure, there are usually many overlapping peaks. In this work, the tested FAI samples also show many overlapping peaks (see Fig.3). Those overlapping peaks will reduce the veracity of qualitative and quantitative analyses, so the HELP resolution method was employed to resolve such two-dimensional data matrixes [15-16].
Here, the chromatographic fragment with the retention time range of 14.61-15.21 min (Fig.4) was taken as an example to illustrate the HELP method briefly. Fig.4(a) represents the original peak cluster. After the background was deducted, noise was removed and smoothing was done, the corresponding two-dimension graph and rank plots were gotten (Fig.5). Finally, by performing the HELP resolution method, the pure chromatogram and UV spectra of the two overlapping peaks (i.e. component 4 and component 5) were obtained (see Figs.4(b) and (c), respectively). The thrilling thing is that the UV spectrograms of component 5, narirutin and naringin are of much resemblance (see Fig.2(a) and Fig.4(c)). Their spectra similarity is 0.976 1 for component 5 and narirutin, and is 0.978 4 for component 5 and naringin. The forementioned similarity values are very high. In combination with the characteristics of UV spectra of flavonoids [9, 17-18], component 5 can be tentatively concluded to be a new flavonoid compound. The results obtained were used to do further qualitative and quantitative analyses.
The other overlapping peaks in the studied samples were also resolved by the HELP method in the same way before qualitative and quantitative analyses.
3.5 Method validation
3.5.1 Linearity and limit of detection
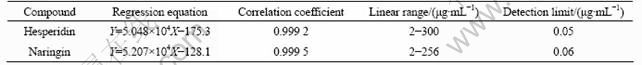
In traditional quality control system, hesperidin and naringin are used as marker compounds to evaluate the quality of Citrus herb, so the contents of hesperidin and naringin in the FAI samples were determined under the optimum conditions. The UV linearity was studied over the concentration range of 2-256 ��g/mL for naringin and 2-300 ��g/mL for hesperidin. The limit of detection (LOD) was measured by injecting serial diluted standard solutions, based on the signal-to-noise ratio of 3 as a criterion. The obtained results are summarized in Table 3.
3.5.2 Reproducibility, stability and recovery
The reproducibility of the method was evaluated by five consecutive injections of the standard solutions. The relative standard deviation (RSD) of the intra-daily is 1.3% for hesperidin, and 1.9% for naringin. And the RSD of inter-daily (three consecutive days) is less than 3.5% for both of the compounds.
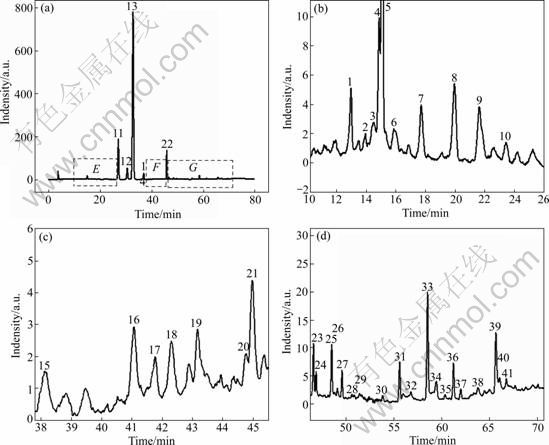
Fig.3 HPLC chromatograms of sample No.05 measured at UV 284 nm: (a) Entire HPLC chromatogram within 80 min; (b), (c) and (d) Magnified spectra corresponding to regions E, F and G of (a), respectively
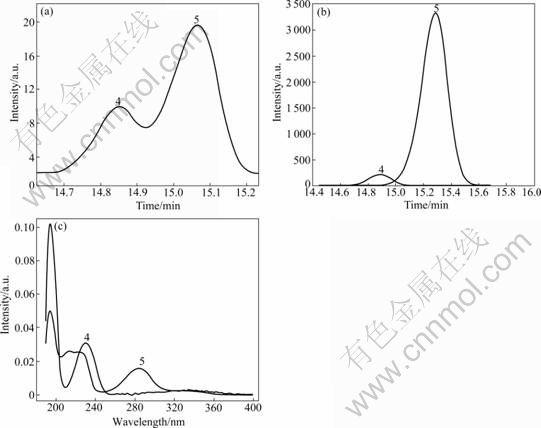
Fig.4 Original peak cluster and pure peaks after resolution by HELP method: (a) Original peak cluster, videlicet peak 4 and 5 of Fig.3(b); (b) Pure chromatographic peaks; (c) Pure UV spectra peaks
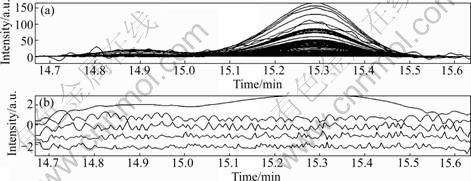
Fig.5 Two-dimensional data plot (a) and rank plot (b)
Table 3 Regression equations and detection limits for hesperidin and naringin
The recovery of the method was studied by calculating the mean recoveries of the analytes using the standard addition method. The reference standards were added at three different concentration levels (approximately equivalent to 0.5, 1.0 and 1.3 times of the concentration of the matrix) with three parallels at each level. The solutions were prepared in accordance with the sample preparation procedure. The recoveries of hesperidin and naringin were tested with No.05 as the matrix. The obtained mean recoveries are 101.9% and 102.5% for hesperidin and naringin, respectively, indicating that the recovery of the proposed method is satisfactory.
3.6 HPLC fingerprint analysis
Based on the definition of the fingerprint of TCM, a chromatographic fingerprint is practically a chromatographic pattern of some common kinds of pharmacologically active and chemically characteristic components in the TCM. This chromatographic profile should feature the fundamental attributions of ��integrity�� and ��fuzziness��, in other words, ��sameness�� and ��differences��. With the help of chromatographic fingerprints, the authentication and identification of herbal medicines can be accurately conducted, even if the quantity of the chemically characteristic constituents is not exactly the same among different samples which belong to the same kind of TCM. The chromatographic fingerprints could reveal both the ��similarity�� and ��dis-similarity�� between various samples successfully. In the present work, 12 batches of FAI samples from different origins in China were analyzed under the optimum chromatographic conditions. The median chromatogram from the studied samples was regarded as the standardized characteristic fingerprint of FAI (see Fig.6).
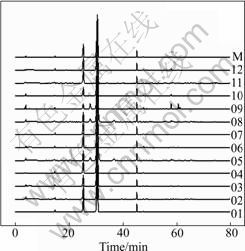
Fig.6 HPLC chromatograms of 12 FAI samples and simulative median chromatogram M
Peaks existing in all chromatograms were considered as ��common peaks��, indicating the sameness among various samples. All the chromatograms of FAI samples contain 28 common peaks and 5-12 non-common peaks within 80 min. Fig.3 shows the representative fingerprints of FAI. Among the common components, hesperidin and narirutin indicate relatively high and stable contents, which is in correspondence with the literatures reported [11-13]. The non-common peaks in each chromatogram, which represents the fuzziness among the same kind of TCM along with the different content of the same component existing in the samples, were examined. It is easy to see that neohesperidin and naringin do not exist in all samples. Sichuan��s samples contain neohesperidin and naringin with relatively low concentrations, and there is a little amount of naringin in the samples of Hubei. Both of them do not exist in the samples of Hunan. It is in accord with the theory that the secondary metabolites of plant herb would clearly vary in different locations. Chinese medicine theory emphasizes synergism of multiple components to enhance remedy, lower toxicity and prevent side effect. Different constituents synergistically interact together and different curative effect generates. Further work should be carried out to probe the variance of pharmacodynamic action of FAI from different habitats.
The correlative coefficient is often used to describe the similarity and dissimilarity among the fingerprints quantitatively. Using the median chromatogram as common mode, the data of fingerprints of 12 batches samples were processed to analyze the similarity among those samples with the software developed by our laboratory. All the values of correlation coefficient of similarity obtained are in the range of 0.975-0.999, which indicates that their chromatographic patterns from different batches are generally consistent and the enormous sameness appears in the studied samples.
3.7 Quantitation of hesperidin and naringin
The developed method was applied to determine the contents of hesperidin and naringin in the samples. The results of quantitative analysis are summarized in Table 4. Hesperidin is found to be the main compound at a content level of about 19.35-29.71 mg/g. In revealing the concentration level of hesperidin, FAI samples from Hunan Province contain a significantly higher amount compared with the ones from Hubei and Sichuan Province. These findings are in correspondence with those in Ref.[11]. Concerning on naringin, it is detected only in the samples from Sichuan and Hubei with a relatively low content, which does not exist in Hunan��s samples. Such results about naringin are the same as those in Ref.[11], but different from those in Refs.[12] and [13]. The results forementioned may result from different herbal habitats, which help to distinguish raw herbal materials of various origins. Though hesperidin and naringin are known to be effectual compounds in citrus herbs [4-5, 7], no specifications about them are seen in Chinese pharmacopeia. It only specifies the determination method of synephrine. It is strongly suggested that the determination method and content standard of the two chemical compounds in FAI should be established for the purpose of quality control as soon as possible. Moreover, according to TCMs�� theory, different concentration proportions of mass constituents may represent different therapeutic effects, and further research may be the study of the different pharmacodynamic actions caused by FAI samples from different cultivation locations.
Table 4 Contents of majority compounds in studied FAI samples (mg/g)

4 Conclusions
1) An efficient and valid HPLC method was developed for fingerprint analysis of Fructus Aurantii Immaturus. The characteristic analytical fingerprints of this plant extract show 28 common peaks with the help of the HELP resolution method. The similarity coefficient analysis shows a sufficient correlation among the tested herbal materials.
2) By qualitative and quantitative analyses, hesperidin and naringin, the key bioactive compositions in citrus herb, are identified, and four flavonoid compounds involving two new ones are tentatively identified. The analytic results indicate that flavonoid compounds are the major substances contained in FAI, which builds the basis for the successful quality control of this medicinal plant.
3) It is demonstrated that using fingerprint technique to identify and assess herb medicine, together with the qualitative and quantitative analyses of bioactive compositions, is scientific, which may be very serviceable to the research of TCM.
References
[1] Chinese Pharmacopoeia Committee. Chinese pharmacopoeia [M]. Beijing: Publishing House of People��s Health, 2000: 200.
[2] YIN Jian. The modern study and clinical application of Chinese medicine [M]. Beijing: Publishing House of Xueyuan, 1993: 468. (in Chinese)
[3] WANG Wen-kai, GAN Xiao-lan. The study progress of immature bitter orange [J]. Hunan Guiding Journal of TCM, 2003, 9(12): 55-56. (in Chinese)
[4] CHEN Yu-ting, ZHENG Rong-liang, JIA Zhong-jian, JU Yong. Flavonoids as superoxide scavengers and antioxidants [J]. Free Radical Biology & Medicine, 1990, 9(1): 19-21.
[5] JOVANOVIC S V, STEENKEN S, TOSIC M, MARJANOVIC B, SIMIC M G. Flavonoids as antioxidants [J]. Journal of American Chemical Society, 1994, 116(11): 4846-4851.
[6] CARPENE C, GALITZKY J, FONTANA E, ATGIE C, LAFONTAN M, BERLAN M. Selective activation of beta3-adrenoceptors by octopamine: Comparative studies in mammalian fat cells [J]. Naunyn-Schmiedebergs Archives of Pharmacology, 1999, 359(4): 310-321.
[7] MORO C O, BASILE G. Obesity and medicinal plants [J]. Fitoterapia, 2000, 71(suppl 1): S73-S82.
[8] XIE Zhen-jian, JIAO Shi-rong, LI Kai, TONG Yong-xin. Determination of naringin, hesperidin and neohesperidin content in Fructus Aurantii Immaturus from different places by RP-HPLC approach [J]. Journal of Xihua University: Natural Science, 2009, 28(2): 65-67. (in Chinese)
[9] MOULY P, GAYDOU E M, AUFFRAY A. Simultaneous separation of flavanone glycosides and polymethoxylated flavones in citrus juices using liquid chromatography [J]. Journal of Chromatography A, 1998, 800(2): 171-179.
[10] DING Li, LUO Xu-biao, TANG Fei, YUAN Jin-bin, LIU Qian, YAO Shou-zhuo. Simultaneous determination of flavonoid and alkaloid compounds in citrus herbs by high-performance liquid chromatography�Cphotodiode array detection-electrospray mass spectrometry [J]. Journal of Chromatography B, 2007, 857(2): 202-209.
[11] WANG Qing, YUAN Dan. Determination of flavonoids in Fructus Aurantii Immaturus and Fructus Aurantii from different habitat by HPLC [J]. Heilongjiang Medicine Journal, 2008, 21(3): 1-3. (in Chinese)
[12] LU Y, ZHANG C, BUCHELI P, WEI D. Citrus flavonoids in fruit and traditional Chinese medicinal food ingredients in China [J]. Plant Foods for Human Nutrition, 2006, 61(2): 57-65.
[13] WANG Chen, PAN Ya-ju, FAN Guo-rong, CHAI Yi-feng, WU Yu-tian. Application of an efficient strategy based on MAE, HPLC-DAD-MS/MS and HSCCC for the rapid extraction, identification, separation and purification of flavonoids from Fructus Aurantii Immaturus [J]. Biomedical Chromatography, 2010, 24(3): 235-244.
[14] ZHANG H M, CHEN S W, QIN F, HUANG X, REN P, GU X Q. Simultaneous determination of 12 chemical constituents in the traditional Chinese Medicinal Prescription Xiao-Yao-San-Jia-Wei by HPLC coupled with photodiode array detection [J]. Journal of Pharmaceutical and Biomedical Analysis, 2008, 48(5): 1462-1466.
[15] KVALHEIM O M, LIANG Y Z. Heuristic evolving latent projections: Resolving two-way multicomponent data: 1. Selectivity, latent- projective graph, datascope, local rank, and unique resolution [J]. Analytical Chemistry, 1992, 64(8): 936-946.
[16] LIANG Y Z, KVALHEIM O M, KELLER H R, MASSART D L, KIECHLE P, ERNI F. Heuristic evolving latent projections: Resolving two-way multicomponent data: 2. Detection and resolution of minor constituents [J]. Analytical Chemistry, 1992, 64(8): 946- 953.
[17] MABRY T J, MARKHAM K R, THOMAS M B. The systematic identification of flavonoids [M]. New York: Springer, 1970.
[18] TIBERTI L A, YARIWAKE J H, NODJOKO K, HOSTETTMANN K. Identification of flavonols in leaves of Maytenus ilicifolia and M. aquifolium (Celastraceae) by LC/UV/MS analysis [J]. Journal of Chromatography B, 2007, 846(1/2): 378-384.
(Edited by YANG Bing)
Foundation item: Project(20875104) supported by the National Natural Science Foundation of China; Project(10SDF22) supported by the Special Foundation of China Postdoctoral Science; Project(201021200011) supported by the Advanced Research Plan of Central South University, China
Received date: 2010-06-29; Accepted date: 2010-12-20
Corresponding author: LIANG Yi-zeng, Professor, PhD; Tel: +86-731-88830831; Fax: +86-731-8830831; E-mail: yizeng_liang@263.net

