Numerical simulation analysis for deformation deviation and experimental verification for an antenna thin-wall parts considering riveting assembly with finite element method
��Դ�ڿ������ϴ�ѧѧ��(Ӣ�İ�)2018���1��
�������ߣ����ij� ������ ���� �߿�
����ҳ�룺60 - 77
Key words��thin-wall parts assembly; assembly deformation deviation; theoretical deformation model; finite element simulation; measuring experiment
Abstract: In the process of thin-wall parts assembly for an antenna, the parts assembly deformation deviation is occurring due to the riveting assembly. In view of the riveting assembly deformation problems, it can be analyzed through transient and static simulation. In this work, the theoretical deformation model for riveting assembly is established with round head rivet. The simulation analysis for riveting deformation is carried out with the riveting assembly piece including four rivets, which comparing with the measuring points experiment results of riveting test piece through dealing with the experimental data using the point coordinate transform method and the space line fitting method. Simultaneously, the deformation deviation of the overall thin-wall parts assembly structure is analyzed through finite element simulation; and its results are verified by the measuring experiment for riveting assembly with the deformation deviation of some key points on the thin-wall parts. Through the comparison analysis, it is shown that the simulation results agree well with the experimental results, which proves the correctness and effectiveness of the theoretical analysis, simulation results and the given experiment data processing method. Through the study on the riveting assembly for thin-wall parts, it will provide a theoretical foundation for improving thin-wall parts assembly quality of large antenna in future.
Cite this article as: PAN Ming-hui, TANG Wen-cheng, XING Yan, NI Jun. Numerical simulation analysis for deformation deviation and experimental verification for an antenna thin-wall parts considering riveting assembly with finite element method [J]. Journal of Central South University, 2018, 25(1): 60�C77. DOI: https://doi.org/10.1007/ s11771-018-3717-8.

J. Cent. South Univ. (2018) 25: 60-77
DOI: https://doi.org/10.1007/s11771-018-3717-8

PAN Ming-hui(������), TANG Wen-cheng(���ij�), XING Yan(����), NI Jun(�߿�)
School of Mechanical Engineering, Southeast University, Nanjing 211189, China
 Central South University Press and Springer-Verlag GmbH Germany,part of Springer Nature 2018
Abstract: In the process of thin-wall parts assembly for an antenna, the parts assembly deformation deviation is occurring due to the riveting assembly. In view of the riveting assembly deformation problems, it can be analyzed through transient and static simulation. In this work, the theoretical deformation model for riveting assembly is established with round head rivet. The simulation analysis for riveting deformation is carried out with the riveting assembly piece including four rivets, which comparing with the measuring points experiment results of riveting test piece through dealing with the experimental data using the point coordinate transform method and the space line fitting method. Simultaneously, the deformation deviation of the overall thin-wall parts assembly structure is analyzed through finite element simulation; and its results are verified by the measuring experiment for riveting assembly with the deformation deviation of some key points on the thin-wall parts. Through the comparison analysis, it is shown that the simulation results agree well with the experimental results, which proves the correctness and effectiveness of the theoretical analysis, simulation results and the given experiment data processing method. Through the study on the riveting assembly for thin-wall parts, it will provide a theoretical foundation for improving thin-wall parts assembly quality of large antenna in future.
Key words: thin-wall parts assembly; assembly deformation deviation; theoretical deformation model; finite element simulation; measuring experiment
Cite this article as: PAN Ming-hui, TANG Wen-cheng, XING Yan, NI Jun. Numerical simulation analysis for deformation deviation and experimental verification for an antenna thin-wall parts considering riveting assembly with finite element method [J]. Journal of Central South University, 2018, 25(1): 60�C77. DOI: https://doi.org/10.1007/ s11771-018-3717-8.
1 Introduction
The thin-wall parts assembly has been widely applied to various radar antennas, aerospace and aircraft, automobile fields, etc [1�C3]. The level of assembly dimensional variation for thin-wall parts is an imperative influence factor for product functionality and overall performance [4�C6]. In thin-wall parts assembly process, the different deviation variation and parts deformation will occur through some methods such as riveting assembly, welding assembly and bolted joint. How to study and analyze the parts deformation deviation for thin-wall parts assembly is essential to ensure the assembly quality, especially the large antenna assembly.
The thin-wall parts assembly in manufacturing field, including aeronautical thin-wall structures assembly, aircraft panel assembly and so on, has been studied and analyzed by most scholars and researchers. For example, BLANCHOT et al [7] proposed a numerical simulation model for a riveted link, and the effect of riveted link behavior on the overall riveting assembly under the external load was analyzed which was aimed to reduce the model size and calculation time. PORCARO et al [8] analyzed the self-piercing riveting process through simulating its process with finite element and the force applied on the rivet was recorded by a novel experimental device to validate the simulation results for self-piercing riveting. BEDAIR et al [9] proposed a numerical modeling procedure to analyze the riveted lap joints considering some factors such as the interaction between plates and rivet, and the secondary out of plane bending, what is more, the load transfer mechanism was also accurately simulated and analyzed. DAHLSTROM et al [10] established a relationship between the part deviation and sheet metal assembly spring-back deviation through the method of influence coefficient, and proposed a contact modeling method combining the method of influence coefficient which improved the sheet metal assembly quality. BOUCHARD et al [11] studied the numerical modeling of self-piercing riveting and rivet/sheet assembly mechanical strength, and the large deformation of elastic-plastic materials for 2D and 3D configurations was simulated with finite element. LI et al [12] proposed dynamic modeling and simulation of percussive riveting process, and developed a simulation program method to predict the plastic deformation of rivet and contact forces in the riveting process. CHENG et al [13, 14] proposed a method to analyze positioning error in the multi-state riveting process for aeronautical thin-wall structures, and the assembly variation was analyzed through combining with finite element method and Monte Carlo simulation method. MUCHA [15] studied the quality parameters and behavior of self-piercing riveted sheet metal using different joint conditions through finite element method. For the different size of rivets in riveting process, CHEN et al [16] analyzed and optimized the riveting process through finite element simulation and experiment validation. WANG [17] employed riveting sequence to solve the problem of rivets coupling influence of bulging and aircraft structures deformation, and presented a riveting equivalent unit to analyze the riveting sequence deviation. LIU et al [18] proposed a method of influence coefficient based on key feature deviation to analyze and predict the variation for aircraft fuselage panel riveting assembly caused by riveting deformation. MORI et al [19] examined the mechanism of self-pierce riveting of multiple aluminum alloy and steel sheets and the deformation behavior in the self-piece riveting process and the simulation and experiment are applied to assess and verify the riveting joint conditions. HAN et al [20] analyzed the assembly variation for auto-body sheet metal in self-pierce riveting and established a model on the effect of parts variation, riveting tool variation, and fixture tool on the assembly quality by influence coefficient method and finite element method. ABDELAL et al [21] studied the fastening process of aircraft panel assembly with single and multiple rivets by explicit finite element method and investigated the panel��s dimensional growth to minimize the panel��s deformation. The above literatures mainly focus on the research of the sheet metal assembly for different materials or numerical modeling simulation in self-pierce riveting process, riveting process simulation; however, the fewer researchers pay attention to the influence of different number of rivets on the thin-wall parts assembly deformation deviation, different riveting direction, overall structure deformation analysis of different riveting assembly zone, experiment data processing method and so on.
Therefore, in this work, in order to better analyze the deformation deviation of the antenna thin-wall parts assembly, the theoretical deformation model for riveting assembly is established when using round head rivet. The riveting assembly deformation for thin-wall parts is analyzed through transient and static simulation. The simulation analysis for riveting deformation is also carried out with the riveting assembly piece, comparing with the results of the measuring points experiment of riveting test piece through dealing with the experimental data using the point coordinate transform method and the space line fitting. Based on the effect of the riveting assembly with four rivets on the deformation of riveting test piece, the deformation of the thin-wall parts assembly structure is analyzed through finite element simulation, which is verified by the measuring experiment for riveting assembly of thin-wall parts with the deformation deviation of some key points. What is more, the measuring experimental data for riveting assembly of thin-wall parts are processed with the virtual least-squares plane method to calculate the riveting assembly deformation deviation.
2 Structure model for an antenna thin- wall parts assembly
There are a large amount of parts in antenna thin-wall parts assembly process, and assembly relation between those parts is very complex. The tooling layout, the positioning way of locating elements, the clamping way of clamping elements, the position relationships of the thin-wall parts are essential to consider, and it is at the same time needed to constantly adjust the position of every components to meet the requirement of the assembly accuracy. Due to the thin�Cwall parts riveting assembly and others components assembly and assembly deviation and others errors are generated, the positioning and clamping of thin-wall parts and others components are very essential to improve the assembly accuracy as far as possible. The assembly structure model for an antenna thin-wall parts and local structure model are shown in Figure 1.
According to the antenna assembly structure as shown in Figure 1, based on the needs of experimental validation later, through narrowing the proportion of antenna assembly structure model, the experimental structure model for thin-wall parts which is similar to the local structure for the antenna assembly model is used in this work, including two locating elements (6, 7), five thin-wall parts (the three narrow plates 1, 2, 3 and two wide plates 4, 5), six corner pieces and 48 rivets and other components. The structure model is shown in Figure 2.
According to the assembly relation of every part in Figure 2, each part is located and clamped, and their relationships are following: the locating element and wide plate are connected by the pins; the locating element and assembly platform are fixed by the bolt connection. When clamping components, the clamping position is mainly the corner piece position between the narrow plate and narrow plate, the contact position of the thin-wall part and locating element, which is clamped with C shape clamp. At the same time, the experimental structure model for thin-wall parts assembly is divided into six riveting zones in the process of riveting assembly, and the riveting assembly sequence is �١��ڡ��ۡ� �ܡ��ݡ��� in Figure 2, which will provide a method for following measuring experiment for riveting assembly of thin-wall parts.
3 Theoretical analysis and transient simulation of riveting assembly deformation for thin-wall parts
In antenna thin-wall parts assembly process, there are a lot of reasons leading to the whole antenna thin-wall parts deformation deviation. In this work, considering the riveting assembly deformation and thin-wall parts deformation under the relevant constraints, through the establishment of riveting deformation theory model and the transient simulation of riveting assembly for thin-wall parts, those deformation and stress results are obtained and analyzed.
Figure 1 Assembly structure model for an antenna thin-wall parts and local structure model
Figure 2 Experimental structure model for thin-wall parts assembly
3.1 Establishment of rivet deformation theoretical model
In thin-wall parts riveting assembly process, not only the deformation of thin-wall parts itself will occur, the rivet deformation and stress will be also generated. This work mainly discusses and establishes the rivet deformation theoretical model to calculate the three stages�� deformation conditions for rivet including elastic deformation, plastic deformation, and the spring-back deformation and some stress conditions. Meanwhile, in the process of riveting assembly with multiple rivets which are arranged side by side, then it is assumed in this work as follows.
1) Each rivet assembly is independent each other, and has no influence each other;
2) Each rivet assembly deformation is uniform;
3) The total rivet deformation in each direction can be in linear superposition.
Therefore, the deformation of thin-wall parts is analyzed later based on the above hypotheses; in the process of riveting assembly, the effect of riveting deformation on the thin-wall parts deformation is taken into account.
In this work, according to Ref. [22], the rivet deformation processes are divided into the elastic deformation stage, plastic deformation stage and the spring-back stage. Finally combining with the riveting assembly size for experimental structure model, the total deformation of rivet is analyzed. The round head rivet is adopted with the material of aluminum alloy 5B05, in the riveting assembly process. The local dimension parameters are shown in Table 1, and the riveting assembly connection diagram is shown in Figure 3.
Table 1 Local parameters for riveting assembly
Figure 3 Riveting assembly connection diagram
In the elastic deformation stage for rivet, the punch begins to contact rivet and continues to move. In this process, the rivet elastic deformation will be generated. With the increasing of punch displacement, the riveting force will also increase. In elastic deformation stage, the stress and strain of the z direction for rivet are expressed as follows [22]:
 (1)
(1)
where ��ez and ��ez are the stress and strain of the z direction for rivet, respectively; Fe is the riveting force in elastic deformation stage; A is the cross- sectional area for rivet; E is elasticity modulus; l�� represents the length after rivet deformation; l is the length of rivet shank; ��le is the elastic deformation.
According to the formula (1), the elastic deformation is as follows:
 (2)
(2)
In this work, the rivet material is aluminum alloy which is isotropic material, so, the deformation is the same along the x and y directions.
The strain of the x direction for rivet is expressed as follows:
 (3)
(3)
where ��ex represents the strain of the x direction for rivet; �� is Poisson ratio; d��1 represents the diameter after rivet deformation; d1 is the diameter of rivet shank.
According to the formula (3), the deformation along the x, y direction, ��d1, is as follows:
 (4)
(4)
When the rivet deformation is generated, rivet will squeeze rivet hole for thin-wall parts, then the rivet hole will get bigger, the increment for rivet hole is as follows:
 (5)
(5)
In the plastic deformation stage for rivet, it reaches yield strength for rivet and the plastic deformation is occurring for the zone between the punch and thin-wall part ��. After reaching a location, the punch will stop moving and plastic deformation will stop. Under the riveting force Fp, rivet will also squeeze rivet hole for thin-wall parts. When the force between rivet and thin-wall parts reaches the equilibrium state, the rivet diameter is d1+��d1 at this time. Then, the stress of the zone 1 is expressed by the formula:
 (6)
(6)
For the stress of z direction in the zone 2, ��pz2=��0.2, where ��0.2 represents the yield strength for rivet. The zones 1 and 2 are shown in Figure 4. Ignoring the variation from the contact to stop between the punch and rivet, the plastic deformation is as follows:
 (7)
(7)
In riveting assembly process, the rivet will become shorter and there is riveting upsetting. The rivet upsetting diagram for riveting assembly is shown in Figure 4. In spring-back stage for rivet, the spring-back force is zero. Due to the residual stress in the rivet, the rivet will have spring-back to an extent. In the zones 1 and 2, their stress relationship is following, ��sz1=��pz1, ��sz2=��pz2. According to Formula (6) and stress relationship, the equations are obtained as follows:
 (8)
(8)
where E�� represents the equivalent elastic modulus, namely,  According to the above formula, the spring-back for the zone 1 and the plastic spring-back for the zone 2 are following, respectively:
 (9)
(9)
According to the above equations, the total spring-back for rivet is gotten by following equation:

 (10)
(10)
According to the analysis of the theoretical deformation equation, assume that in the process of riveting assembly, the riveting force of plastic stage and elastic stage is the same. In this work, under the condition of 5, 10 and 15 kN, according to the above equations and the relative dimensional parameters in Table 1, the calculation results of stress and deformation are shown in Table 2, which provides a comparative basis for the following rivet deformation simulation results.
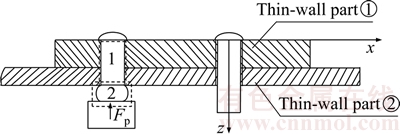
Figure 4 Rivet upsetting diagram for riveting assembly
Table 2 Calculation results under riveting force loads
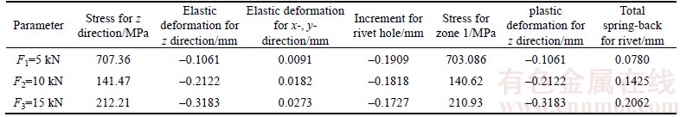
According to Table 2, the calculation results show that the absolute values of the elastic and plastic deformation for z direction increase with the increasing of riveting force loads to an extent; the elastic deformation for x/y direction and the total spring-back for rivet are also so. Whereas, the stress for z direction and increment for rivet hole are decreased and so is the stress for zone 1. Through the illustrating of above results, in riveting assembly process, the rivet deformation and stress cannot be too big or too small, therefore, it is essential to choose the magnitude of riveting force loads, the punch speed and displacement for the riveting assembly of the thin-wall parts.
3.2 Transient simulation analysis of riveting assembly deformation
In riveting assembly process, there are different deformation and stress under the same load at different time. In this work, the transient behaviors for thin-wall part assembly are studied and analyzed by comparing with theoretical model analysis. When the transient simulation of rivet deformation with finite element is carried out, the boundary conditions are following: The fixed support is applied on the two end side surfaces for the thin-wall parts �� and ��, respectively, and the surface of one rivet head; The applied load on the one of the punch surface is taken as an example, the applied loads are set according to the corresponding time, and the time scope is 1�C5 ms. Its settings are shown in Table 3 and the material performance parameters for riveting assembly parts are shown in Table 4. According to the above conditions and parameters, the transient simulation results of riveting deformation are obtained, and the von- Misses stress nephogram at 1 ms is given as an example as shown in Figure 5; in the time scope of 5 ms, the rivet deformation curve with changing over time is shown in Figure 6.
In Figures 5(a)�C(e), when the loads of 5, 10, 15, 20 and 0 kN are applied on the punch, the generated transient total deformation for riveting assembly under different time is different; their total deformation is around 0.0572, 0.11247, 0.16657, 0.2203, 0.00419 mm, respectively, in 1, 2, 3, 4 and 5 ms. It can be seen from the Figures 5(a)�C(e), the total deformation conditions are not only clearly illustrated, but also it is clearly shown that the riveting assembly has effect on the deformation distribution of thin-wall parts, which will provide a research foundation for studying dynamic process for riveting assembly in future. Simultaneously, the load of 5 kN applied on the punch is taken as an example. In Figure 5(f), in 1 ms, the von-Misses stress distribution can be clearly seen, including the effect of the load on the rivet and thin-wall parts stress; the von-Misses stress values for rivet and thin-wall parts are about, respectively, 750 MPa and 415 MPa. The simulation result of rivet stress agrees well with the theoretical calculation result under the load of 5 kN in Table 2. What is more, according to the elastic deformation for x/y/z direction in Table 2 when the load is 5 kN, the calculated total elastic deformation value is about 0.10689 mm, due to the existing of spring-back. In this work, the calculated total deformation is 0.02889 mm. According to Figure 5(a), the total deformation is about 0.0572 mm, but the average deformation value is about 0.3 mm, which is very close to the above the calculated total deformation. The plastic deformation for z direction in Table 2 is taken as the z direction deformation in this work, which is compared with the z direction deformation curve in Figure 6(c) at 1 ms. In Figure 6, the rivet deformation rules with changing over time are given through finite element simulation, including the maximum deformation and minimum deformation changing over time. The total deformation trend for the maximum deformation value is increasing by over time to an extent, and then is decreasing by over time; but the minimum deformation trend is quite gentle for x/y/z direction, the occurring of largest deformation is at the fourth millisecond, in accordance with the largest load at this moment. In order to compare with the z direction deformation for theoretical calculation value, it can be seen from Figure 6(c) that its deformation value is about 0.057 mm at 1 ms, which has a certain difference from the plastic deformation for z direction in Table 2, but this difference is not too large, and it may be the reason that the simulation condition has a certain difference from the actual boundary conditions. According to the above explanation and comparing with transient simulation analysis, it is proved that the established theoretical model is corrected and valid.
Table 3 Settings table of time and load
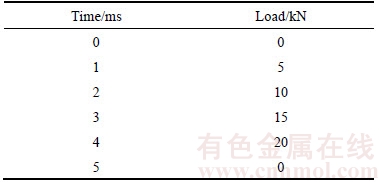
Table 4 Material performance parameters for riveting assembly parts
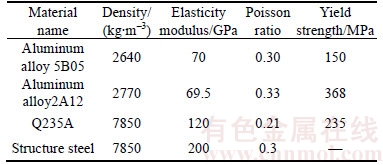
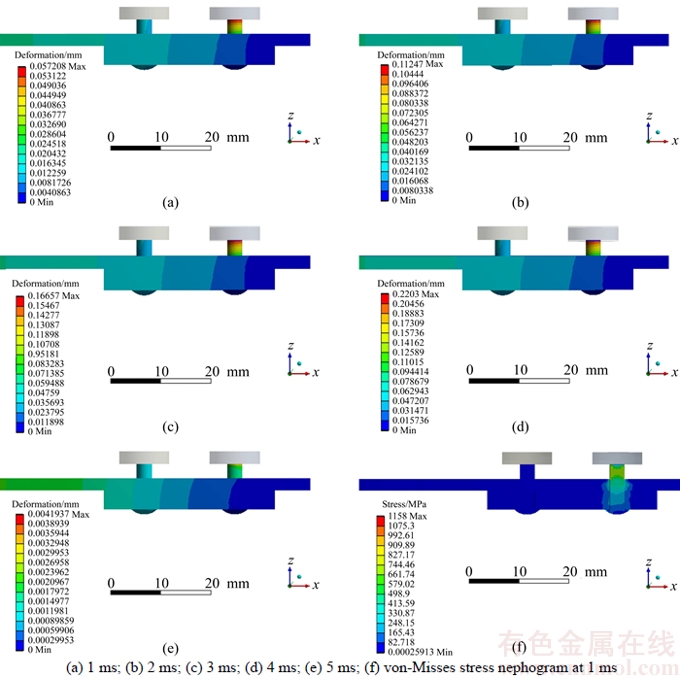
Figure 5 Transient total deformation nephogram for riveting assembly under different time and stress nephogram:

Figure 6 Rivet deformation curve with changing over time:
4 Static simulation and experiment analysis of riveting assembly deformation
In order to better understand the riveting assembly deformation, the local zone for riveting assembly structure is taken as a research object to see the riveting deformation conditions and experiment verification is carried out. When the static simulation calculation of rivet deformation with finite element is carried out, according to the local parameters for riveting assembly in Table 1, the boundary conditions are following: 1) The fixed support is applied on the two end side surfaces for the thin-wall parts �� and ��, respectively, and the surface of the four rivet heads; 2) The scope of punch displacement is 0�C3 mm. According to the material performance parameters for riveting assembly parts in Table 4, the static simulation calculation results of riveting deformation are obtained, including the total deformation nephogram and the deformation nephogram for x/y/z direction. The riveting deformation nephogram for riveting assembly with one rivet is shown in Figure 7; the riveting deformation nephogram for riveting assembly with four rivets is shown in Figure 8.
In Figure 7, it can be seen from the riveting deformation nephogram for riveting assembly with one rivet that the deformation of thin-wall parts and the rivet is occurring whether it is the total deformation or the directional deformation. In Figure 7(a), the maximum total deformation for the thin-wall parts and rivet are about 0.8584 mm and 3.0044 mm, respectively. In Figures 7(b)�C(d), the maximum x axis deformations for the thin-wall parts and rivet are about 0.10068 mm and 0.17756 mm, respectively; The maximum y axis deformations for the thin-wall parts and rivet are about 0.021242 mm and 0.21384 mm, respectively; The absolute value of the maximum z axis deformations for the thin-wall parts and rivet are about 0.1958 mm and 2.9998 mm, respectively. However, in Figure 8, it can be seen from the riveting deformation nephogram for riveting assembly with four rivets that the deformation zone of thin-wall parts is much larger than that of the thin-wall parts for riveting assembly with one rivet in Figure 7 whether it is on the total deformation nephogram or the directional deformation nephogram. In Figure 8(a), the maximum total deformations for the thin-wall parts and rivet are about 1.2891 mm and 3.008 mm, respectively. In Figures 8(b)�C(d), the maximum x axis deformations for the thin-wall parts and rivet are about 0.28572 mm and 0.39882 mm, respectively; the maximum y axis deformations for the thin-wall parts and rivet are about 0.24012 mm and 0.33595 mm, respectively; the absolute value of the maximum z axis deformations for the thin-wall parts and rivet are about 0.27494 mm and 3.0016 mm, respectively. According to above the deformation data and the static deformation nephogram in Figures 7 and 8, on the basis of the effect of the riveting assembly with one rivet on the deformation of the whole thin-wall parts structure, it can be seen that the deformations of thin-wall parts for riveting assembly with four rivets are obviously larger than the deformations of thin-wall parts for riveting assembly with one rivet. Therefore, in future the various influence factors including the number of rivet, the distance between the rivets, riveting assembly sequence, and different rivet materials and so on, may be very essential to be taken into consideration, which reduces the assembly deformation deviation of thin-wall parts for a larger antenna through optimizing some imperative influence factors as much as possible.
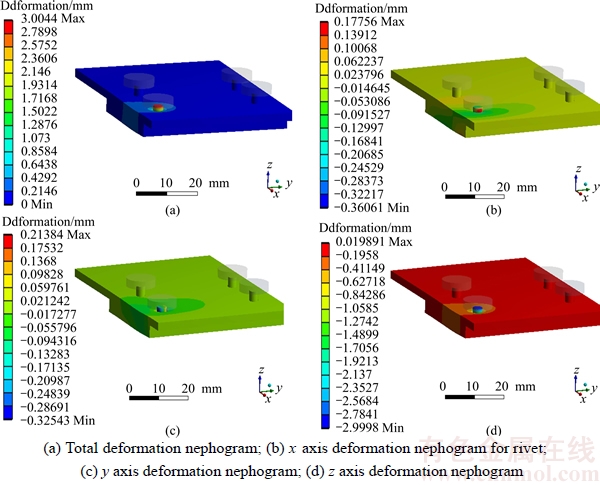
Figure 7 Riveting deformation nephogram for riveting assembly with one rivet:
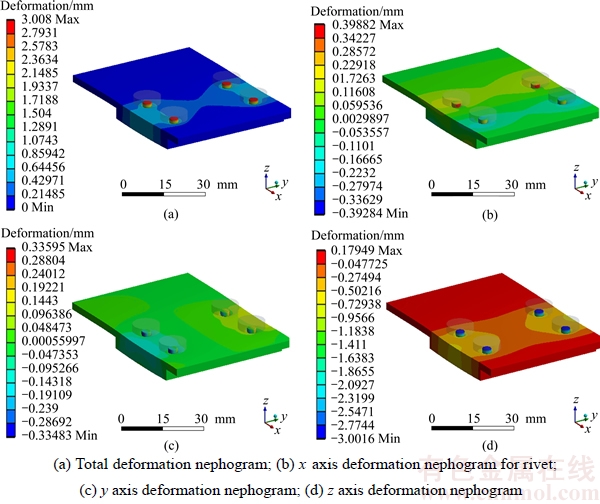
Figure 8 Riveting deformation nephogram for riveting assembly with four rivets:
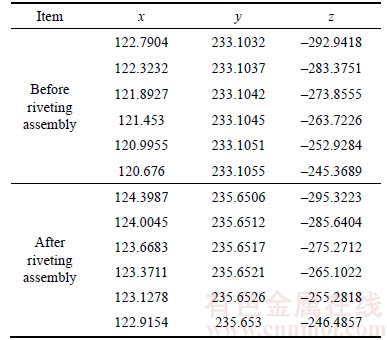
In the measuring points experiment, the riveting test piece consists of two thin-wall parts and four rivets, which are corresponding with the riveting simulation analysis. The measuring point��s distribution and measurement experiment diagram for riveting test piece are shown in Figure 9. There are six points on the riveting test piece and their coordinates are measured with the coordinate measuring machine (CMM) before and after riveting assembly. Before and after riveting assembly, the measuring point coordinates are shown in Table 5.
Before and after the riveting assembly, the measured coordinates inevitably introduce the posture errors of the coordinate measuring machine. In order to reduce and eliminate errors as much as possible, it should make coordinate transformation for the experimental data. Due to machining errors of the riveting test piece and the deformation being very small, whether it is a machining error or riveting deformation, the measuring point distribution is very close to the ideal straight line. Therefore, according to coordinates of measuring points, the least square solution of linear equations will be determined, and then based on the least squares solution, the coordinate transformation is carried out which reduces posture error to get a riveting deformation deviation accurately,which is eventually compared with the simulation result after the riveting assembly.
The standard equation for space straight line can be expressed as follows:
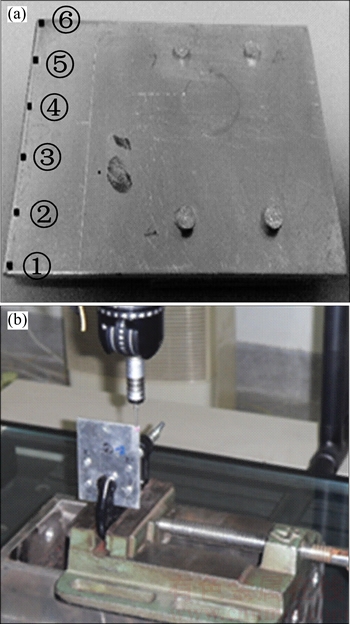
Figure 9 Measuring point��s distribution (a) and measurement experiment diagram (b) for riveting test piece
Table 5 Coordinates for measuring points before and after riveting assembly
 (11)
(11)
Formula (11) is transformed to the following form:
 (12)
(12)
where 

 ,
, So,
So,
the straight line can be taken as the intersection line of two planes; the two equations can be fitted with the measuring points coordinate data, respectively.
It is assumed that X=(x1, x2, ��, xn)T, Y=(y1, y2, ��, yn)T, M=(a, b)T, N=(c, d)T, P=  the Eq. (12) can be expressed by matrix form as follows:
 (13)
(13)
Formula (13) can be transformed to the following form:
 (14)
(14)
The parameters a, b, c and d can be solved by the formula (14).
It is shown in Figure 10 that, after rotating angle �� for a point H(x, y), it becomes the new point H��(x��, y��), according to the geometric transformation relationships in Figure 8, and the relationships are obtained as follows:
 (15)
(15)
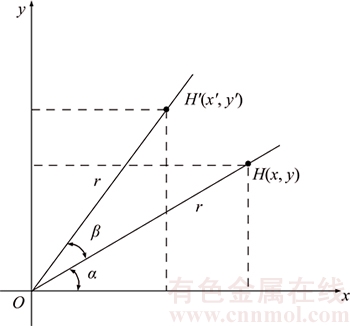
Figure 10 Geometric transformation relationship diagram for point��s coordinate
where x=rcos �� and y=rsin ��.
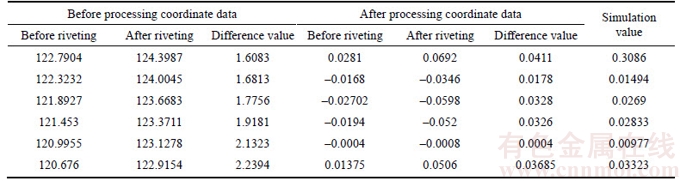
The experimental data are processed through following steps: Firstly, the coordinate data are fitted to the spatial linear with the least square method to get the space linear equation. According to the coordinate value for measuring points in Table 5, before and after riveting assembly, the fitting lines for the measuring point��s coordinate are shown in Figure 11. Secondly, two points�� coordinates for the fitting line are determined, the fitting line and the ideal line make a superposition through the translation and rotation for the line to obtain the translation vector H and rotation angle ��. Finally, according to the obtained translation vector and rotation angle, the experimental data are processed to get the new coordinates before and after riveting assembly. The new coordinate difference value can be obtained as the deformation value. In this work, the x direction measuring coordinate data are taken as an example. The comparative table for the x direction measuring coordinate data before and after processing the coordinate data is shown in Table 6.
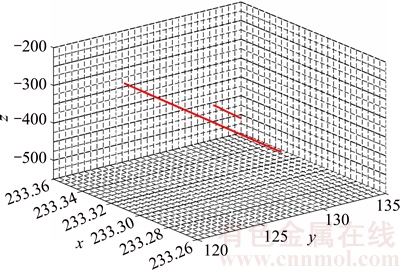
Figure 11 Fitting line for measuring point��s coordinate before and after riveting assembly
In Table 6, according to the above data processing method, after processing the coordinate data, the deformation difference value after riveting assembly basically conforms to the deformation simulation value for x direction, and the deformation deviation for the actual riveting assembly can been seen and the errors are small, which proves the correctness and validity of experiment data processing method. And then it is also shown that the deformation deviation simulation results of local zone structure for riveting assembly structure agree well with the experiment results of riveting test piece.
Table 6 Comparative table for x direction measuring coordinate data (Unit: mm)
5 Deformation simulation analysis for overall thin-wall parts assembly structure
After analyzing the deformation conditions of local zone structure for riveting assembly structure, the whole riveting assembly structures of thin-wall parts before and after the riveting assembly are analyzed in this work. When the overall deformation is analyzed through the finite element simulation, its boundary conditions and constraints are respectively following: the bottom for locating element is as the fixed supporting surface; the contact between the pin and locating element is defined as a bonded contact, others contact is default for the bonded contact and the punch side displacement load is 3 mm; the two end faces for thin-wall part and locating element, two end faces of thin-wall part and corner part are respectively applied clamping force of 300 N in the opposite direction; the clamping region is a circular area with a radius of 6 mm, as shown in Figure 12; what is more, on the finite element model for thin-wall parts assembly structure, for the thin-wall parts 1, 2, 3, 4 and 5 (the thin-wall part number is the same with the Figure 2), the selected key feature point numbers are respectively 12, 11, 12, 10 and 10 and their deformation deviations are respectively inspected and analyzed through the finite element simulation. According to the above conditions, the thin-wall parts assembly structure deformation nephogram before riveting assembly is shown in Figure 13.
In Figures 13(a) and (b), the maximum total deformation for thin-wall parts assembly structure before riveting assembly is about 3.52��10�C3 mm and the maximum deformation for x direction is about 2.45��10�C3 mm. Before riveting assembly,because the boundary conditions and constraints are only fixed supporting surface and the equal clamping force for opposite direction, the generated deformation deviation value is extremely small. For the thin-wall parts assembly structure deformation analysis before riveting assembly, it is mainly aimed to compare with deformation conditions after riveting assembly, which illustrates the influence of riveting assembly and rivet upsetting on the thin-wall parts assembly structure. The thin-wall parts assembly structure deformation nephogram after riveting assembly is shown in Figure 14.
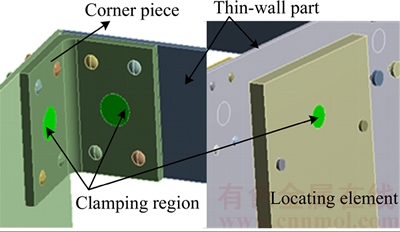
Figure 12 Clamping region for clamping force
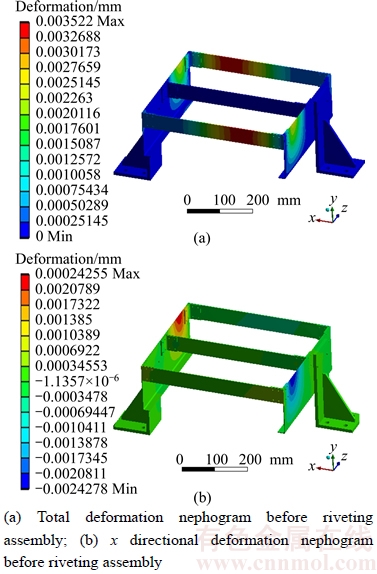
Figure 13 Thin-wall parts assembly structure deformation nephogram before riveting assembly:
From Figure 14, the thin-wall parts assembly structure deformation deviation after riveting assembly is obviously larger than the one before riveting assembly, no matter what it is local and global deformation nephogram distribution or a certain direction deformation. On the thin-wall parts assembly structure, according to the previous illustration, there are six riveting regions including 48 rivets; when riveting assembly or rivet upsetting, the whole thin-wall parts assembly structure, including every rivet, are greatly affected, and every rivet upsetting has also influence on thin-wall parts deformation deviation. Those deformation distribution and influence can be seen from the total deformation nephogram in Figure 14(a), and x/y/z directional deformation nephogram in Figures 14(b)�C(d), respectively.
Meanwhile, in order to better analyze the deformation deviation conditions for every thin- wall part, according to the previous serial number for thin-wall parts, on the thin-wall parts 1, 2, 3, 4 and 5, the key points are selected, and the numbers of key feature points are respectively 12, 11, 12, 10 and 10. These key points deformation deviation conditions on the thin-wall parts after riveting assembly are shown in Figure 15, and the simulation results will be validated and analyzed through later measuring experiment for riveting assembly of thin-wall parts. In Figure 15(a), the total deformation deviation is increasing or decreasing to a certain zone on the thin-wall parts; in Figures 15(b) and (c), the key points deformation deviations on the thin-wall parts 1,2 and 3 are gently changing; however, the changing extents of the key points deformation deviation on the thin-wall parts 4 and 5 are relatively large. In Figure 15(d), the changing extents of the z direction deformation deviation for key points on the thin-wall parts 1, 2 and 3 are larger than the thin- wall parts 4 and 5. The changing reasons of deforamtion deviation may be the difference of riveting direction for a ceratin riveting region, the constraints number of thin-wall parts and so on. According to the above deformation changing conditions, and the deformation deviation curve for the key points on the thin-wall parts after riveting assembly in Figure 15, these conditions will be compared with the measuring experiment conditions for riveting assembly of thin-wall parts.
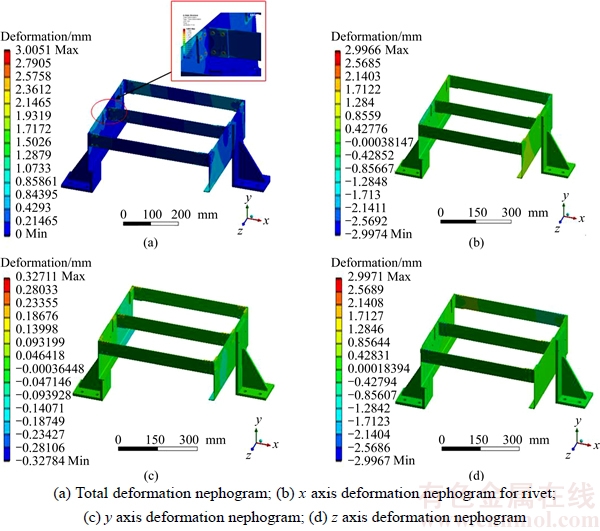
Figure 14 Thin-wall parts assembly structure deformation nephogram after riveting assembly:
6 Measuring experiment for overall riveting assembly structure of thin- wall parts
In order to measure the key points�� coordinate on the experimental structure parts before and after riveting assembly, in this work, the three-coordinate measuring machine (CMM) is used to measure coordinates for the key points and the feature points. The experimental structure model is used in this work, mainly including positioning support parts, thin-wall parts, corner pieces and others components. Its overall outline size is 465 mm�� 400 mm��400 mm. Before riveting assembly for thin-wall parts, corner pieces and locating parts are clamping with C clamp, and the rivets are fixed in advance; the locating parts play a role in fixing and supporting and the position relationship has already been described. After the riveting assembly, the C clamps are taken one by one to complete riveting assembly for thin-wall parts. The key points�� coordinates on the experimental structure before and after assembly are shown in Figure 16.
Meanwhile, the measurement results for the key points on the thin-wall parts are shown in Figures 17 and 18, namely, the three-dimensional coordinate diagram before and after riveting assembly.
As the key points deviate from the ideal position before and after the riveting assembly, in order to accurately obtain riveting assembly deformation deviation, the key characteristic point coordinate before riveting assembly is selected to synthesize virtual least-squares plane as a reference plane. The riveting assembly deformation deviation is calculated by the given formula. Its calculating method is following. It is assumed that the coordinate of measuring point is Kpj=(xi, yi, zi), i, j=1, 2, ��, n for the thin-wall parts of the different regions. Generally, the least square fitting plane expression is following:
 (16)
(16)
where a��, b�� and c�� are the undetermined coefficients. According to the solving principle of the least square method, the coefficients a��, b�� and c�� are solved by MATLAB software.

Figure 15 Deformation deviation curve for key points on thin-wall parts after riveting assembly:
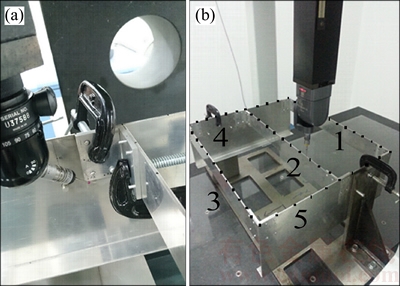
Figure 16 Key points�� measurement experimental diagram before (a) and after (b) riveting assembly
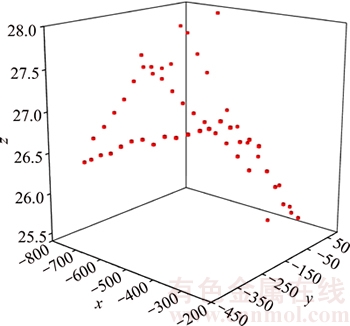
Figure 17 Three-dimensional coordinate diagram before riveting assembly
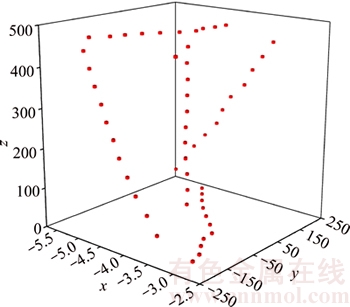
Figure 18 Three-dimensional coordinate diagram after riveting assembly
According to the least square fitting plane equation, the distance ��i (i=1, 2, ��, n) from each measuring point to the least square fitting plane is calculated by the following formula:
 (17)
(17)
According to the above formula, based on the thin-wall parts of the different regions, the riveting assembly deformation deviation for different thin-wall parts is calculated by following expression:
 , i, j, k=1, 2, ��, n (18)
where Dk represents the deformation deviation value; num_point denotes the number of measuring point for every thin-wall part.
According to the measured each key point coordinate with CMM, through the above method, the riveting assembly deformation deviation for three thin-wall parts and two wide thin-wall parts namely thin-wall parts 1, 2, 3, 4 and 5, are obtained. The deformation deviation curve for the key points after processing experiment data is shown in Figure 19.
According to the above simulation analysis results and experiment data processing results, the comparison curve of the simulation value and experiment value for the key points on the thin-wall parts after riveting assembly is obtained, and the experiment data processing result denotes corresponding experiment value as shown in Figure 20.
In Figure 20, in view of the simulation value and experiment value for thin-wall parts 1 and 3,the deformation deviation for some key points on the thin-wall part 1 or 3 is very close, the deformation deviation for others key points has larger difference. But their average values of deformation deviations for key points on the thin-wall part 1 or 3 are very close, and their relative errors are around 15%. What is more, the deformation deviation curves of simulation value for thin-wall parts 2, 4 and 5 are in close proximity to the experiment value deformation curve for thin- wall parts 2, 4 and 5, respectively. It can be seen from the above comparison analysis and the comparison curve of the simulation value and experiment value in Figure 20, the finite element simulation of riveting assembly structure for thin- wall parts, the experiment data processing with the virtual least-squares plane method and the given calculation formula for riveting assembly deformation deviation for different thin-wall parts are proved to be correct and valid, which provides a research foundation and a calculation method of experiment data for an antenna thin-wall parts assembly in future.
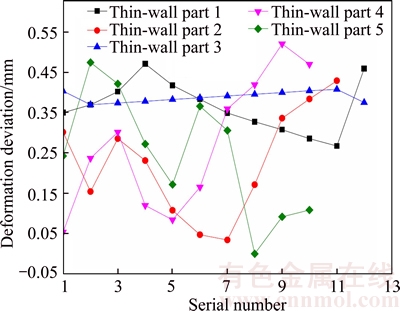
Figure 19 Deformation deviation curve for key points after processing experiment data
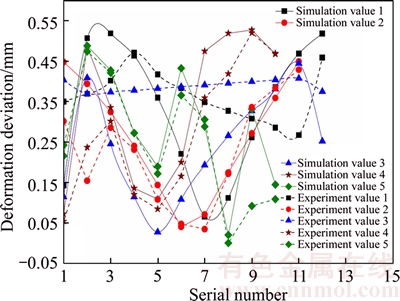
Figure 20 Comparison curve of simulation value and experiment value for key points on thin-wall parts after riveting assembly (1, 2, 3, 4 and 5 represent respectively the serial number of every thin-wall part. For example, the simlation value 1 represents the deformation deviation simulation value for the key points on the thin-wall part 1 after riveting assmbly; the experiment value 1 represents the deformation deviation experiment value after processing for the key points on the thin-wall part 1 after riveting assmbly)
7 Conclusions
1) In the thin-wall parts assembly process, the parts assembly deformation deviation is occurring due to the riveting assembly. In this work, the rivet deformation theoretical model is established when riveting assembly with round head rivet, and it is proved that it is of correctness and validity through the transient simulation analysis under different time and different loads.
2) The local zone structure and the overall structure for riveting assembly structure are taken as research objects to view the riveting deformation conditions, and experiment verification is also respectively carried out. The static simulation analysis for riveting deformation is also carried out with the riveting assembly piece, and compared with the results of the measuring points experiment of riveting test piece through processing the experimental data with the point coordinate transform method and the space line fitting. It is shown that the simulation results agree well with the experimental results, which proves the correctness and effectiveness of finite element simulation results and experiment data processing methods.
3) Based on the effect of the riveting assembly with four rivets on the deformation of riveting test piece, the deformation of the thin-wall assembly structure is analyzed through finite element simulation. The simulation analysis results are verified by the measuring experiment for riveting assembly of thin-wall parts with the deformation deviation of some key points.
4) According to the above analysis, a future study will further generalize influence factors for thin-wall parts assembly and consideration should be taken into other influence factors such as the riveting sequence for overall thin-wall assembly structure, the clamping force, fixture deformation and so on. The synthetic analytical model of deformation deviation for thin-wall parts assembly will be ulteriorly established synthesizing several factors, not only including riveting assembly, but also welding assembly deformation factors for thin- wall parts.
References
[1] CHERAGHI S H. Effect of variations in the riveting process on the quality of riveted joints [J]. International Journal of Advanced Manufacturing Technology, 2008, 39(11): 1144�C1155.
[2] AMAN F, CHERAGHI S H, KRISHNAN K K, LANKARANI H. Study of the impact of riveting sequence, rivet pitch, and gap between sheets on the quality of riveted lap joints using finite element method [J]. International Journal of Advanced Manufacturing Technology, 2013, 67(67): 545�C562.
[3] LINDAU B, WARMEFJORD K, LINDKVIST L, SODERBERG R. Method for handling model growth in nonrigid variation simulation of sheet metal assemblies [J]. Journal of Computing & Information Science in Engineering, 2014, 14(3): 031004.
[4] LIU S C, HU S J. An offset finite element model and its applications in predicting sheet metal assembly variation [J]. International Journal of Machine Tools & Manufacture, 1995, 35(11): 1545�C1557.
[5] LIU S C, HU S J. A parametric study of joint performance in sheet metal assembly [J]. International Journal of Machine Tools & Manufacture, 1997, 37(6): 873�C884.
[6] HU Min, LIN Zhong-qin, LAI Xin-min, NI Jun. Simulation and analysis of assembly processes considering compliant, non-ideal parts and tooling variations [J]. International Journal of Machine Tools & Manufacture, 2001, 41(15): 2233�C2243.
[7] BLANCHOT V, DAIDIE A. Riveted assembly modelling: study and numerical characterization of a riveting process [J]. Journal of Materials Processing Technology, 2006, 180(1�C3): 201�C209.
[8] PORCARO R, HANSSEN A G, LANGSETH M, AALBERG A. Self-piercing riveting process: An experimental and numerical investigation [J]. Journal of Materials Processing Technology, 2006, 171(1): 10�C20.
[9] BEDAIR O K, EASTAUGH G F. A numerical model for analysis of riveted splice joints accounting for secondary bending and plates/ rivet interaction [J]. Thin-Walled Structures, 2007, 45(3): 251�C258.
[10] DAHLSTROM S, LINDKVIST L. Variation simulation of sheet metal assemblies using the method of Influence coefficients with contact modeling [J]. Journal of Manufacturing Science & Engineering, 2007, 129(3): 615�C622.
[11] BOUCHARD P O, LAURENT T, TOLLIER L. Numerical modeling of self-pierce riveting-from riveting process modeling down to structural analysis [J]. Journal of Materials Processing Technology, 2008, 202(1): 290�C300.
[12] LI Yu-wen, XI Feng-feng, BEHDINAN K. Dynamic modeling and simulation of percussive impact riveting for robotic automation [J]. Journal of Computational & Nonlinear Dynamics, 2010, 5(2): 1090�C1097.
[13] CHENG H, LI Y, ZHANG K F, SU J B. Efficient method of positioning error analysis for aeronautical thin-walled structures multi-state riveting [J]. International Journal of Advanced Manufacturing Technology, 2011, 55(1): 217�C233.
[14] CHENG Hui, LI Yuan, ZHANG Kai-fu, MU Wei-qiang, LIU Bo-feng. Variation modeling of aeronautical thin-walled structures with multi-state riveting [J]. Journal of Manufacturing Systems, 2011, 30(2): 101�C115.
[15] MUCHA J. A study of quality parameters and behaviour of self-piercing riveted aluminium sheets with different joining conditions [J]. Strojniski Vestnik-Journal of Mechanical Engineering, 2011, 57(4): 323�C333.
[16] CHEN N J, DUCLOUX R, PECQUET C, MARRIEUX J, THONNERIEUX M, WAN Min, CHENOT J L. Numerical and experimental studies of the riveting process [J]. International Journal of Material Forming, 2011, 4(1): 45�C54.
[17] WANG Hua. Riveting sequence study of horizontal stabilizer assembly using finite-element analysis and riveting equivalent unit [J]. Journal of Aerospace Engineering, 2014, 27(6): 04014040.
[18] LIU G, HUAN H L, KE Y L. Study on analysis and prediction of riveting assembly variation of aircraft fuselage panel [J]. International Journal of Advanced Manufacturing Technology, 2014, 75(5�C8): 991�C1003.
[19] MORI K, ABE Y, KATO T. Self-pierce riveting of multiple steel and aluminium alloy sheets [J]. Journal of Materials Processing Technology, 2014, 214(10): 2002�C2008.
[20] HAN S L, ZENG Q L, LIN C, GAO Y, JIA Y F. Variation analysis of auto-body aluminum alloy sheet metal assembly in self-pierce riveting [J]. International Journal of Advanced Manufacturing Technology, 2014, 70(1�C4): 701�C709.
[21] ABDELAL G F, GEORGIOU G, COOPER J, ROBOTHAM A, LEVERS A, LUNT P. Numerical and experimental investigation of aircraft panel deformations during riveting process [J]. Journal of Manufacturing Science & Engineering, 2015, 137(1): 011009.
[22] ZHANG Kai-fu, CHENG Hui, LI Yuan. Riveting process modeling and simulating for deformation analysis of aircraft��s thin-walled sheet-metal parts [J]. Chinese Journal of Aeronautics, 2011, 24(3): 369�C377.
(Edited by YANG Hua)
���ĵ���
���ڼ�í��װ���������Ԫ��ֵ���������ʵ����֤
ժҪ���ڱ��ڼ�װ������У�í��װ������í��װ��ƫ����í��װ�䣬������í��װ�����۱���ģ�ͣ�ͨ����̬��˲̬���������4��í����í��װ�����í�ӱ��Ρ�ͬʱ����������Ԫ���������ı��ڼ�װ��ṹ����װ�����ƫ���������ͨ���������任���Ϳռ�ֱ����Ϸ�������í���Լ��IJ����������������������бȽϷ����������������������뱡�ڼ��Ϲؼ���ı���ƫ�����鴦������Ƚ��Ǻϣ��Ӷ�֤�������۷����������������鴦����������ȷ�Ժ���Ч�ԡ�ͨ�����ϱ��ڼ�í��װ�����ƫ����о�����Ϊ�Ժ���ߺ��ƴ��ͱ��ڼ�װ��ṹ��װ�侫���ṩ���ۺͷ���������
�ؼ��ʣ����ڼ�װ�䣻װ�����ƫ����۱���ģ�ͣ�����Ԫ���棻�������
Foundation item: Project(51675100) supported by the National Natural Science Foundation of China; Project(2016ZX04004008) supported by the National Numerical Control Equipment Major Project of China; Project(6902002116) supported by the Foundation of Certain Ministry of China
Received date: 2016-04-18; Accepted date: 2017-12-01
Corresponding author: TANG Wen-cheng, PhD, Professor; Tel: +86�C25�C52090501�C8403; E-mail: tangwc@seu.edu.cn, 230149296@ seu.edu.cn

