
J. Cent. South Univ. (2021) 28: 1615-1626
DOI: https://doi.org/10.1007/s11771-021-4721-y

Rheological, mechanical, thermal, tribological and morphological properties of PLA-PEKK-HAp-CS composite
GURCHETAN Singh1, RANVIJAY Kumar1, 2, RUPINDER Singh1, 3,MD MUSTAFIZUR Rahman4, SEERAM Ramakrishna5
1. Department of Production Engineering, Guru Nanak Dev Engineering College, Ludhiana 141106, India;
2. Department of Mechanical Engineering, University Center for Research and Development,Chandigarh University, Mohali 140413, India;
3. Department of Mechanical Engineering, National Institute of Technical Teachers Training and Research, Chandigarh 160019, India;
4. Department of Mechanical Engineering, Universiti Malaysia Pahang, Pahang 26600, Malaysia;
5. Department of Mechanical Engineering, National University of Singapore, 119077, Singapore
 Central South University Press and Springer-Verlag GmbH Germany, part of Springer Nature 2021
Abstract: The present study reports investigations on rheological, mechanical, thermal, tribological and morphological properties of feedstock filaments prepared with polylactic acid-polyether ketone ketone-hydroxyapatite-chitosan (PLA-PEKK-HAp-CS) composite for 3D printing of functional prototypes. The study consists of a series of melt processing operations on melt flow index (MFI) setup as per ASTM D-1238 for melt flow certainty followed by fixation of reinforcement composition/proportion as 94%PEKK-4%HAp-2%CS (B) by mass in PLA matrix (A). The blending of reinforcement and preparation of feedstock filament for fused deposition modeling (FDM) set up has been performed on commercial twin screw extruder (TSE). The results of study suggest that feedstock filaments prepared with blend of 95%A-5%B (by mass) at 200 ��C processing temperature and 100 r/min rotational speed on TSE resulted into better tensile properties (35.9 MPa peak strength and 32.3 MPa break strength) with 6.24% surface porosity, 42.67 nm surface roughness (Ra) and acceptable heat capacity (2.14 J/g). However as regards to tribological behavior, the minimum wear of 316 ��m was observed for sample with poor tensile properties. As regards to crash application for scaffolds the maximum toughness of 1.16 MPa was observed for 85%A-15%B (by mass) at 200 ��C processing temperature and 150 r/min rotational speed on TSE.
Key words: polylactic acid-polyether ketone ketone-hydroxyapatite-chitosan (PLA-PEKK-HAP-CS); twin screw extruder (TSE); differential scanning calorimetry (DSC); melt flow index (MFI); wear test
Cite this article as: GURCHETAN Singh, RANVIJAY Kumar, RUPINDER Singh, MD MUSTAFIZUR Rahman, SEERAM Ramakrishna. Rheological, mechanical, thermal, tribological and morphological properties of PLA-PEKK-HAp-CS composite [J]. Journal of Central South University, 2021, 28(6): 1615-1626. DOI: https://doi.org/ 10.1007/s11771-021-4721-y.
1 Introduction
In the past decade, a lot of research efforts have been made to prepare thermoplastic composite matrix for 3D printing and injection moulding applications [1, 2]. Many studies were reported on different engineering thermoplastic materials (both virgin as well as composites) with improved mechanical properties [3-5]. In the extrusion based 3D printing, fused deposition modelling (FDM) has been widely accepted mainly because of its low processing cost.
In FDM of poly-ether-ether-ketone (PEEK), it is found that melt-pressure has an influence on extruded filament-diameter and on its surface morphology in a way that higher melt-pressure reduces surface-defects on the filament. Also, there exists a good straight line relationship between the extruded filament-diameter and the extrusion-speed when the later range is between -5 to 80 mm/min [6]. PEEK has excellent biocompatibility with elastic modulus of 3.6 GPa and tensile strength of 90-100 MPa [7]. Along with this it possesses less weight when compared with conventional materials that have been utilized for making implants. PEEK has less water-absorption tendency and flexibility to withstand bending without being broke. It is sufficiently stable at higher temperatures as it starts melting at 343 ��C. PEEK has bone-like properties and is extensively used for customization according to patient specific needs. PEEK finds applications in orthopaedic surgery, spinal implants, bone-pins and screws, heart stents and valves, dental implants and facial reconstruction. There exists a clear relationship between thermal criteria of FDM process, i.e., heat treatment, nozzle-temperature, ambient-temperature and corresponding tensile results and printed pure PEEK��s crystallinity. The crystallinity rises from 16.94% to 31.16% when ambient temperature varies from 25 to 200 ��C. Varying the thermal characteristics of FDM process can produce not only different results among given number of specimens but also different results at different sites within any given specimen [8-10]. Carbon-fibre (CF) reinforced PEEK specimens produced using 3D printing process give low density when compared against the cast counterparts. Water absorption is also more in printed parts. Thermal conductivity of printed parts is about 25%-30% less when compared against cast parts. But in printed parts, directional control over anisotropy of the thermal characteristics can be obtained according to design requirements whereas this cannot be possible in cast parts where carbon fibres are always aligned along direction of polymer��s laminar flow [10-14].
Another thermoplastic material PEKK also acquired attention because of its capability to be processed at reduced temperatures compared to PEEK. Also, PEKK is about 60% less costly compared to PEEK [15]. It has been reported that the composite of PLA with carbon-nano tubes containing carboxyl groups (COOH) results in increase of break-elongation, tensile strength, glass- transition temperature (Tg), impact strength and thermal-degradation temperature and produces a composite with good toughness and strength [16]. HAp micro-spheres are added in PLA matrix so at to increase bone-regeneration capacity, bio-mimicry and bio-activity of printed scaffolds. Pure PLA��s surface is found smoother as compared to rough surface of PLA/HAp composite. The increased porosity in the composite resulted in weaker mechanical performance of the printed specimens by FDM [17]. When a composite of PLA is prepared with posidonia oceanica��s (PO) leaves, it is found that both flexural modulus and tensile modulus increase at the same time, but the flexural strength and tensile strength decrease [18]. PLA has limited cell-proliferation due to lack of cell- recognition sites and hydrophilicity. Aminolysis and hydrolysis are two effective surface modification methods to increase the cell growth on PLA��s surface as these make its surface more hydrophilic and porous [19]. When a pressurized- fluid additive, such as carbon-dioxide (CO2), is added in PLA, there is a decrease in its viscosity as well as its processing temperature. Processing temperature decreases by 10 ��C when CO2 is added 1.7% by weight and viscosity is reduced twice the value when 2.65 wt% CO2 is added as compared to reduction obtained on adding acetyltributylcitrate [20]. The use of talc as filler in PLA increases its elastic modulus. The addition of carbon nano-tubes raises both its modulus and tensile strength. By adding graphite derivatives, the electrical conductivity is increased. Layered silicates improve flexural and tensile strength. The addition of HAp improves bone-bonding ability. The presence of calcium carbonate in PLA improved mechanical performance. Treated ZnO in PLA matrix gives anti-bacterial action [21]. Various food companies are using PLA for packaging purposes. It is found that PLA packing is best suited for semi-dry food-items while it is very sensitive to liquid and high-moisture foods [22]. To reduce the porosity of 3D printed PLA, a control is required over speed and temperature of extrusion. 3D printing process results in an increase in crystallinity and a decrease in ductility of PLA. PLA��s elasticity is not affected much by the printing process. The toughness of injection moulded PLA is lower compared to 3D printed PLA [23]. When gamma irradiated pure PLA, octavinyl-polyhedral-oligomeric- silsesquioxane PLA/(ovPOSS) composites and triallylisocyanurate (TAIC)/PLA composites are analyzed, and then it is found that all the samples show higher elastic modulus and lower break- elongation. The specimens subjected to gamma rays have more thermal stability than un-irradiated ones. Heat-deflection-temperature (HDT) of PLA/TAIC and PLA/ovPOSS composites is found to be higher when compared to pure PLA [24]. When examining the linear-low-density-polyethylene (LLDPE)/micro- cellulose fiber (MCC)/PLA composite, it is found that tensile strength decreased to 56%, and elongation raised to 9% as compared to pure PLA. The toughness of the composite is less than that of PLA. No variation is observed in glass-transition temperature [25]. Cellulose nano- fibrils (CNF) added to PLA lead to a rise in elastic modulus, although there is a decrease in molecular weight. No variation is observed in thermal stability of the specimen. As the content of CNF in PLA is increased, the brittleness of the specimen also increases [26]. The reported literature outlined 3D printing by FDM for various biodegradable/ biocompatible thermoplastic materials. Some studies detailed the aspects of blending of bio- degradable materials with nano/micro fillers for fabrication of porous structures [27-29]. But hitherto very little has been reported on the blending of ceramic particles reinforced thermoplastic into bio-degradable/bio-compatible thermoplastic for feedstock filaments preparations in two stages (for ease of extrusion from commercial manufacturing view point). In this study, HAp-CS particles were blended in PEKK matrix in the first stage, followed by their blending in PLA polymer in the second stage for biomedical applications.
2 Materials and methods
For the present study, PLA (procured from Batra polymer, India, 50 ��m) has been selected as matrix materials. PEKK (procured from Batra polymer, India, 100 ��m), HAP and CS (procured from Shiva Chemical, India, 50 ��m) have been selected as reinforcements particles. Figure 1 shows the steps involved in present study to conduct the melt processes for investigations of PLA-PEKK- HAp-CS based feedstock filaments.
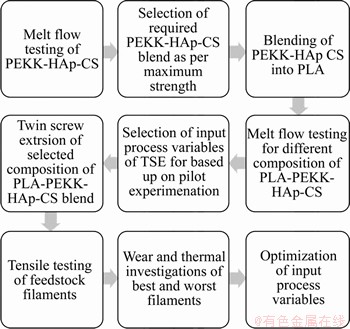
Figure 1 Steps for preparation of PLA-PEKK-Hap-CS based feedstock filaments
3 Experiment
3.1 Melt flow index (MFI)
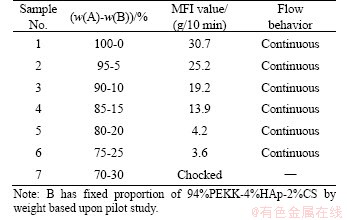
MFI is one of the rheological properties which determine the flow ability of material in terms of deposition per unit time (usually g/10 min). During pilot testing in the first stage it was observed in melt flow testing that three compositions/ proportions, i.e., 90%PEKK-8%HAp-2%CS, 94%PEEK-4%HAp-2%CS and 96%PEEK-2%HAp- 2%CS have qualified the flow continuity test as per ASTM D-1238. Further based on the tensile testing, 94%PEKK-4%HAp-2%CS, B has shown the maximum tensile properties as per ASTM 638 type IV, so this composition/proportion has been finalized as reinforcement for further experimentation.
Further different weight percentages of the reinforcement B in PLA matrix A has been tested to find out the suitable composition/proportion for establishing flow behavior based upon rheological property. The MFI test has been performed with a load of 2.16 kg at 190 ��C according to ASTM D1238. Figure 2 shows pictorial view of MFI tester.
Table 1 shows the MFI output for the second stage reinforcement. It has been observed that flow behavior was continuous throughout the extrusion process. The composition/proportion as 100%, A, was discarded for further investigations without any reinforcements.
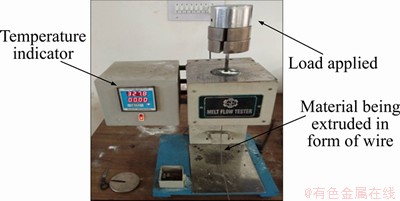
Figure 2 MFI tester
Table 1 MFI of different A-B thermoplastic composite compositions/proportions
3.2 Preparations of feedstock filaments with TSE
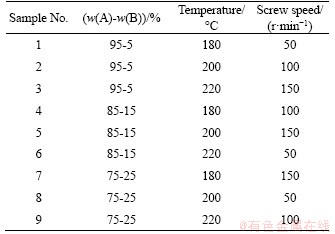
For preparation of feed stock filaments on TSE, three compositions/ proportions of A-B as 75%-25%, 85%-15% and 95%-5% (based upon Table 1) were judicially selected as one with the lowest, middle and highest mass proportion of reinforcement (see Table 2). Levels of temperature and screw speed have been selected as per uniformity in dimensions of prepared feedstock filaments. It has been observed in trial experimentation that filaments prepared under temperature of 180-220 ��C and screw speed of 50-150 r/min were better dimensionally controlled.
Table 2 Design of experiment as per Taguchi L9 O.A
3.3 Tensile testing
The tensile testing of the extruded wires has been performed on universal tensile tester (UTT) (Company: Shanta Engineering, India, Model: SE 500 kg) using grip separation of 50 mm with extension rate of 50 mm/min with wire samples of (2��0.05) mm diameter (Figure 3). Tensile strength at peak (ultimate strength) and tensile strength at break (fracture strength) have been recorded as the experimental output (Table 3).
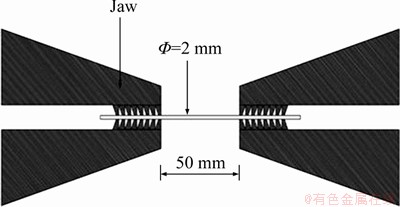
Figure 3 Tensile testing of extruded wires
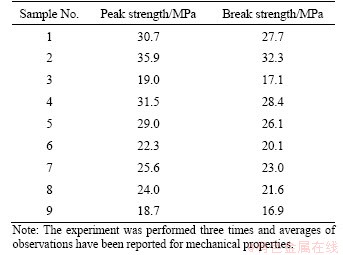
Table 3 Tensile properties of feedstock filaments
4 Results and discussion
4.1 Tensile strength
Based on Table 3, Figure 4 shows stress-strain curves obtained for tensile testing of feedstock filaments. It should be noted that the maximum tensile strength (peak strength: 35.9 MPa and break strength: 32.3 MPa) was obtained for sample 2 (composition: 95%A-5%B, 200 ��C temperature and 100 r/min screw speed) whereas the minimum tensile strength (peak strength: 18.7 MPa and break strength: 16.9 MPa) was obtained for sample 9 (composition: 75%A-25%B, 220 ��C temperature and 100 r/min screw speed). Sample 2 has achieved the maximum tensile strength may due to lower reinforcement percentage and higher processing temperature.
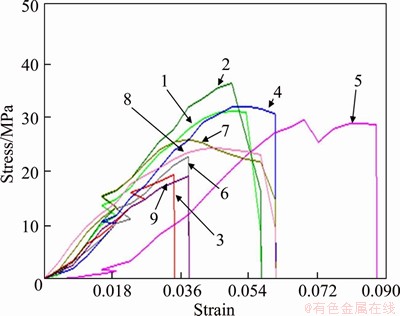
Figure 4 Stress-strain curves for tensile properties of feedstock filaments
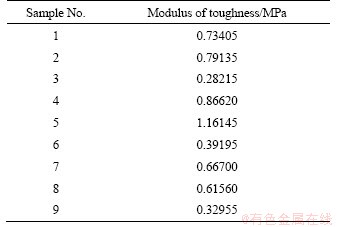
Based on Table 3 and Figure 4, Table 4 shows the calculated values for modulus of toughness. As shown in Table 4, sample 5 has the highest value for modulus of toughness, and hence it represents the best condition for crash applications (as scaffold/ implant material).
Table 4 Calculated values for modulus of toughness
4.2 Differential scanning calorimetry (DSC)
Based on the tensile testing results the best sample obtained in tensile test, i.e., sample 2 and the worst sample, i.e., sample 9 were subjected to DSC analysis (Figure 5). The interpretation of Tg in DSC analysis shows that there is no significant variation (57.24 ��C for sample 2 and 57.16 ��C for sample 9). The normalized heat capacity for samples 2 and 9 were 2.14, 1.20 J/g, respectively. The differences in the normalized heat capacity rate may occur due to the presence of higher PEKK- Hap-CS content in sample 9 (25%) and lower PEKK-HAp-CS content in sample 2 (%) and other material processing conditions.
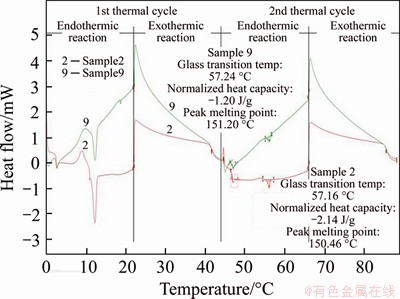
Figure 5 DSC curves for samples 2 and 9
4.3 Wear analysis
For wear analysis, cylindrical pins of the best sample (sample 2) and the worst sample (sample 9) based on tensile testing have been prepared by hot mounting machine and tested for wear on standard pin-on-disc tribometer by using following conditions: cycle time 5 min, load applied 1 kg, track diameter 80 mm, screw speed 277 r/min.
Figure 6 shows wear test results (including coefficient of friction, wear rate in micron and wear track) of sample 2 and sample 9. It should be noted that wear of sample 2 was more (611 ��m) compared to sample 9 (316 ��m). The same is also observed by wear track. The lesser wear of sample 9 may be due to the fact that higher proportion of PEKK-HAp-CS (25%) provides higher resistant of wear.
4.4 Influences of process parameters and optimization
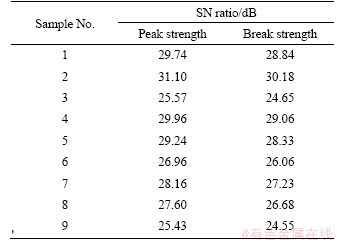
The signal to noise (SN) ratio has been calculated for investigating influence of process parameters on tensile properties. Tensile properties are always required to be higher for feed stock filament so for such properties that the SN ratio can be calculated as:

where �� is the SN ratio; n is the number of experiments; y is the tensile properties at the k-th experiment. Table 5 shows SN ratio for tensile properties.
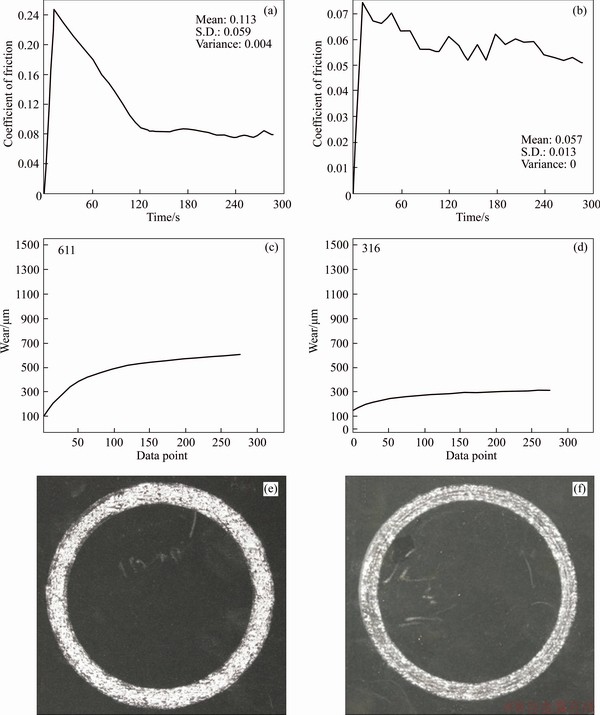
Figure 6 Wear analysis of sample 2 (a, c, e) and sample 9 (b, d, f)
4.5 Influence of process parameter and optimization of peak strength
Based upon Table 5, Figure 7 shows the main effects plot of SN ratios for peak strength. It has been observed that the largest value for peak strength can be obtained under following conditions: composition 95%A-5%B, temperature 200 ��C, 100 r/min.
Table 6 shows analysis of variance (ANOVA) of SN ratios for peak strength. Residual error obtained is 5.10% which shows that the predicted model has a good accuracy.
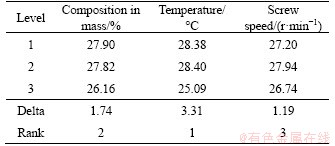
Table 7 shows response table for SN ratios of peak strength. It should be noted that changes in temperature have been ranked 1, followed by composition as rank 2 and screw speed ranked 3 (for changes over SN ratios of peak strength as observed by delta value).
Table 5 SN ratios of peak strength and break strength'
For optimization of peak strength, a mathematical approach has been used as follows:
��opt=��+(��A1-��)+(��B2-��)+(��C2-��)
where ��opt is optimum SN ratio value for peak strength; �� is overall average of SN data; ��A1 is average of SN data for composition at level 1; ��B2 is average of SN data for temperature at level 2; ��C2 is average of SN data for screw speed at level 2. zopt2=(10)��opt/10 is used for properties where the larger is the better, and then
��=28.20 dB,
��A1=28.81 dB,
��B2=29.32 dB,
��C2=28.83 dB,
��opt=28.20+(28.81-28.20)+(29.32-28.20)+
(28.83�C28.20)=30.56 dB,
zopt2=(10)��opt/10=(10)30.56/10=1137.62.
So, the predicted optimum peak strength is 33.73 MPa.
It should be noted that suggested setting is available in Table 3 and the observed value obtained is 35.9 MPa.
4.6 Influence of process parameter and optimization of break strength
Figure 8 shows main effects plots of SN ratios for break strength. The largest value for break strength is obtained in Sample 2 which is the combination of following conditions: composition 95%A-5%B, temperature 200 ��C, 100 r/min.
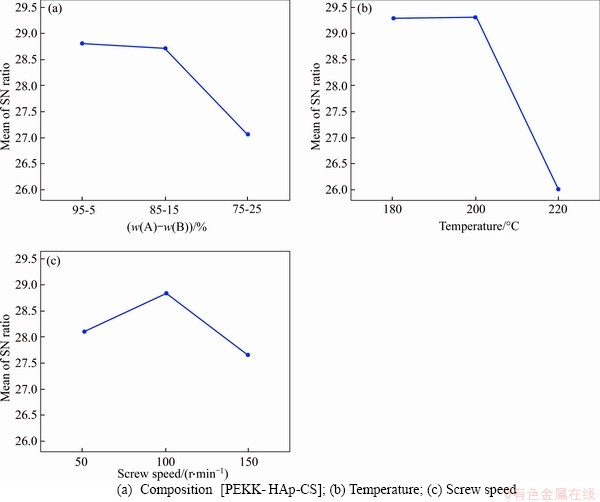
Figure 7 Main effects plot for SN ratios (peak strength):
Table 6 ANOVA for SN ratios of peak strength
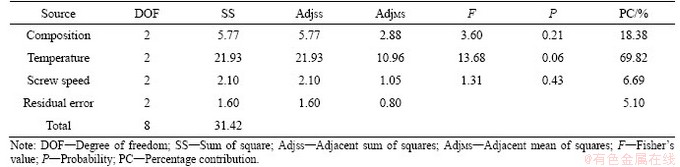
Table 7 Response table for SN ratios of peak strength
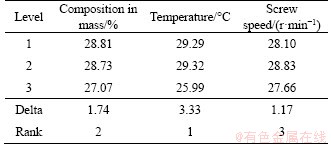
Table 8 shows ANOVA of SN ratios for break strength. Residual error obtained is 5.04% which shows that the predicted model has a good accuracy. Table 9 shows the response for SN ratios of break strength.
For optimization of break strength, a mathematical approach similar to peak strength has been used as follows:
��opt=��+(��A1-��)+(��B2-��)+(��C2-��)
��=27.29 dB,
��A1=27.90 dB,
��B2=28.40 dB,
��C2=27.94 dB,
��opt=27.29+(27.90-27.29)+(28.40-27.29)+
(27.94-27.29 )=29.66 dB,
zopt2=(10) ��opt/10=(10)29.66/10=924.69.
So, the predicted break strength at optimum parametric setting is 30.41 MPa.
It should be noted that the suggested setting is available in Table 3 and observed value for break strength is 32.3 MPa.
Figures 9(a)-(c) show contour plots for combined optimization of tensile properties. The SN ratios of peak strength and break strength have been combined by plotting contour interaction between process variables, i.e., compositions, temperature and screw speed. From Figures 8(a)-(c) it can be predicted that for achieving the maximum tensile strength in TSE, the level 1 of composition (95%A-5%B), level 2 of barrel temperature (200 ��C) and level 2 of screw speed (100 r/min) are the best settings
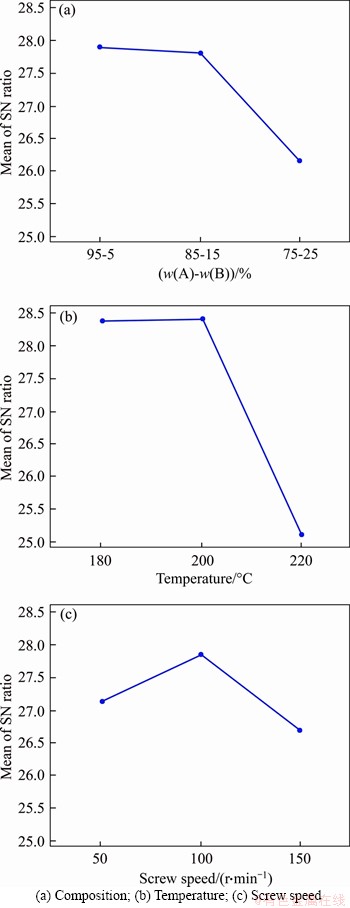
Figure 8 Main effects plot for SN ratios (break strength):
Table 8 ANOVA for SN ratios of break strength
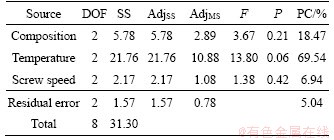
Table 9 Response table for SN ratios of break strength
4.7 Morphological analysis
The metallurgical image analysis software (MIAS) was used to investigate the percentage porosity on the cross section of feedstock filaments at ��100 magnification. The interpretation of MIAS suggested that porosity on sample 2 was 6.24% and on sample 9 was 11.77% (see Figure 9). As a matter of fact, the porosity is undesirable output process parameter which reduces the tensile properties and it should be minimized for feedstock filaments. Based on Figure 10, Figure 11 shows rendered image of photomicrographs and Ra value for samples 2 and 9. As observed from Figure 10, more uniform grains with lower Ra value has been observed for sample 2, thus justifying its better mechanical properties.
5 Conclusions
1) It has been observed that the compositions 95%A-5%B, 90%A-10%B and 85%A-15%B, 80%A-20%B and 75%A-25%B were acceptable based on MFI. But based on tensile properties and thermal stability, 95%A-5%B is better option,whereas from wear properties view point 75%A-25%B is better option.
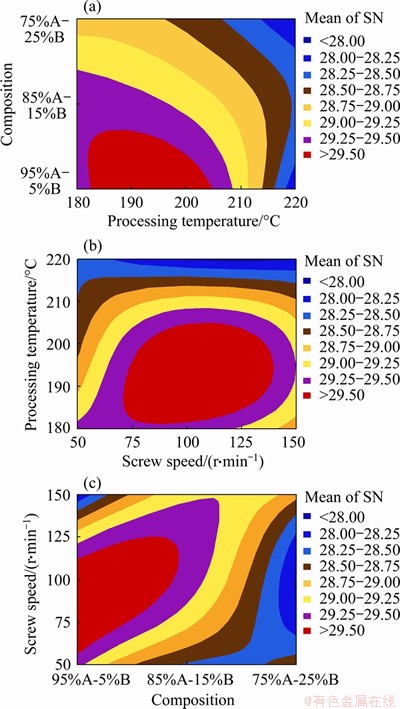
Figure 9 Contour plot for SN vs composition, processing temperature and screw speed
2) The TSE based feed stock filament has shown acceptable level of porosity, wear properties for rapid tooling applications (as evident from wear and morphological data for samples).
3) The optimized parameters for TSE from tensile strength view point are 95%A-5%B at 200 ��C processing temperature and 100 r/min rotational speed. The processing temperature of TSE has emerged as the most significant parameter for tensile strength (peak and break) with contribution around 69%. The results of experimental study outlined that 35.9 MPa peak strength and 32.3 MPa break strength with 6.24% surface porosity, 42.67 nm Ra and 2.14 J/g heat capacity can be achieved. However, as regards to tribological behavior, the minimum wear of 316 ��m was observed for sample with poor tensile properties. As regards to crash application for scaffolds,the maximum modulus of toughness 1.16 MPa was observed for 85%A-15%B at 200 ��C processing temperature and 150 r/min rotational speed on TSE.
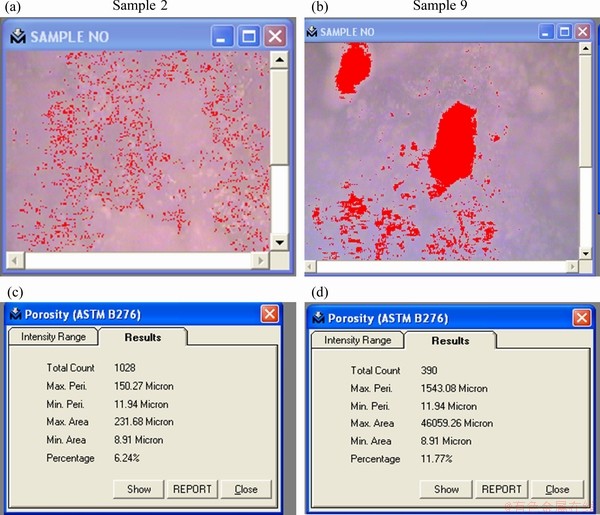
Figure 10 Porosity analysis of samples 2 (a, c) and 9 (b, d)
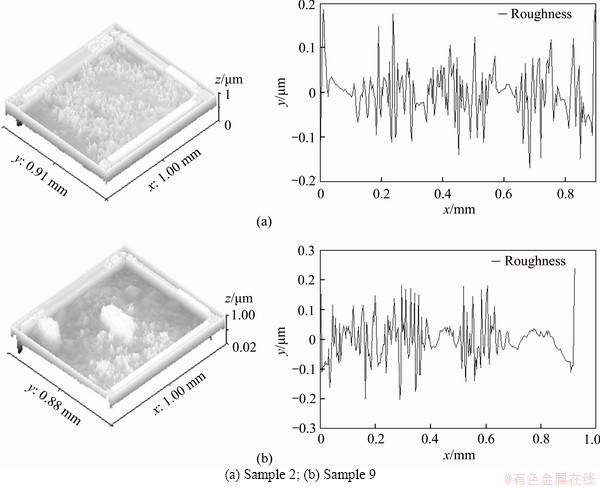
Figure 11 Rendered image of photomicrographs and Ra profile for:
4) In further studies, finally prepared feed stock filament needs to be 3D printed by considering process parameters of commercial FDM system without change in hardware/soft ware of the system. Also in-vitro and in-vivo studies for acceptability of 3D printed PLA composites needs to be performed.
Acknowledgement
The authors are highly thankful to Guru Nanak at Dev Engg. College, Ludhiana (GNDEC) and SERB (File No. IMRC/AISTDF/R&D/P-10/2017) for providing financial/technical assistance to carry out the research.
Contributors
The overarching research goals were developed by RUPINDER Singh, MD MUSTAFIZUR Rehman and SEERAM Ramakrishna. GURCHETAN Singh and RANVIJAY Kumar provided the experimental data, and analyzed the measured data. RANVIJAY Kumar and RUPINDER Singh established the models and calculated the predicted results. The initial draft of the manuscript was written by GURCHETAN Singh, RANVIJAY Kumar and RUPINDER Singh. All authors replied to reviewers�� comments and revised the final version.
Conflict of interest
GURCHETAN Singh, RANVIJAY Kumar, RUPINDER Singh, MD MUSTAFIZUR Rahman, SEERAM Ramakrishna declare that they have no conflict of interest.
References
[1] SINGH R, BEDI P, FRATERNALI F, AHUJA I P S. Effect of single particle size, double particle size and triple particle size Al2O3 in Nylon-6 matrix on mechanical properties of feed stock filament for FDM [J]. Composites Part B: Engineering, 2016, 106: 20-27.
[2] SINGH R, KUMAR R, RANJAN N. Sustainability of recycled ABS and PA6 by banana fiber reinforcement: Thermal, mechanical and morphological properties [J]. Journal of the Institution of Engineers (India): Series C, 2019, 100(2): 351-360.
[3] SINGH R, KUMAR R, RANJAN N, PENNA R, FRATERNALI F. On the recyclability of polyamide for sustainable composite structures in civil engineering [J]. Composite Structures, 2018, 184: 704-713.
[4] KUMAR R, SINGH R, AHUJA I P S, AMENDOLA A, PENNA R. Friction welding for the manufacturing of PA6 and ABS structures reinforced with Fe particles [J]. Composites Part B: Engineering, 2018, 132: 244-257.
[5] KUMAR R, SINGH R, FARINA I. On the 3D printing of recycled ABS, PLA and HIPS thermoplastics for structural applications [J]. PSU Research Review, 2018, 2(2): 115-137.
[6] GENG Peng, ZHAO Ji, WU Wen-zheng, YE Wen-li, WANG Yu-lei, WANG Shuo-bang, ZHANG Shuo. Effects of extrusion speed and printing speed on the 3D printing stability of extruded PEEK filament [J]. Journal of Manufacturing Processes, 2019, 37: 266-273.
[7] HALEEM A, JAVAID M. Polyether ether ketone (PEEK) and its 3D printed implants applications in medical field: An overview [J]. Clinical Epidemiology and Global Health, 2019, 7(4): 571-577.
[8] YANG Chun-cheng, TIAN Xiao-yong, LI Di-chen, CAO Yi, ZHAO Feng, SHI Chang-quan. Influence of thermal processing conditions in 3D printing on the crystallinity and mechanical properties of PEEK material [J]. Journal of Materials Processing Technology, 2017, 248: 1-7.
[9] STEPASHKIN �� ��, CHUKOV D I, SENATOV F S, SALIMON A I, KORSUNSKY A M, KALOSHKIN S D. 3D-printed PEEK-carbon fiber (CF) composites: Structure and thermal properties [J]. Composites Science and Technology, 2018, 164: 319-326.
[10] DENG Li-jun, DENG Yi, XIE Ke-nan. AgNPs-decorated 3D printed PEEK implant for infection control and bone repair [J]. Colloids and Surfaces B: Biointerfaces, 2017, 160: 483-492.
[11] TORSTRICK F B, LIN A S P, POTTER D, SAFRANSKI D L, SULCHEK T A, GALL K, GULDBERG R E. Porous PEEK improves the bone-implant interface compared to plasma-sprayed titanium coating on PEEK [J]. Biomaterials, 2018, 185: 106-116.
[12] YU Xiao-ming, IBRAHIM M, LIU Zong-yuan, YANG Hua-zhe, TAN Li-li, YANG Ke. Biofunctional Mg coating on PEEK for improving bioactivity [J]. Bioactive Materials, 2018, 3(2): 139-143.
[13] BRUM R S, MONICH P R, BERTI F, FREDEL M C, PORTO L M, BENFATTI C A M, SOUZA J C M. On the sulphonated PEEK for implant dentistry: Biological and physicochemical assessment [J]. Materials Chemistry and Physics, 2019, 223: 542-547.
[14] BERRETTA S, DAVIES R, SHYNG Y T, WANG Y, GHITA O. Fused Deposition Modelling of high temperature polymers: Exploring CNT PEEK composites [J]. Polymer Testing, 2017, 63: 251-262.
[15] NASSIR N, BIRCH R S, CANTWELL W J, WANG Q Y, LIU L Q, GUAN Z W. The perforation resistance of glass fibre reinforced PEKK composites [J]. Polymer Testing, 2018, 72: 423-431.
[16] ZHOU Ying-hui, LEI Liang, YANG Bo, LI Jian-bo, REN Jie. Preparation and characterization of polylactic acid (PLA) carbon nanotube nanocomposites [J]. Polymer Testing, 2018, 68: 34-38.
[17] ESPOSITO C C, GERVASO F, SCALERA F, PADMANABHAN S K, MADAGHIELE M, MONTAGNA F, SANNINO A, LICCIULLI A, MAFFEZZOLI A. Highly loaded hydroxyapatite microsphere/ PLA porous scaffolds obtained by fused deposition modelling [J]. Ceramics International, 2019, 45(2): 2803-2810.
[18] SCAFFARO R, LOPRESTI F, BOTTA L. PLA based biocomposites reinforced with Posidonia oceanica leaves [J]. Composites Part B: Engineering, 2018, 139: 1-11.
[19] SHI Xu-dong, CUI Li-guo, SUN Hai, JIANG Ni, HENG Li-ping, ZHUANG Xiu-li, GAN Zhi-hua, CHEN Xue-si. Promoting cell growth on porous PLA microspheres through simple degradation methods [J]. Polymer Degradation and Stability, 2019, 161: 319-325.
[20] FERNANDEZ-RONCO M P, HUFENUS R, HEUBERGER M. Effect of pressurized CO2 and N2 on the rheology of PLA [J]. European Polymer Journal, 2019, 112: 601-609.
[21] MURARIU M, DUBOIS P. PLA composites: From production to properties [J]. Advanced Drug Delivery Reviews, 2016, 107: 17-46.
[22] ROCCA-SMITH J R, CHAU N, CHAMPION D, BRACHAIS C H, MARCUZZO E, SENSIDONI A, PIASENTE F, KARBOWIAK T, DEBEAUFORT F. Effect of the state of water and relative humidity on ageing of PLA films [J]. Food Chemistry, 2017, 236: 109-119.
[23] SONG Y, LI Y, SONG W, YEE K, LEE K Y, TAGARIELLI V L. Measurements of the mechanical response of unidirectional 3D-printed PLA [J]. Materials & Design, 2017, 123: 154-164.
[24] KODAL M, WIS A A, OZKOC G. The mechanical, thermal and morphological properties of ��-irradiated PLA/TAIC and PLA/OvPOSS [J]. Radiation Physics and Chemistry, 2018, 153: 214-225.
[25] BHASNEY S M, BHAGABATI P, KUMAR A, KATIYAR V. Morphology and crystalline characteristics of polylactic acid [PLA]/linear low density polyethylene [LLDPE]/ microcrystalline cellulose [MCC] fiber composite [J]. Composites Science and Technology, 2019, 171: 54-61.
[26] GAZZOTTI S, RAMPAZZO R, HAKKARAINEN M, BUSSINI D, ORTENZI M A, FARINA H, LESMA G, SILVANI A. Cellulose nanofibrils as reinforcing agents for PLA-based nanocomposites: An in situ approach [J]. Composites Science and Technology, 2019, 171: 94-102.
[27] FABBROCINO F, FARINA I, AMENDOLA A, FEO L, FRATERNALI F. Optimal design and additive manufacturing of novel reinforcing elements for composite materials [C]//Proceedings of the VII European Congress on Computational Methods in Applied Sciences and Engineering (ECCOMAS Congress 2016). Crete Island, Greece. Athens: Institute of Structural Analysis and Antiseismic Research School of Civil Engineering National Technical University of Athens (NTUA) Greece, 2016: 1893-1908.
[28] FRATERNALI F, CARPENTIERI G, MONTUORI R, AMENDOLA A, BENZONI G. On the use of mechanical metamaterials for innovative seismic isolation systems [C]// COMPDYN 2015-5th ECCOMAS Thematic Conference on Computational Methods in Structural Dynamics and Earthquake Engineering. 2015: 349-358.
[29] AMENDOLA A, FABBROCINO F, FEO L, FRATERNALI F. Dependence of the mechanical properties of pentamode materials on the lattice microstructure [C]// ECCOMAS Congress 2016-Proceedings of the 7th European Congress on Computational Methods in Applied Sciences and Engineering. 2016: 2134-2150.
(Edited by ZHENG Yu-tong)
���ĵ���
PLA-PEKK-HAp-CS���ϲ��ϵ�����ѧ����ѧ����ѧ��Ħ��ѧ����̬ѧ����
ժҪ�������о�������3D��ӡ�Ĺ��ܲ��ϣ�PLA-PEKK-HAp-CS���ϲ��ϵ�����ѧ����ѧ������ѧ��Ħ��ѧ����̬ѧ���ܡ�����STM D-1238������������ָ��Ҫ��ȷ��94%PEKK-4%Hap-2%CS��Ϊ���Ӳ��ϣ��������������ָ��(MFI)װ�ã�������һϵ���ۻ��������飬Ȼ��һ���������Ƚ�PEKK94%-4%Hap-2%CS(B)��PLA(A)��ϡ�ԭ��˿��ǿ�����Ʊ��Ļ�����ڳ�������(FDM)��˫�ݸ˼�����(TSE)����ɡ����������ԭ��˿��95%A-5%B�������Ȼ���£���200 ��C �����¶Ⱥ͡���100 r/minת��ʱ�߱����õ��������ܣ���ֵǿ��Ϊ35.9 MPa������ǿ��Ϊ32.3 MPa�������϶��Ϊ6.24%������ֲڶ�(Ra)Ϊ42.67 nm���ɽ�������Ϊ2.14 J/g������Сĥ��Ϊ316 ��mʱ����Ʒ�������ܽϲ��200 ��C�����¶ȡ�150 r/min��ת�ٺ�85%A-15%B��������ʱ����Ʒ˿���������ģ��Ϊ1.16 MPa��
�ؼ��ʣ�PLA-PEKK-HAP-CS���ϲ��ϣ�˫�ݸ˼�������DSC����������ָ����ĥ������
Received date: 2019-02-15; Accepted date: 2020-07-24
Corresponding author: RUPINDER Singh, PhD, Professor; E-mail: rupindersingh@nitttrchd.ac.in; ORCID: https://orcid.org/0000-0001- 8251-8943

