ͭ���й���³�����ȴ��������µĸ�ʴ��Ϊ
��Դ�ڿ����й���ɫ����ѧ��(Ӣ�İ�)2016���6��
�������ߣ��³� ������ ���»� Ф�� ������ �θ� ������
����ҳ�룺1721 - 1728
�ؼ��ʣ�ͭ��������ʴ���ɷַ������绯ѧ����
Key words��copper; atmospheric corrosion; composition analysis; electrochemical technology
ժ Ҫ������ʧ�ز��ԡ���ò�۲졢�ɷַ����͵绯ѧʵ��Է�������³�����ȴ���������3��Ĵ�ͭ���д�����ʴ�о��������ʾ��ƽ��ʧ������Ϊ2.90 ��m/a��Զ���ڴ��ں����µĸ�ʴ���ʣ�ͭ�Ĵ�����ʴ������Ҫ��Cu2O��Cu2Cl(OH)3��ɣ������ڸ�ʪ������ѭ������ʴ����ֲ������ȣ��绯ѧʵ���������ʴ����Ĵ�������ֹ��ʴ�Ľ�һ�����������Dz���IJ����ȷֲ�����һ���̶��ϼ��ٸ�ʴ�Ľ��̡�
Abstract: The atmospheric corrosion behavior of pure copper exposed for three years in Turpan, China, which is a typical hot and dry atmosphere environment, was investigated using mass-loss tests, morphology observations, composition analyses, and electrochemical techniques. The results indicated that the annual corrosion rate of pure copper was approximately 2.90 ��m/a. An uneven distribution of corrosion products was observed by scanning electron microscopy; this uneven distribution was attributed to the dehydration process during wet�Cdry and cold�Chot cycles, and the compositions mainly consisted of cuprite (Cu2O) and atacamite (Cu2Cl(OH)3). Electrochemical measurements showed that deposits on copper improved its resistance to corrosion and the protectiveness decreased with increasing temperature. On the other hand, results obtained using the scanning vibrating electrode technique showed that the porous and uneven structure of the deposit layer generated a spatial separation of cathodic and anodic reaction sites, which accelerated the corrosion process in wet and rainy weather.
Trans. Nonferrous Met. Soc. China 26(2016) 1721-1728
De-cheng KONG1, Chao-fang DONG1, Yue-hua FANG2, Kui XIAO1, Chun-yun GUO2, Gang HE2, Xiao-gang LI1
1. Corrosion and Protection Center, Key Laboratory for Corrosion and Protection, Ministry of Education, University of Science and Technology Beijing, Beijing 100083, China;
2. Xinjinang Turpan Natural Environmental Test Research Center, Turpan 838200, China
Received 22 August 2015; accepted 6 January 2016
Abstract: The atmospheric corrosion behavior of pure copper exposed for three years in Turpan, China, which is a typical hot and dry atmosphere environment, was investigated using mass-loss tests, morphology observations, composition analyses, and electrochemical techniques. The results indicated that the annual corrosion rate of pure copper was approximately 2.90 ��m/a. An uneven distribution of corrosion products was observed by scanning electron microscopy; this uneven distribution was attributed to the dehydration process during wet�Cdry and cold�Chot cycles, and the compositions mainly consisted of cuprite (Cu2O) and atacamite (Cu2Cl(OH)3). Electrochemical measurements showed that deposits on copper improved its resistance to corrosion and the protectiveness decreased with increasing temperature. On the other hand, results obtained using the scanning vibrating electrode technique showed that the porous and uneven structure of the deposit layer generated a spatial separation of cathodic and anodic reaction sites, which accelerated the corrosion process in wet and rainy weather.
Key words: copper; atmospheric corrosion; composition analysis; electrochemical technology
1 Introduction
Copper has long been employed as an outdoor building material for constructing statues, sculptures, and monuments because of its good mechanical properties and corrosion resistance. Copper is also stable in a part of the stability region of water in the Pourbaix diagrams [1]. Because of the high conductivity of copper, it is an important electrical conductor in the communication and electronic industries; however, the atmospheric corrosion of copper is common.
The colors of copper corrosion products that form during outdoor exposure range from pink-salmon to dark-brown and green (patina); patina is the result of chemical interactions among trace contaminant elements in the atmosphere, primarily sulfates and chlorides. The composition and morphology of these corrosion products depend on the geographic location of the test station, climatic conditions, and contaminant aggressiveness levels [2,3].
Cuprite is generally the first corrosion product formed, irrespective of exposure conditions; it is therefore always present on the copper surface [4-7]. Cuprite reacts slowly with pollutants such as chloride ions, SO2, and CO2 to form basic copper salts. NASSAU et al [8,9] and PICCARDO et al [10] have identified the main compounds on Cu patinas formed in the atmosphere as follows: cuprite (Cu2O), brochantite (Cu4SO4(OH)6), antlerite (Cu3SO4(OH)4), ponsjankite (Cu4SO4(OH)6��H2O), and atacamite (Cu2Cl(OH)3).
The atmospheric corrosion rate depends mainly on pollutants present in the atmosphere, the time of wetness (i.e., the duration and frequency of wetting to which a metal surface is subjected [11,12]), and the rate at which the metal surface dries. The composition, hygroscopicity, and degree of the crystallization of the corrosion products are also functions of these parameters and can play important roles in determining the atmospheric corrosion kinetics of copper.
In a study related to the influence of seasonal variations (air temperature and relative humidity) on copper corrosion products, ZHANG et al [13] reported changes in the composition of the obtained patinas, especially those obtained after exposure periods of as short as a few months. In similar studies at three test sites in Tokyo during one summer month and one winter month, WATANABE et al [14] observed that cuprite and ponsjankite were formed on copper exposed in summer, whereas only cuprite formed when the exposure test was initiated in winter. The corrosion products formed at all three exposure sites were the same for both initiation seasons.
In this study, we analyzed the long-term corrosion of copper exposed in Turpan for 3 years. Turpan has a typical hot and dry atmosphere environment with a high temperature difference, low humidity, and long sunshine period; its climate is classified as a continental dry tropical desert. In our study, a copper plate (99.7%) was installed on a test rack with an inclination of 45�� and was exposed outdoor for 3 years. We used scanning electron microscopy (SEM), X-ray photoelectron spectroscopy (XPS), and X-ray diffraction (XRD) to analyze the morphology and composition of the deposits. The subsequent study was conducted in alkalescent chloride solution using electrochemical methods, including open- circuit potential (OCP) measurements, electrochemical impedance spectroscopy (EIS), and the scanning vibrating electrode technique (SVET). From this research, we provide valuable experimental data and also offer a powerful theory basis of copper corrosion in hot and dry atmosphere environment.
2 Experimental
2.1 Environment and material
Turpan has a typical hot and dry atmosphere environment, as has been monitored in Ref. [15], the annual average temperature in Turpan is 17.4 ��C, the average relative humidity is 27.9%, the annual total radiant quantity is 5513 MJ/m2, the average annual sunshine is 3200 h, the average annual rainfall is 16.4 mm, and the temperature changes severely between day and night with a maximum temperature difference greater than 40 ��C. These climatic conditions are expected to strongly affect the corrosion resistance of pure copper [16]. The soil in Turpan is a typical saline-alkali land and the average wind speed is approximately 2.5 m/s. In this region, sand storms are frequent, and the erosion of sand and dust is significant.
The exposed copper plates were carefully cleaned in alcohol using an ultrasonic cleaner, cleaned in deionized water, and then dried under a flow of cool air. The copper substrate pieces were cut from the exposed copper plates and were subsequently ground using SiC papers as fine as 1500-grit, polished with 0.1 ��m alumina polishing powder, degreased with alcohol, cleaned in deionized water, and then dried in a cool air flow. The working area in all of the electrochemical measurements was 10 mm �� 10 mm.
2.2 Mass-loss method
According to standard GB/T 16545-1996, hydro- chloric acid and deionized water with ratio of 1:1 was chosen. The exposed copper was de-rusted in an ultrasonic cleaner for approximately 3 min and then washed with water, carefully cleaned in alcohol using an ultrasonic cleaner, washed in deionized water, and dried in a cool air flow before being weighed.
2.3 Morphology observation and composition analysis
The macroscopic morphology was observed by digital camera, and the surface and cross-sectional morphologies of the samples were observed using a scanning electron microscope (Quanta 250) and energy-dispersive X-ray spectroscopy (EDS) techniques. The crystalline corrosion products formed on the exposed copper surface were analyzed by XRD (Bruker D8, Germany) on an instrument equipped with a Cu K�� radiation source (��=0.15406 nm); the samples were scanned over the 2�� range from 20�� to 80��. The phases present were identified using the Joint Committee on Powder Diffraction Standards (JCPDS) database. The chemical composition of the surface films formed was investigated by XPS (ESCALAB 250xi, Thermo Fisher) on an instrument equipped with an Al K�� X-ray source (hv=1486.6 eV) operated at 150 W. Because of the possible oxidation of the electrodes in air, they were sputter-coated with a 5 nm passive film using a 3 kV, 1 ��A Ar+-ion beam. The charge shift of the spectra was corrected by assuming that the C 1s peak was at 284.8 eV; the curve fitting was performed with the commercial software XPSpeak version 4.1 using Shirley background subtraction and a Gaussian�CLorentzian tail function.
2.4 Electrochemical measurements
The samples for electrochemical measurements were cut from the exposed copper plate into pieces with a rectangular shape (10 mm �� 10 mm). A 0.5% NaCl solution was prepared, and sufficient NaOH was added to adjust its pH to 9.0. Electrochemical measurements were performed using a VMP3 multichannel potentiostat (PARC, USA); all potentials are reported with respect to a saturated calomel electrode (SCE). The EIS measure- ments were conducted at the corrosion potential over the frequency range from 100 kHz to 10 mHz using a 10 mV (vs SCE) sinusoidal potential modulation. All electro- chemical tests were performed at ambient temperature ((25��1) ��C). While investigating the influence of temperature, we used a water bath to stabilize the temperature of the electrochemical cell.
2.5 Scanning vibrating electrode technique (SVET)
The SVET was used to measure the local distribution of the potentials on the exposed copper surfaces. The experiments were conducted on a M370 electrochemical workstation, which included a scanning microprobe with a tip, a 370 scanning control unit, a M236A potentiostat, and a video camera system. The SVET resolution was 100 nm; independent linear encoders were installed on all axes, and the stepper motors provided 8 nm resolution. Experiments were conducted in a single-electrode electrochemical cell with an exposed copper plate as the working electrode. The testing electrolyte was 0.5% NaCl solution (pH=9.0), the scanning area was 100 ��m �� 100 ��m, and the scanning steps were all 4 ��m/s. The tests were conducted at ambient temperature.
3 Results and discussion
3.1 Corrosion rate and deposit thickness
Figure 1 shows the mass loss rate of three pure copper samples after the 3-year outdoor exposure in Turpan. The corrosion rate was calculated according to equation 1 [17]:
 (1)
(1)
where �� represents the corrosion rate, g/(m2��a); G0 is the initial mass, g; G1 is the mass after the sample was cleaned, g; T is the exposure time, a; and A, B, and C are the length, width, and thickness, respectively, m. As evident in Fig. 1, the mass loss rates were similar, and the average corrosion rate was 2.43 g/(m2��a), which was relatively slow. Figure 2 shows the SEM cross-sectional morphology of three pure copper samples after the 3-year outdoor exposure in Turpan. The average deposit thickness was 2.90 ��m/a, which is much thinner than the average deposits formed in a marine atmosphere (5.90 ��m/a) [17].
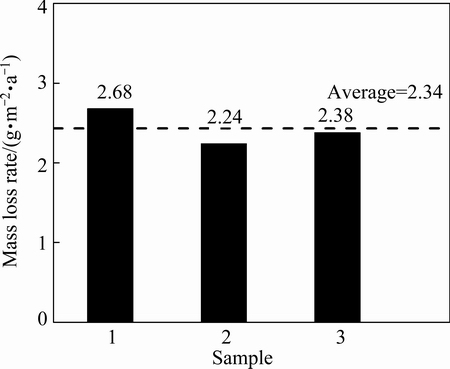
Fig. 1 Mass loss rate of three pure copper samples after 3-year outdoor exposure in Turpan
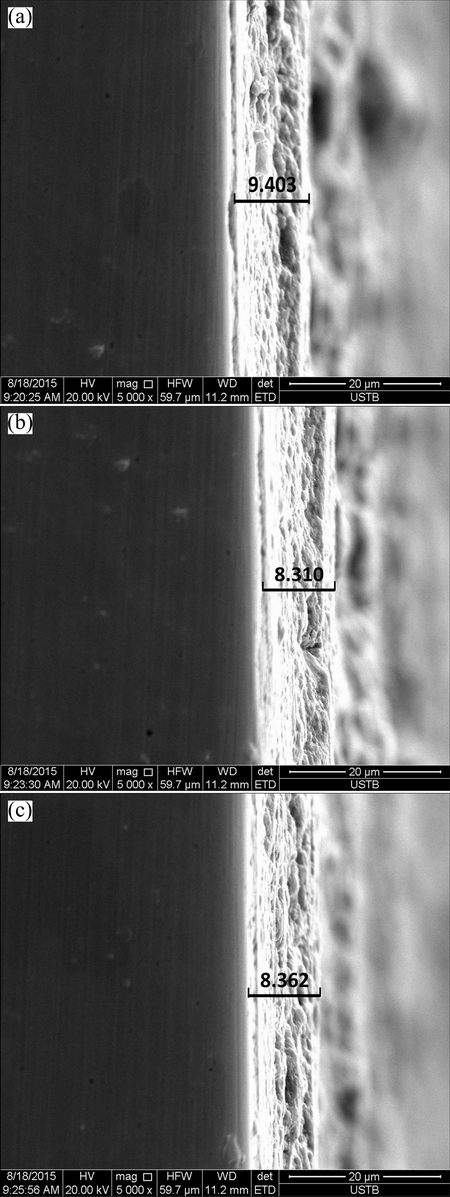
Fig. 2 SEM cross-sectional morphology of three pure copper samples after 3-year outdoor exposure in Turpan
3.2 Morphology and analysis of corrosion products
3.2.1 Macroscopic and microscopic morphology
Figure 3 shows the macroscopic morphology of the exposed copper plate before and after the samples were cleaned. The sample dimensions were 150 mm �� 70 mm �� 3 mm. Dark-brown corrosion products are clearly observed to cover the surface. In addition, some green mineral deposits are distributed on some locations; these deposits were tentatively identified as atacamite (Cu2Cl(OH)3) or basic cupric carbonate (Cu2(OH)2CO3) [8-10]. Figure 4 shows the SEM morphology of the exposed copper plate before and after it was cleaned. An uneven distribution of the corrosion products was observed on the surface; these products were attributed primarily to the dehydration process during the wet�Cdry and cold�Chot cycles in Turpan [15]. The cleaned substrate was porous.
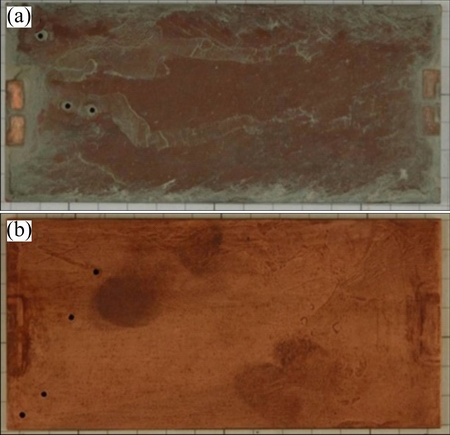
Fig. 3 Macroscopic morphology of exposed copper plate before (a) and after (b) being cleaned
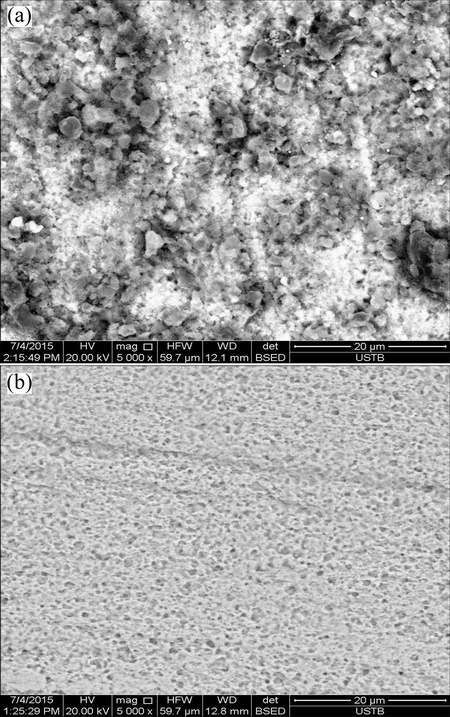
Fig. 4 SEM morphology of exposed copper plate before (a) and after (b) being cleaned
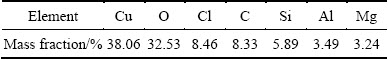
EDS results for the corrosion products on pure copper after the 3-year outdoor exposure at Turpan are shown in Table 1; the main elements are Cu, O, Cl, C, Si, Al, and Mg.
Table 1 EDS results for corrosion products on pure copper after 3-year outdoor exposure in Turpan
3.2.2 XPS and XRD results
The main compositions of the corrosion products of copper exposed in Turpan for 3 years were analyzed using XPS and XRD. The XPS survey spectrum of the copper subjected to 3 years of exposure is shown in Fig. 5. The presence of some solid pollutants, including Si, Al, Mg, Cl, and other soil elements, is clearly indicated; these pollutants are attributed to the high- speed wind and occasional sand storms at Turpan. Meanwhile, the soil in Turpan is a typical saline-alkali land, which means it contains a high chloride concentration. The XPS results are clearly consistent with the EDS results.
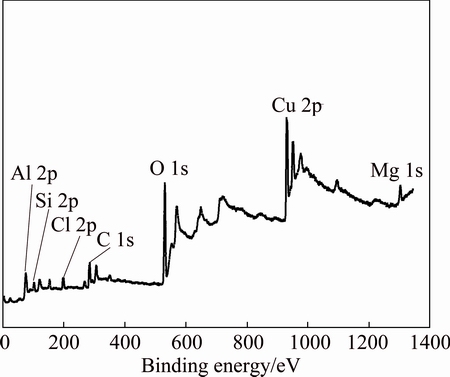
Fig. 5 XPS survey spectrum of copper plate subjected to 3 years of outdoor exposure in Turpan
To further investigate the composition of the deposits, high-resolution Cu 2p and O 1s spectra of the exposed copper were obtained; the results are presented in Fig. 6. In general, the Cu 2p spectrum of pure Cu is composed of two peaks: a Cu 2p3/2 peak at a binding energy of 952.45-952.56 eV and a Cu 2p1/2 peak at a binding energy of 932.20-933.1 eV [18]. The Cu 2p signals are shown in Fig. 6(a). These signals were characterized by a typical Cu 2p3/2 and Cu 2p1/2 doublet separated in energy by 20 eV. Using a fitting procedure described in previous papers [19,20], we determined that the Cu 2p3/2 peak of the exposure copper sample was composed of two peaks at 932.5 and 935.0 eV, which are assigned primarily to Cu2O/CuCl and to a Cu(II) compound, respectively. The Cu 2p1/2 peak was composed of two peaks located at 952.5 and 953.7 eV, which were assigned to Cu2O and to a Cu(II) compound, respectively [21]. In particular, the O 1s peak was deconvoluted into one at 530.3 eV, corresponding to O2-; one at 532.0 eV, corresponding to OH-; and one at 532.8 eV, corresponding to H2O.
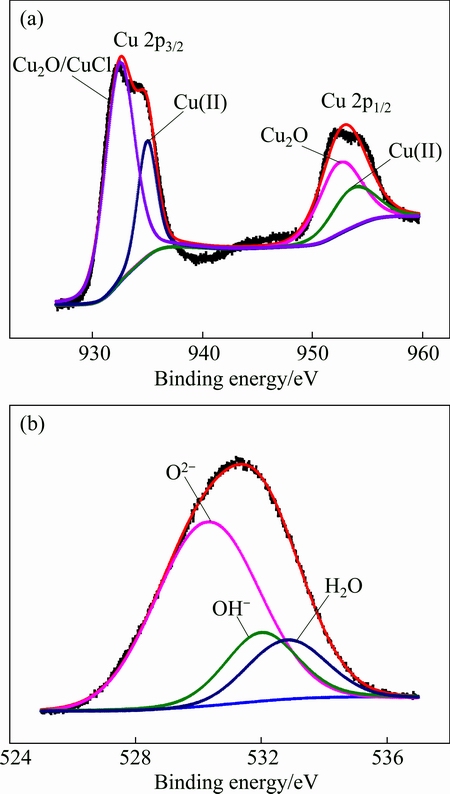
Fig. 6 High-resolution spectra of Cu 2p (a) and O 1s (b) for copper subjected to 3 years of outdoor exposure in Turpan
Figure 7 shows the XRD patterns of the corrosion products on pure copper after 3 years of outdoor exposure in Turpan. Only Cu2O and Cu2Cl(OH)3 were detected, consistent with the dark-brown and green deposits, respectively, observed in the macroscopic morphology examination. Cuprite was the predominant phase and formed first, irrespective of the exposure conditions. Cuprite is an electrically conducting compound and is known to play a decisive role in the protectiveness of corrosion layers on copper [12,22]. We thus considered the electrolyte film on the surface to be in contact with cuprite (no copper substrate), in which further oxidation occurs via the following reaction [23]:
2Cu2O+O2+4H2O+2Cl-��2Cu2Cl(OH)3+2OH- (2)
The XRD results in Fig. 7 show that atacamite is also present, which is also reported in the literature as one of the main constituents of copper patinas formed in marine atmospheres [24-27]. Because of the resolution of the X-ray diffractometer, some oxides or chlorides present in small quantities could not be detected.
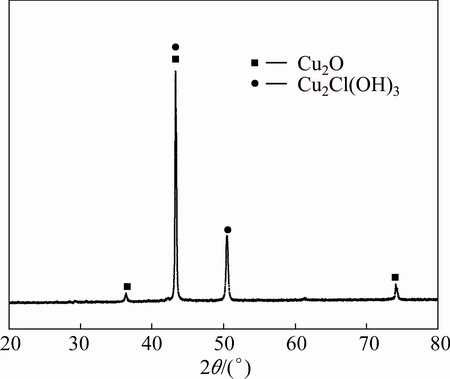
Fig. 7 XRD pattern of corrosion products on pure copper after 3 years of outdoor exposure in Turpan
3.3 Electrochemical results
The OCP of exposed copper in 0.5% NaCl (pH=9.0) as a function of time at 25, 30, and 35 ��C is displayed in Fig. 8. The potentials at the three temperatures rapidly stabilized and were essentially time-invariant at (-0.12��0.02) V (vs SCE) over the monitored period. All of the potentials decreased with increasing ambient temperature, which indicates that corrosion became more serious when the weather turned hot and humid.
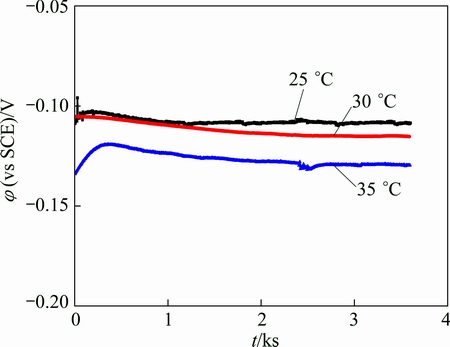
Fig. 8 Open-circuit potential of exposed copper sample in 0.5% NaCl (pH=9.0) as function of time at 25, 30, and 35 ��C
EIS is an efficient method to study the surface condition of metals and is also a powerful tool for evaluating the protectiveness of the corrosion product layer formed on metals [28,29]. Figure 9 shows the EIS results of the copper substrate and the copper subjected to 3 years of exposure; samples were cut from both the substrate plate and the exposed plate, and the data were collected with the samples immersed in 0.5% NaCl (pH=9.0) at room temperature.
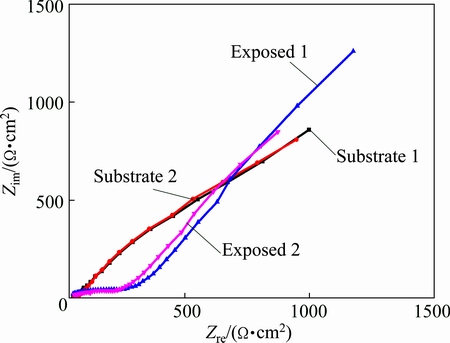
Fig. 9 EIS results of copper substrate and copper plate subjected to 3 years of exposure
To confirm the data obtained and presented as Nyquist plots, the Bode impedance and phase angle were also plotted, as shown in Fig. 10. The Bode impedance diagram clearly indicates that the exposed copper exhibits greater impedance than the copper substrate over the investigated frequency range, which simply reflects the protectiveness of the deposits on the copper surface. The impedance spectrum of the exposed copper exhibits a 45�� Warburg line in the low-frequency range, which indicates that the diffusion process plays a dominant role in the electrode reaction at low frequencies.
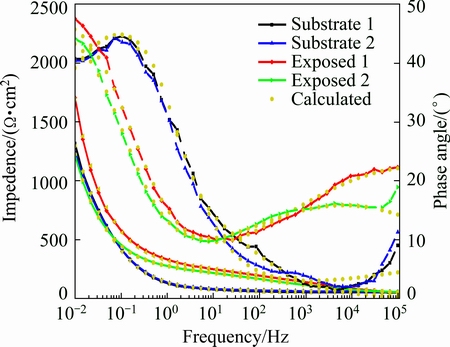
Fig. 10 Bode impedance and phase diagram
The equivalent circuit models in Fig. 11 were used to fit the EIS data in Fig. 9. In model (a), Rs is the solution resistance, CPE and Rf are the constant-phase element of the corrosion product layer and its resistance, respectively, and Cdl and Rt are the double-layer capacitance and the charge transfer resistance, respectively. In model (b), W is the Warburg resistance, which represents the diffusion of reaction ions.
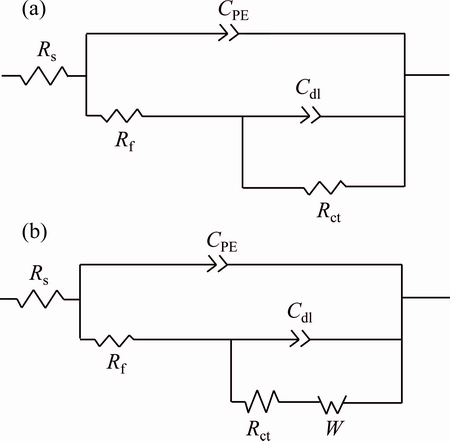
Fig. 11 Equivalent circuit used to fit EIS data for copper substrate (a) and exposed copper (b)
3.4 Scanning vibrating electrode technique (SVET) results
In this technique, the potential due to metal corrosion results in a very weak electric field within an electrolytic medium; this field can be imaged as the distribution of potentials on the exposed copper surfaces.
Figure 12 shows the SVET potential 2D contour map measured on the exposed copper in 0.5% NaCl solution (pH=9.0). The map shows that the potential distribution was not uniform; the maximum potential was approximately 1.54 ��V, whereas the minimum potential was approximately -3.72 ��V, indicating the porous and non-compact nature of the corrosion product deposits. Also, we observed that the lack of uniformity of the potential distribution was due to the porous structure of the deposit layer generating a spatial separation of cathodic and anodic reaction sites [30]. A similar situation has been observed in the case of 2A12 aluminum alloy during the initial stage of atmospheric corrosion [31,32]. Figure 13 shows the dimensions of some bulgy deposits observed during the SEM morphology observations of exposed copper; the dimensions of these bulgy deposits clearly coincide with the projected 2D contour map. This surface structure may accelerate the corrosion of copper in solution, which means that the protective effect of the deposits would be diminished in wet or rainy weather.
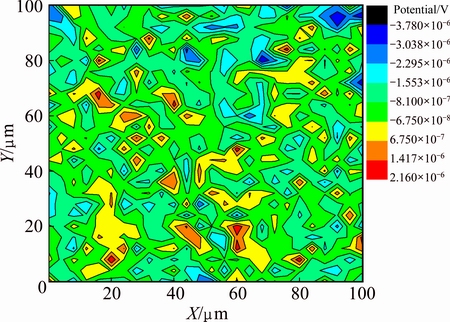
Fig. 12 SVET potential 2D contour map measured on exposed copper in 0.5% NaCl solution (pH=9.0) (Scan rate: 4 ��m/s)
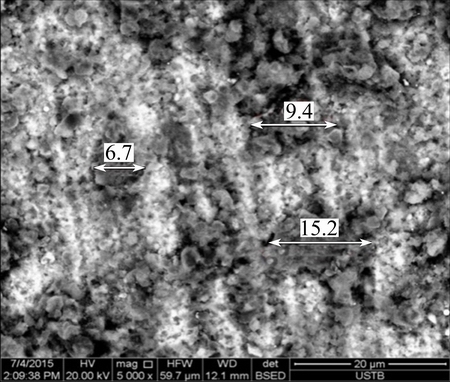
Fig. 13 Dimensions of some bulgy deposits observed in SEM morphology of exposed copper
4 Conclusions
1) The average corrosion rate is 2.43 g/(m2��a), which is relatively slow, and the average deposit thickness is 2.90 ��m/a, which is much thinner than the average deposit formed under a marine atmosphere.
2) The XRD and XPS results indicate that the corrosion products mainly consist of cuprite (Cu2O) and atacamite (Cu2Cl(OH)3).
3) The exposed copper exhibits greater impedance than the fresh copper over the investigated frequency range, which simply reflects the protectiveness of the deposits on the copper surface.
4) The SEM micrographs show that the corrosion products on the surface are unevenly distributed, which is attributed primarily to the dehydration process during the wet�Cdry and cold�Chot cycles in Turpan. The SVET results show that the potential distribution is not uniform and the dimensions of bulgy deposits coincide with the projected 2D contour map.
References
[1] POURBAIX M. Atlas of electrochemical equilibria in aqueous solutions [M]. Houston: National Association of Corrosion, 1974: 168-176.
[2] MORCILLO M, ROSALES B, ALMEIDA E, MARROCOS M. Atmospheric corrosion of copper in ibero-america [J]. Corrosion, 2001, 57(11): 967-980.
[3] FONSECA I T E, PICCIOCHI R, MENDONCA M H, RAMOS A C. The atmospheric corrosion of copper at two sites in Portugal: A comparative study [J]. Corrosion Science, 2004, 46(3): 547-561.
[4] DAN P, LEYGRAF C. In situ infrared reflection absorption spectroscopy for studies of atmospheric corrosion [J]. Journal of the Electrochemical Society, 1992, 140(5): 1256-1260.
[5] FITZGERALD K P, NAIRN J, SKENNERTON G, ATRENS A. Atmospheric corrosion of copper and the color, structure and composition of natural patinas on copper [J]. Corrosion Science, 2006, 48(9): 2480-2509.
[6] ROSS H B, NOONE K J. A numerical investigation of the destruction of peroxy radical by Cu ion catalysed reactions on atmospheric particles [J]. Journal of Atmospheric Chemistry, 1991, 12(2): 121-136.
[7] ODNEVALL W I, LEYGRAF C. Seasonal variations in corrosion rate and runoff rate of copper roofs in an urban and a rural atmospheric environment [J]. Corrosion Science, 2001, 43(12): 2379-2396.
[8] NASSAU K, GALLAGHER P K, MILLER A E, GRAEDEL T E. The characterization of patina components by X-ray diffraction and evolved gas analysis [J]. Corrosion Science, 1987, 27(7): 669-684.
[9] NASSAU K, MILLER A E, GRAEDEL T E. The reaction of simulated rain with copper, copper patina, and some copper compounds [J]. Corrosion Science, 1987, 27(7): 703-719.
[10] PICCARDO P, MODLINGER M, GHIARA G, CAMPODONICO S, BONGIORNO V. Investigation on a ��tentacle-like�� corrosion feature on bronze age tin-bronze objects [J]. Applied Physics A, 2013, 113(4): 1039-1047.
[11] FELIU S, MORCILLO M, JR S F. The prediction of atmospheric corrosion from meteorological and pollution parameters��I. Annual corrosion [J]. Corrosion Science, 1993, 34(3): 403-414.
[12] MENDOZA A R, CORVO F, GOMEZ A, GOME J. Influence of the corrosion products of copper on its atmospheric corrosion kinetics in tropical climate [J]. Corrosion Science, 2004, 46(5): 1189-1200.
[13] ZHANG X, HE W, ODNEVALL W I, PAN J, LEYGRAF C. Determination of instantaneous corrosion rates and runoff rates of copper from naturally patinated copper during continuous rain events [J]. Corrosion Science, 2002, 44(9): 2131-2151.
[14] WATANABE M, HIGASHI Y, TANAKA T. Differences between corrosion products formed on copper exposed in Tokyo in summer and winter [J]. Corrosion Science, 2003, 45(7): 1439-1453.
[15] LI Hui-yan, FANG Yue-hua, XIAO Kui, GUO Chun-yun, DONG Chao-fang, LI Xiao-gang. Progress of failure behavior of coatings in hot and dry atmosphere environment [J]. Science & Technology Review, 2012, 30(34): 76-79.
[16] CUI Z Y, LI X G, XIAO K, DONG C F. Atmospheric corrosion of field-exposed AZ31 magnesium in a tropical marine environment [J]. Corrosion Science, 2013, 76(2): 243-256.
[17] CUI Zhong-yu, XIAO Kui, DONG Chao-fang, DING Yuan, WANG Tao, LI Xiao-gang. Corrosion behavior of copper and brass in serious Xisha marine atmosphere [J]. The Chinese Journal of Nonferrous Metals, 2013, 23(3): 742-749. (in Chinese)
[18] CANO E, TORRES C L, BASTIDAS J M. An XPS study of copper corrosion originated by formic acid vapour at 40% and 80% relative humidity [J]. Materials & Corrosion, 2001, 52(9): 667�C676.
[19] HAUPT S, CALINSKI C, COLLISI U, HOPPE H W, SPECKMANN H, STREHBLOW H. XPS and ISS examinations of electrode surfaces and passive layers with a specimen transfer in a closed system [J]. Surface & Interface Analysis, 1986, 9(6): 357-365.
[20] MOULDER J F. Handbook of X-ray photoelectron spectroscopy [J]. Perkin-Elmer Corporation, USA, 1992.
[21] MEZZI A, ANGELINI E, DE CARO T, GRASSINI S, FARALDI F, RICCUCCI C. Investigation of the benzotriazole inhibition mechanism of bronze disease [J]. Surface & Interface Analysis, 2012, 44(8): 968-971.
[22] CROLET J L, THEVENOT N, NESIC S. Role of conductive corrosion products in the protectiveness of corrosion layers [J]. Corrosion, 1998, 54(3): 194-203.
[23] GOIDANICH S, BRUNK J, HERTING G, ARENAS M A, WALLINDER I O. Atmospheric corrosion of brass in outdoor applications: Patina evolution, metal release and aesthetic appearance at urban exposure conditions [J]. Science of the Total Environment, 2011, 412: 46-57.
[24] KUCERA V, TIDBLAD J, KREISLOVA K, KNOTKOVA D, FALLER M, REISS D. UN/ECE ICP Materials dose-response functions for the multi-pollutant situation [J]. Water Air & Soil Pollution Focus, 2007, 7(1-3): 249-258.
[25] ODNEVALL I, LEYGRAF C. Atmospheric corrosion of copper in a rural atmosphere [J]. Journal of the Electrochemical Society, 1995, 142(11): 3682-3689.
[26] GRAEDEL T E, NASSAU K, FRANEY J P. Copper patinas formed in the atmosphere��I. Introduction [J]. Corrosion Science, 1987, 27(87): 639-657.
[27] GRAEDEL T E, FRANEY J P, KAMMLOTT G W. The corrosion of copper by atmospheric sulphurous gases [J]. Corrosion Science, 1983, 23(11): 1141-1152.
[28] WANG J, WANG Z Y, KE W. A study of the evolution of rust on weathering steel submitted to the Qinghai salt lake atmospheric corrosion [J]. Materials Chemistry & Physics, 2013, 139(1): 225-232.
[29] KATAYAMA H, KURODA S. Long-term atmospheric corrosion properties of thermally sprayed Zn, Al and Zn-Al coatings exposed in a coastal area [J]. Corrosion Science, 2013, 76(2): 35-41.
[30] MENG G Z, ZHANG C, CHENG Y F. Effects of corrosion product deposit on the subsequent cathodic and anodic reactions of X-70 steel in near-neutral pH solution [J]. Corrosion Science, 2008, 50(11): 3116-3122.
[31] DONG Chao-fang, SHENG Hai, AN Yin-hui, LI Xiao-gang, XIAO Kui. Local electrochemical behavior of 2A12 aluminium alloy in the initial stage of atmospheric corrosion under Cl- conditions [J]. Journal of University of Science & Technology Beijing, 2009, 31(7): 878-883. (in Chinese)
[32] DONG Chao-fang, AN Yin-hui, LI Xiao-gang, SHENG Hai, XIAO Kui. Electrochemical performance of initial corrosion of 7A04 aluminium alloy in marine atmosphere [J]. The Chinese Journal of Nonferrous Metals, 2009, 19(2): 346-352. (in Chinese).
�³�1��������1�����»�2��Ф ��1��������2���� ��2��������1
1. �����Ƽ���ѧ ��ʴ������������ص�ʵ���ң���ʴ�������ģ����� 100083��
2. �½���³����Ȼ�����������ģ���³�� 838200
ժ Ҫ������ʧ�ز��ԡ���ò�۲졢�ɷַ����͵绯ѧʵ��Է�������³�����ȴ���������3��Ĵ�ͭ���д�����ʴ�о��������ʾ��ƽ��ʧ������Ϊ2.90 ��m/a��Զ���ڴ��ں����µĸ�ʴ���ʣ�ͭ�Ĵ�����ʴ������Ҫ��Cu2O��Cu2Cl(OH)3��ɣ������ڸ�ʪ������ѭ������ʴ����ֲ������ȣ��绯ѧʵ���������ʴ����Ĵ�������ֹ��ʴ�Ľ�һ�����������Dz���IJ����ȷֲ�����һ���̶��ϼ��ٸ�ʴ�Ľ��̡�
�ؼ��ʣ�ͭ��������ʴ���ɷַ������绯ѧ����
(Edited by Yun-bin HE)
Foundation item: Project (51222106) supported by the National Natural Science Foundation of China; Project (FRF-TP-14-011C1) supported by the Fundamental Research Funds for the Central Universities, China; Project (2014CB643300) supported by the National Basic Research Program of China
Corresponding author: Chao-fang DONG, Tel: +86-10-62333931-518; Fax: +86-10-62334005; E-mail: cfdong@ustb.edu.cn
DOI: 10.1016/S1003-6326(16)64281-4

